 Open Access Article
Creative Commons Attribution 3.0 Unported Licence
Adaptive kinetic Monte Carlo simulation of solid oxide fuel cell components†
David S. D.
Gunn
*a,
Neil L.
Allan
b and
John A.
Purton
a
aSTFC, Daresbury Laboratory, Keckwick Lane, Daresbury, WA4 4AD, UK. E-mail: david.gunn@stfc.ac.uk
bSchool of Chemistry, University of Bristol, Bristol, BS8 1TS, UK
First published on 24th June 2014
Abstract
Ionic conductivities in the solid oxide fuel cell (SOFC) electrolytes yttria-stabilised zirconia (YSZ), calcia-stabilised zirconia (CSZ), gadolinium-doped ceria (GDC) and samarium-doped ceria (SDC) and the cathode material lanthanum strontium cobalt oxide (LSCO) are directly calculated using DL_AKMC, an adaptive kinetic Monte Carlo (aKMC) program which assumes limited a priori knowledge of the kinetics of systems. The materials were simulated over several milliseconds and over the range of experimentally most relevant temperatures and dopant concentrations (2–18 mol% for doped zirconia, 5–25 mol% for doped ceria and 5–80 mol% for LSCO). Ionic conductivities of the electrolytes at 1000 K are in good agreement with the observed values: CSZ in the range 3 × 10⁻³ to 1 × 10⁻² S cm−1 depending on dopant concentration, YSZ 4 × 10⁻³ to 3 × 10⁻² S cm−1, GDC 1 × 10⁻² to 5 × 10⁻² S cm−1, SDC 1 × 10⁻² to 7 × 10⁻² S cm−1. LSCO is predicted to have an ionic conductivity of the order of 10−2 to 10−1 S cm−1 depending on Sr content. Average activation energies over all migration processes are 0.4–0.5 eV for the stabilised zirconias and 0.2–0.3 eV for the doped cerias and 0.3 eV for LSCO, in agreement with experiment. aKMC provides a distinct advantage over traditional KMC methods, in which one has to provide a list of system state transitions. Here, all of the state transitions are dynamically generated, leading to a more accurate simulation of the kinetics as the system evolves.
1 Introduction
Due to growing concern about global warming and dwindling supplies of fossil fuels, increasing interest is being directed towards alternative sources of energy. Popular and promising alternatives are fuel cells, and a substantial amount of research and development has been undertaken to improve the materials used in these devices. In solid oxide fuel cells (SOFCs) the oxidant (e.g. air, O2) is reduced at the cathode. The oxide ions produced are then transported through the solid electrolyte material, ideally a purely ionic conductor, to the anode where the fuel (e.g. H2, hydrocarbons) is oxidised. Electrons from this process then flow from the anode to the cathode, completing the circuit and generating power. Lowering the operating temperature of SOFCs to an intermediate temperature range of 600–800 °C is an ongoing area of intense research and many materials have been suggested as suitable electrolytes1–3 and electrodes4–9 for this purpose.Stabilised zirconias doped with lower valency ions such as yttrium (YSZ) or calcium (CSZ) along with ceria doped with gadolinium (GDC) and samarium (SDC) exhibit very high ionic conductivities associated with mobile oxygen vacancies formed as a consequence of the doping and are typically used as electrolytes in SOFCs. Previous computational studies of YSZ have tended to use molecular dynamics (MD)10 or density functional theory (DFT)11,12 in combination with kinetic Monte Carlo (KMC) to investigate the oxide ion diffusion kinetics,13,14 as timescales tend to be limited if MD or particularly DFT is used in isolation. Typically common atomistic KMC models employ an on-lattice approximation which limits their ability to describe a system which undergoes large structural changes. This approach also requires a list of possible event mechanisms determined a priori, through experimental and theoretical methods, by estimation or even guessing. This is naturally a severe limitation as the processes involved in the atomic motion are not necessarily intuitive and can be extremely difficult to predict in advance.15 Furthermore, as the simulation advances the structure of the system changes leading to new possible transitions and altering the activation energies of existing transitions. To overcome these limitations various ‘on-the-fly’ approaches, such as adaptive KMC (aKMC),16 have been proposed. These are designed for an off-lattice system and the saddle-points between different possible states of the system are located as the simulation progresses. These methods overcome the limitations of the traditional KMC approaches by avoiding the need for a list of mechanisms provided beforehand. State transitions not predicted in advance are allowed, thus permitting a thorough search of the energy landscape and ensuring that the kinetic model is as realistic as possible. As in traditional KMC, certain assumptions are made when using aKMC, namely that the system transitions adhere to harmonic transition state theory.17,18 Here, we also assume that the pre-exponential factors, used in the calculation of transition rates, are equal to a typical vibrational frequency (1013 s−1).
2 Methodology
2.1 aKMC
The key to the aKMC approach is an efficient way to search for saddle points that link the current state of the system to another. One popular approach is the ‘dimer’ method,19 the implementation of which used in this work has been described in detail elsewhere.20 The dimer algorithm begins with a random starting position within the energy basin and progresses by climbing uphill along the lowest eigenvector corresponding to the lowest value eigenvalue of the Hessian matrix, eventually reaching a saddle point at the top. This is a particularly efficient method as only first derivatives of the energy21 are required. If all the saddle points leading to different system states can be located, the activation energies of each of these pathways can be supplied to the KMC procedure and, with the pre-Arrhenius frequency factor, the rates of each pathway determined. The system can then be propagated in a dynamically correct way to the next state, and the entire procedure is repeated.In practice, however, it is computationally demanding (effectively impossible) to find all the saddle points and demonstrate that all have been found, and the number of saddle points bounding a state grows exponentially with the dimensionality of the system. Xu and Henkelman22 have developed a method to quantify a ‘confidence limit’ for each state that enough relevant saddle points have been found to progress the simulation with a pre-defined level of confidence and this approach has been implemented here. Their method supposes that all of the relevant kinetic events possess activation energies within the range mkBT of the lowest barrier process. m should be carefully chosen, and large enough that relevant transitions are not omitted. For example, for m = 20, an event at the upper limit will be e−20 ≈ 10−9 as likely to occur as one at the lower limit, assuming that the pre-factors are equal. Events that occur within these limits are therefore relevant to the kinetics of the system, and the confidence (C) that a relevant saddle has not been missed is:
 | (1) |
We use a new adaptive KMC program, DL_AKMC,† as follows. Initially the provided material structure is minimised using a user-specified algorithm as implemented in DL_FIND.23 Possibilities are steepest descent, conjugate gradient following Polak–Ribiére,24 L-BFGS,25,26 P-RFO,27–30 Newton–Raphson/quasi-Newton, damped dynamics, random (stochastic) search31,32 or by a genetic algorithm.33–35 This minimised structure is then used as the initial basin for the task-farmed saddle-point searches either by the improved dimer method19,20 or the NEB method36 as implemented in DL_FIND, as specified by the user. These dimer searches are initiated near the local minimum by displacing the system away from the minimum in a random direction. The algorithm for displacement used here is general – each atom is displaced up to a maximum of ±0.4 Å.
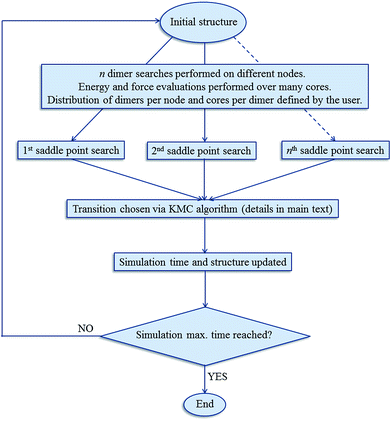
The kinetic Monte Carlo algorithm has been documented elsewhere37,38 and Fig. 1 gives a brief overview of the parallelisation used. Once all of the transitions have been identified, the rate νi for each event i is then obtained from eqn (2):
 | (2) |
 | (3) |
2.2 Ionic conductivity
Key to the operation of an SOFC electrolyte or cathode is its ionic conductivity. For efficient functioning of the fuel cell both electrolytes and cathodes should possess high such conductivity. This is related to the oxygen self diffusion coefficient by the Nernst–Einstein relation (eqn (4)): | (4) |
Grope et al.39 and Pornprasertsuk et al.11 have simulated such systems circumventing this issue by direct inclusion of an applied field. In their approach, the electrolyte is split into a series of ‘slices’ that are infinite in two dimensions (y- and z-) perpendicular to the direction of the applied field (see Fig. 2). The applied field alters the activation energy barrier for ion migration (eqn (5)):
| ΔEcorr = ΔE0 + αzieVshift | (5) |
| Vitotal = Vielec + Visc | (6) |
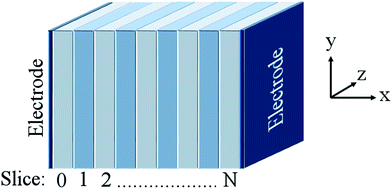 | ||
| Fig. 2 Generalised illustration of the supercell used in this work, where the ‘slices’ are infinite in y- and z-dimensions and the electric field is applied along the x-direction. | ||
V i elec is the potential on slice i due to charge accumulation at the electrodes. Electrons are assumed to have a much higher mobility than oxide ions and so Vielec is equal to the difference between Vitotal and Visc. In our simulations, Velec is assumed to vary linearly across the electrolyte:
 | (7) |
V 0elec, the electrode potential in the initial slice, labelled 0, is set to zero for convenience. VNelec is the electrode potential on slice N, the final slice in our configuration. The space charge potential per slice, i is given by:
 | (8) |
V 0sc, the space charge potential in the initial slice, 0, set to zero. The slice spacing of all the cubic unit cells of the crystal structures considered in this work is half the lattice parameter, a. In using eqn (8) during the simulation, ionic movement is assumed not to change the geometry of the simulation cell. Ei is the electric field associated with each infinite slice, i given by:
 | (9) |
Vappl(t) = V0![[thin space (1/6-em)]](https://www.rsc.org/images/entities/char_2009.gif) cos(2πft) cos(2πft) | (10) |
 | (11) |
For the aKMC calculations the materials were simulated for a minimum of 1 ms, and a summary of the parameters required is given in Table 1.
| Vacuum permittivity, ε0/(F m−1): | 8.854 × 10⁻¹² |
| Relative permittivity, εr: | 40 |
| Vibrational frequency, ν0/Hz: | 1 × 10¹³ |
| V 0 (eqn (10)/V: | 0.5 |
| Frequency of applied field, f/Hz: | 1 × 10⁷ |
2.3 Application to oxides
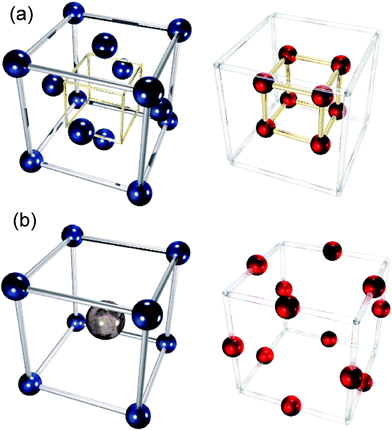
We have investigated four solid oxide fuel cell (SOFC) electrolyte materials with the fluorite structure: yttria- and calcia-stabilised zirconica (YSZ and CSZ respectively, with dopant concentrations varying from 2–18 mol%) and gadolinium- and samarium doped ceria (GDC and SDC respectively, with dopant concentrations varying from 5–25 mol%), and one cathode material with the perovskite structure, strontium-doped LaCoO3 (LSCO, with dopant concentrations varying from 5–80 mol%). Pictures of the two structures are shown in Fig. 3. YSZ, CSZ, SDC and GDC are all stable at intermediate temperature SOFC operating temperatures (up to 900 °C), and YSZ, SDC and GDC all possesses high ionic conductivities (∼10−2 S cm−1 at 700 °C).41,42 Doping of zirconia involves substitution of some some Zr4+ ions with Y3+ or Ca2+ and of ceria replacement of some Ce4+ with Gd3+ or Sm3+. To maintain charge neutrality, one oxygen vacancy is created for every two Zr or Ce ions replaced with Y, Gd or Sm ions. When Zr ions are replaced with Ca ions, one oxygen vacancy is created per ion replaced. This gives rise to a considerable number of oxide ion vacancies which greatly increase the ionic conductivity of these materials relative to the undoped systems.2.4 Potential model
For the adaptive kinetic Monte Carlo simulations a rigid-ion model, including 2-body Buckingham potentials is used (eqn (12)) to model the atomic interactions. The potential parameter set is listed in Table 2. A non-Coulombic potential cutoff of 12 Å was used throughout. Each ion is assigned an integer charge, i.e. +2 for Ca and Sr, +3 for Gd, Sm, La and Co, +4 for Zr and Ce and −2 for O. | (12) |
| Interaction | A/eV | ρ/Å | C/(eV Å6) | Reference |
|---|---|---|---|---|
| Ca2+–O2− | 1090.40 | 0.3440 | 0.00 | Ref. 43 |
| Sr2+–O2− | 959.10 | 0.3721 | 0.00 | Ref. 44 |
| Y3+–O2− | 1325.60 | 0.3461 | 0.00 | Ref. 45 |
| Gd3+–O2− | 1962.74 | 0.3250 | 0.00 | Ref. 46 |
| Sm3+–O2− | 1944.44 | 0.3414 | 21.49 | Ref. 47 |
| La3+–O2− | 1545.21 | 0.3590 | 0.00 | Ref. 48 |
| Co3+–O2− | 1329.82 | 0.3087 | 0.00 | Ref. 48 |
| Zr4+–O2− | 1024.60 | 0.3760 | 0.00 | Ref. 45 |
| Ce4+–O2− | 1809.68 | 0.3547 | 20.40 | Ref. 49 |
| O2−–O2− | 17 428.92 | 0.1490 | 27.89 | Ref. 46 |
Since our potential set uses a number of potentials from different sources, we have validated the set by checking good agreement between simulated and experimental values for bulk properties (lattice parameter, elastic constants and bulk modulus) of a number of binary oxides using the GULP code.50 The results are shown in the ESI, Section 3.†
Cubic supercells containing 4 × 4 × 4 cubic unit cells (for SDC, GDC, YSZ and CSZ) and 6 × 6 × 6 cubic unit cells (for LSCO) were constructed and both the dopant cations and required oxygen vacancies were placed randomly in the lattice, subject to the constraint that each slice (0 to N, see Fig. 2) has zero net charge. It has been suggested that the oxygen vacancies in YSZ preferentially occupy sites near to yttrium ions (second nearest neighbour positions51), which is not reflected in our choice of initial structure (randomly distributed stabilisers and vacancies). We have performed studies investigating the influence of the starting structure on the ionic conductivities at the end of the adaptive kinetic Monte Carlo simulations. Both structures with anion vacancies and dopant cations as nearest neighbours, and structures with anion vacancies and dopant cations separated by a minimum of 4.5 Å result in ionic conductivities similar to those seen with the random arrangement used here. The initial arrangement of the dopant atoms and vacancies appears to bear little influence on the ionic conductivity of the material at the end of the simulations. More detail on this is given in the ESI, Section 1.† The initial random structures used in this work were equilibrated for 20 ps (NPT ensemble) using DL_POLY52 at the temperature used in the subsequent DL_AKMC simulation (typically 300 K, with the exception of those used to create the Arrhenius plot in Fig. 9 later). After equilibration each slice was checked to ensure charge neutrality was maintained, with the resulting arrangements used as input structures for DL_AKMC.
To check further the quality of the potentials employed, the lattice parameters of the simulation cells (after equilibration) are compared with experimental lattice parameters as a function of the dopant concentration (Fig. 4 and 5).
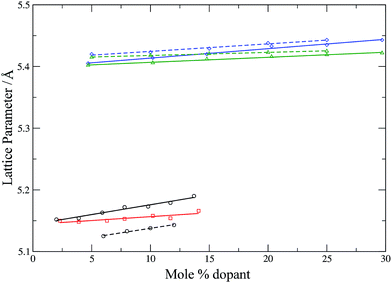 | ||
| Fig. 4 Calculated (solid lines) and experimental (dashed lines) lattice parameters for YSZ53 (circles, black), CSZ (squares, red), GDC42 (triangles, green) and SDC42 (diamonds, blue) as a function of dopant concentration. Lines are intended as a guide for the eye. | ||
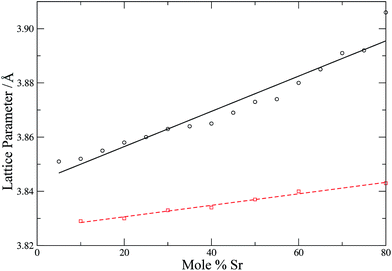 | ||
| Fig. 5 Calculated (circles, black solid line) and experimental54 (squares, red dashed line) lattice parameters for LSCO as a function of strontium content. Lines are intended as a guide for the eye. | ||
Fig. 4 shows that the calculated lattice parameters for the doped zirconias and cerias agree with the experimental values with a match of <1%. Similarly, the lattice parameters for LSCO are in good agreement, with the calculated lattice parameter slightly larger then experiment (by 0.6–1.6%). Both experiment and simulation agree as to the increase of the lattice parameter of the doped system with increasing dopant content. Our potentials thus describe these systems adequately and are suitable for use with adaptive kinetic Monte Carlo.
3 Results and discussion
Conductivities were calculated (eqn (11)) for all the materials and the results are shown in Fig. 6 and 7 for the electrolyte materials and Fig. 8 for LSCO, along with some representative experimental values. It can be seen that there is good agreement between the simulations and experiment for all of the materials modelled. In particular the calculated values of the ionic conductivities in the doped cerias (Fig. 7) match very closely the experimental magnitude of the conductivity, and its variation with dopant concentration. The calculated maximum in conductivity for SDC occurs at 16 mol%, higher than that found experimentally by 2 mol%. Our choice of electrolytes has been governed by their high ionic conductivity and low electronic conductivity and so we would expect that our simulations, which solely determine the ionic conductivity, should agree with the experimental values which are the sum of ionic and electronic contributions. The good agreement found between the calculated and experimental conductivities is emphasised by our use of linear y-axes, in contrast to the logarithmic scale typically deployed for such figures.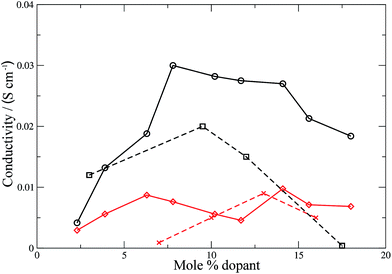 | ||
| Fig. 6 Ionic conductivities for YSZ (calculated: black solid line, circles; experimental:60 black dashed line, squares) and CSZ (calculated: red solid line, diamonds; experimental:58 red dashed line). Lines are intended as a guide for the eye. | ||
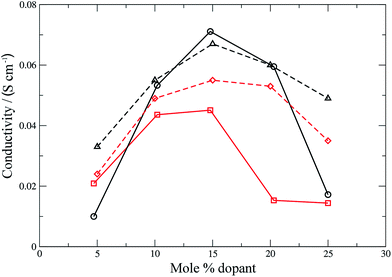 | ||
| Fig. 7 Ionic conductivities for SDC (calculated: black solid line, circles; experimental:42 black dashed line, triangles) and GDC (calculated: red solid line, squares; experimental:42 red dashed line, diamonds). Lines are intended as a guide for the eye. | ||
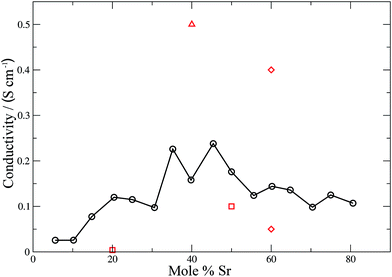 | ||
| Fig. 8 Calculated (solid black line, circles) and experimental (red squares,59 diamonds61 and triangles62) ionic conductivities for LSCO. The line is intended as a guide for the eye. | ||
The form of the ionic conductivity versus dopant concentration figures has been discussed by others.55,56 For YSZ in particular, the decrease in conductivity at larger dopant concentrations has been attributed, at least in part, to the formation of strongly-bound  complexes reducing the availability of free
  available for diffusion.57 CSZ exhibits a more unusual curve, with two maxima appearing in the dopant range simulated. While the location and magnitude of the second maximum at 14 mol% matches well with the experimental data available,58 the general paucity of experimental ionic conductivity measurements for CSZ is such that there are no data for comparison at 6 mol%, and so the first maximum remains an interesting prediction for future verification. It is possible this first maximum may be simply an artifact of the simulation, and a discussion on the reproducibility of results and influence of the starting configuration is given in the ESI, Sections 1 and 2.†
For a mixed electronic and ionic conductor such as LSCO the electronic conductivity σel ∼ 102–103 S cm−1, dominates.59 The simulated values of the ionic conductivity (σion) shown in Fig. 8 cannot be compared directly with experiment. However values of σion have been calculated from experimental oxygen diffusion coefficients and the Nernst–Einstein equation. These values are in the range 10−3 to 10−1 S cm−1 at 900 °C depending on composition.59 These experimentally-derived values, relate to different temperatures (1048–1173 K), but do highlight the broad margin of error inherent in these measurements. Our theoretically determined values fall within the experimental range of ionic conductivities, and exhibit a coherent trend across the entire dopant range. A maximum in the ionic conductivity is found at ∼48 mol% Sr. Combined with the good agreement between theory and experiment for the electrolytes, we are confident that our values for the ionic conductivity of the LSCO cathode are accurate. Materials such as LSCO, where experimental values are difficult to obtain, emphasise the importance of these simulations for extracting important physical properties that would otherwise be difficult or impossible to measure experimentally.
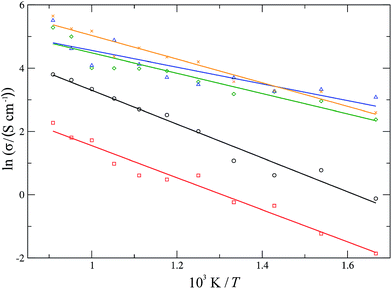
For each material, one experimentally common dopant concentration was chosen (10 mol% for YSZ and CSZ, 20 mol% for SDC and GDC and 50 mol% for LSCO) and simulated over a temperature range of 600–1100 K. The conductivities were determined over these temperature ranges and the resultant Arrhenius plot is shown in Fig. 9. The average activation energy of the migration processes occurring in each material can be determined from the gradient of a linear fit to the data. For the stabilised zirconias this average activation energy is 0.46 ± 0.03 eV for YSZ and 0.44 ± 0.03 eV for CSZ. The YSZ activation energy, while lower than the experimentally determined values63,64 of 0.8–1.0 eV, is in keeping with other simulated values65,66 which range from 0.2–0.9 eV. The doped cerias exhibit a lower average activation energy for diffusion, with calculated values of 0.23 ± 0.04 eV for SDC and 0.28 ± 0.03 eV for GDC, lower than the experimentally determined values of around 0.9 eV for 20 mol% SDC and GDC.67 LSCO has an average activation energy similar to that of the doped cerias, 0.32 ± 0.02 eV. Experimentally for LSCO, reported activation energies of the migration processes59,68 vary greatly from 0.6–2.2 eV for 20 mol% Sr. De Souza et al.59 also found that the activation energy dropped substantially on increasing the strontium content, with the activation energy dropping to 1.4 eV for 50 mol% Sr from 2.2 eV for 20 mol%. In general we find that the calculated activation energies for the migration processes in these materials are lower than those found experimentally. This can possibly be attributed to the use of a fixed charge, rigid-ion model where the ionic charge does not change throughout the simulation; in reality the charges on the ions are likely to change depending on the local environment.
4 Conclusion
The reliability of the adaptive kinetic Monte Carlo program DL_AKMC has been verified by the accurate simulation of ionic conductivities of the solid electrolytes yttria- and calcia-stabilised zirconica (YSZ and CSZ respectively), gadolinium- and samarium doped ceria (GDC and SDC respectively), and of one cathode material with the perovskite structure, strontium-doped LaCoO3 (LSCO). The calculated ionic conductivities of all the materials are of the same order of magnitude as those found experimentally. The variation of ionic conductivity with dopant concentration follows the same form as experiment. The simulations also indicate the presence of a possible peak in the conductivity of CSZ at ∼6 mol%, which would be of interest to probe experimentally. Average activation energies of all migration processes are between 0.4–0.5 eV for the stabilised zirconias, between 0.2 and 0.3 eV for the doped cerias and 0.3 eV for LSCO.This work has showcased the ability of the program to simulate experimentally measurable and important properties, while retaining the flexibility of using common potential types and the ability to determine transition states on-the-fly in a massively parallel fashion. Measuring solely the ionic conductivity in mixed ionic-electronic conductors is difficult, and there is a large variation in the experimental ionic conductivity, particularly with LSCO. The ability for a simulation to model reliably the ionic conductivity of such mixed conductors with high precision and accuracy is of critical importance, and such predictions are now achievable and efficient. Given the flexibility and general applicability of the DL_AKMC program, it will likely prove to be a vital tool in a wide range of scientific fields.
The authors would like to thank John Harding, Karl Travis and Ilian Todorov for helpful conversations. This work has been supported by the HECToR Distributed Computational Science and Engineering (CSE) Service operated by NAG Ltd., and by the UK Engineering and Physical Sciences Research Council (EPSRC) under Grant EP/H012990/1.
References
- T. H. Etsell and S. N. Flengas, J. Electrochem. Soc., 1890, 118, 1971 Search PubMed.
- D. P. Fagg, V. V. Kharton and J. R. Frade, J. Electroceram., 2002, 9, 199 CrossRef CAS.
- T. S. Zhang, J. Ma, Y. J. Leng, S. H. Chan, P. Hing and J. A. Kilner, Solid State Ionics, 2004, 168, 187 CrossRef CAS PubMed.
- F. M. Figueiredo, F. M. B. Marques and J. R. Frade, Solid State Ionics, 1998, 111, 273 CrossRef CAS.
- A. Y. Zuev, A. N. Petrov, A. I. Vylkov and D. S. Tsvetkov, J. Mater. Sci., 1901, 42, 2007 Search PubMed.
- W. Zhou, W. Jin, Z. Zhu and Z. Shao, Int. J. Hydrogen Energy, 2010, 35, 1356 CrossRef CAS PubMed.
- H. Fukunaga, M. Koyama, N. Takahashi, C. Wen and K. Yamada, Solid State Ionics, 2000, 132, 279 CrossRef CAS.
- Z. P. Shao and S. M. Haile, Nature, 2004, 431, 170 CrossRef CAS PubMed.
- R. Sayers, N. L. O. Flack, J. Alaria, P. A. Chater, R. G. Palgrave, S. R. C. McMitchell, S. Romani, Q. M. Ramasse, T. J. Pennycook and M. J. Rosseinsky, Chem. Sci., 2013, 4, 2403 RSC.
- P. F. Shimojo and H. Okazaki, J. Phys. Soc. Jpn., 1992, 61, 4106 CrossRef.
- R. Pornprasertsuk, J. Cheng, H. Huang and F. B. Prinz, Solid State Ionics, 2007, 178, 195 CrossRef CAS PubMed.
- R. Krishnamurthy, Y. G. Yoon, D. J. Srolovitz and R. Car, J. Am. Ceram. Soc., 1821, 87, 2004 Search PubMed.
- D. J. Harris, T. S. Farrow, J. H. Harding, M. Y. Lavrentiev, N. L. Allan, W. Smith and J. A. Purton, Phys. Chem. Chem. Phys., 1839, 7, 2005 Search PubMed.
- M. Y. Lavrentiev, D. J. Harris, J. H. Harding, N. L. Allan and J. A. Purton, Dalton Trans., 2004, 3071 RSC.
- D. J. Harris, M. Y. Lavrentiev, J. H. Harding, N. L. Allan and J. A. Purton, J. Phys.: Condens. Matter, 2004, 16, L187 CrossRef CAS.
- G. Henkelman and H. Jónsson, J. Chem. Phys., 2001, 115, 9657 CrossRef CAS PubMed.
- C. Wert and C. Zener, Phys. Rev., 1949, 76, 1169 CrossRef CAS.
- G. H. Vineyard, J. Phys. Chem. Solids, 1957, 3, 121 CrossRef CAS.
- G. Henkelman and H. Jónsson, J. Chem. Phys., 1999, 111, 7010 CrossRef CAS PubMed.
- J. Kästner and P. Sherwood, J. Chem. Phys., 2008, 128, 014106 CrossRef PubMed.
- A. F. Voter, Phys. Rev. Lett., 1997, 78, 3908 CrossRef CAS.
- L. Xu and G. Henkelman, J. Chem. Phys., 2008, 129, 114104 CrossRef PubMed.
- J. Kästner, J. M. Carr, T. W. Keal, W. Thiel, A. Wander and P. Sherwood, J. Phys. Chem. A, 2009, 113, 11856 CrossRef PubMed.
- E. Polak and G. Ribiére, Ref. Fr. Inf. Rech. Op., 1969, 3, 35 Search PubMed.
- D. C. Liu and J. Nocedal, Math. Program., 1989, 45, 503 CrossRef.
- J. Nocedal, Math. Comp., 1980, 35, 773 CrossRef.
- C. J. Cerjan and W. H. Miller, J. Chem. Phys., 1981, 75, 2800 CrossRef CAS PubMed.
- J. Simons, P. Jørgensen, H. Taylor and J. Ozment, J. Phys. Chem., 1983, 87, 2745 CrossRef CAS.
- A. Banerjee, N. Adams, J. Simons and R. Shepard, J. Phys. Chem., 1985, 89, 52 CrossRef CAS.
- J. Baker, J. Comput. Chem., 1986, 7, 385 CrossRef CAS.
- S. H. Brooks, Oper. Res., 1957, 6, 244 CrossRef.
- R. Luus and T. H. I. Jaakola, AIChE J., 1973, 19, 760 CrossRef CAS.
- J. H. Holland, Adaptation in Natural and Artificial Systems, University of Michigan Press, Ann Arbor, 1975 Search PubMed.
- D. Goldberg, Genetic Algorithms in Search, Optimization, and Machine Learning, Addison-Wesley, New York, 1989 Search PubMed.
- R. L. Haupt and S. E. Haupt, Practical genetic algorithms, Wiley, New York, 1998 Search PubMed.
- G. Henkelman and H. Jónsson, J. Chem. Phys., 2000, 113, 9978 CrossRef CAS PubMed.
- A. B. Bortz, M. H. Kalos and J. L. Lebowitz, J. Comp. Physiol., 1975, 17, 10 Search PubMed.
- D. T. Gillespie, J. Comput. Phys., 1976, 22, 403 CrossRef CAS.
- B. O. H. Grope, T. Zacherle, M. Nakayama and M. Martin, Solid State Ionics, 2012, 225, 476 CrossRef CAS PubMed.
- D. P. Thompson, A. M. Dickins and J. S. Thorp, J. Mater. Sci., 1992, 27, 2267 CrossRef CAS.
- P. K. Moon and H. L. Tuller, Solid State Ionics, 1988, 28, 470 CrossRef.
- S. Zha, C. Xia and G. Meng, J. Power Sources, 2003, 115, 44 CrossRef CAS.
- N. H. de Leeuw, G. W. Watson and S. C. Parker, J. Phys. Chem., 1995, 99, 17219 CrossRef CAS.
- G. V. Lewis and C. R. A. Catlow, J. Phys. C: Solid State Phys., 1985, 18, 1149 CrossRef CAS.
- M. Kilo, C. Argirusis, G. Borchardt and R. A. Jackson, Phys. Chem. Chem. Phys., 2003, 5, 2219 RSC.
- D. S. D. Gunn, N. L. Allan, H. Foxhall, J. H. Harding, J. A. Purton, W. Smith, M. J. Stein, I. T. Todorov and K. P. Travis, J. Mater. Chem., 2012, 22, 4675 RSC.
- L. Minervini, R. W. Grimes and K. E. Sickafus, J. Am. Ceram. Soc., 1873, 83, 2000 Search PubMed.
- M. Cherry, M. S. Islam and C. R. A. Catlow, J. Solid State Chem., 1995, 118, 125 CrossRef CAS.
- S. Vyas, R. W. Grimes, D. H. Gay and A. L. Rohl, J. Chem. Soc., Faraday Trans., 1998, 94, 427 RSC.
- J. Gale, Z. Kristallogr., 2005, 220, 552 CrossRef CAS.
- H. Ding, A. V. Virkar and F. Liu, Solid State Ionics, 2012, 215, 16 CrossRef CAS PubMed.
- W. Smith, T. R. Forester and I. T. Todorov, The DL_POLY Classic User Manual, Daresbury Laboratory, 2010 Search PubMed.
- C. Pascual and P. Duran, J. Am. Ceram. Soc., 1983, 66, 23 CrossRef CAS PubMed.
- A. N. Petrov, O. F. Kononchuk, A. V. Andreev, V. A. Cherepanov and P. Kofstad, Solid State Ionics, 1995, 80, 189 CrossRef CAS.
- A. I. Ioffe, D. S. Rutman and S. V. Karpachov, Electrochim. Acta, 1978, 23, 141 CrossRef CAS.
- S. P. S. Badwal, Solid State Ionics, 1992, 52, 23 CrossRef CAS.
- R. Devanathan, W. J. Weber, S. C. Singhal and J. D. Gale, Solid State Ionics, 2006, 177, 1251 CrossRef CAS PubMed.
- T. Takahashi, High Conductivity Solid Ionic Conductors, World Scientific, Singapore, 1989 Search PubMed.
- R. A. De Souza and J. A. Kilner, Solid State Ionics, 1998, 106, 175 CrossRef CAS.
- M. Filal, C. Petot, M. Mokchah, C. Chateau and J. L. Carpentier, Solid State Ionics, 1995, 80, 27 CrossRef CAS.
- E. Bucher, W. Sitte, I. Rom, I. Papst, W. Grogger and F. Hofer, Solid State Ionics, 2002, 152, 417 CrossRef.
- Y. Teraoka, T. Nobunaga, K. Okamoto, N. Miura and N. Yamazoe, Solid State Ionics, 1991, 48, 207 CrossRef CAS.
- R. E. W. Casselton, Phys. Status Solidi A, 1970, 2, 571 CrossRef CAS.
- J. Luo, D. P. Almond and R. Stevens, J. Am. Ceram. Soc., 2000, 83, 1703 CrossRef CAS PubMed.
- X. Li and B. Hafskjold, J. Phys.: Condens. Matter, 1995, 7, 1255 CrossRef CAS.
- M. Kilo, R. A. Jackson and G. Borchardt, Philos. Mag., 2003, 11, 3309 CrossRef.
- V. Esposito and E. Traversa, J. Am. Ceram. Soc., 2008, 91, 1037 CrossRef CAS PubMed.
- S. Carter, A. Selcuk, R. J. Chater, J. Kajda, J. A. Kilner and B. C. H. Steele, Solid State Ionics, 1992, 53, 597 CrossRef.
Footnote |
| † Electronic supplementary information (ESI) available. See DOI: 10.1039/c4ta01504e |
| This journal is © The Royal Society of Chemistry 2014 |

