 Open Access Article
Creative Commons Attribution 3.0 Unported Licence
Structural evolution of high energy density V3+/V4+ mixed valent Na3V2O2x(PO4)2F3−2x (x = 0.8) sodium vanadium fluorophosphate using in situ synchrotron X-ray powder diffraction
Paula
Serras
a,
Verónica
Palomares
*a,
Teófilo
Rojo
ab,
Helen E. A.
Brand
c and
Neeraj
Sharma
*d
aDepartamento de Química Inorgánica, Universidad del País Vasco UPV/EHU, P.O. Box 644 48080, Bilbao, Spain. E-mail: veronica.palomares@ehu.es; Fax: +34 946013500; Tel: +34 946015995
bCIC ENERGIGUNE, Parque Tecnológico de Álava, Albert Einstein 48, ED. CIC, 01510, Miñano, Spain. E-mail: trojo@cicenergigune.com; Tel: +34 945297108
cAustralian Synchrotron, 800 Blackburn Road, Clayton, Victoria 3168, Australia. E-mail: Helen.Brand@synchrotron.org.au
dSchool of Chemistry, The University of New South Wales, Sydney NSW 2052, Australia. E-mail: neeraj.sharma@unsw.edu.au; Fax: +61 2 9385 6141; Tel: +61 2 9385 4714
First published on 31st March 2014
Abstract
Sodium-ion batteries have become good candidates for energy storage technology. For this purpose it is crucial to search for and optimize new electrode and electrolyte materials. Sodium vanadium fluorophosphates are considered promising cathodes but further studies are required to elucidate their electrochemical and structural behavior. Therefore, this work focuses on the time-resolved in situ synchrotron X-ray powder diffraction study of Na3V2O2x(PO4)2F3−2x (x = 0.8) while electrochemically cycling. Reaction mechanism evolution, lattice parameters and sodium evolution, and the maximum possible sodium extraction under the applied electrochemical constraints, are some of the features that have been determined for both a fresh and an offline pre-cycled cell. The reaction mechanism evolution undergoes a solid solution reaction with a two-phase region for the first lower-potential plateau while a predominantly solid solution behavior is observed for the second higher-potential plateau. Lattice and volume evolution is clearly dependent on the Na insertion/extraction mechanism, the sodium occupancy and distribution amongst the two crystallographic sites, and the electrochemical cycling history. The comparison between the fresh and the pre-cycled cell shows that there is a Na site preference depending on the cell and history and that Na swaps from one site to the other during cycling. This suggests sodium site occupancy and mobility in the tunnels is interchangeable and fluid, a favorable characteristic for a cathode in a sodium-ion battery.
Introduction
Recently, attention has been refocused on room-temperature sodium-ion batteries as a low-cost alternative technology compared with lithium-ion batteries. The search for commercially viable Na-ion batteries demands the discovery and optimization of new electrode materials and electrolytes, in order to obtain more economic, safer and longer-life batteries. The low cost, high abundance and ease of acquisition of sodium minerals promote interest in sodium-based electrochemical systems, especially for stationary energy storage devices. However, significant challenges such as energy density and long term stability must be addressed.1Framework materials based on the phosphate polyanion have been identified as promising electro-active materials for sodium metal and sodium-ion battery applications. It is the strong inductive effect of the PO43− polyanion that moderates the energetics of the transition metal redox couple to generate relatively high operating potentials for these compounds.2 In this sense, fluorophosphate materials possess even higher operating voltages, because the inductive effect of fluorine is in addition to the effect of the phosphate groups. This high operating potential makes these cathodes particularly favourable to solve the energy density issues of Na-based batteries.
In general, Na3V2O2x(PO4)2F3−2x sodium-vanadium fluorophosphates are good cathodic materials for Na-ion batteries due to their high reaction voltages (at 3.6 and 4.1 V vs. Na/Na+) and their good specific capacity values in sodium half-cells (theoretical specific capacity of about 130 mA h g−1) which leads to high energy density compounds (ca. 500 W h kg−1).3 The particular sample studied in this work possesses a value of x = 0.8 in the general formulae (Na3V2O1.6(PO4)2F1.4) which corresponds to a vanadium oxidation state of 3.8+ for the as-prepared material.4
Currently, only two ex situ detailed structural studies have been undertaken to determine the sodium extraction/insertion mechanism of these materials. The experiments carried out by our research group illustrated that the sodium extraction/insertion mechanism in the equilibrated cathode of the V3.8+ compound is an overall solid solution mechanism and that there is an anisotropic evolution of the lattice parameters during charge, with a (and b) parameter decreasing and c increasing.4 On the other hand, in the work presented by Park et al.5 examination of the ex situ XRD patterns of Na1.5VPO4.8F0.7 (x = 0.8) material revealed the coexistence of a two-phase region in the first half of the charge indicating the presence of a stable intermediate phase between the two plateau. A continuous decrease in lattice parameter a and increase in lattice parameter c was observed with decreasing sodium content, however, the sodium content was determined electrochemically rather than through structural refinements.
As the sodium carries the charge of this material during battery function it is important to know how it behaves crystallographically in order to better understand its evolution and thus try to design materials with, for example bigger crystallographic voids to accommodate more sodium. For this purpose in situ characterization of sodium-ion batteries are paramount.
Time-resolved in situ neutron diffraction (ND) is the more lithium-sensitive technique for the characterization of lithium-ion batteries, since the lithium scattering cross section in X-ray powder diffraction (XRD) data is very small. Using time-resolved in situ ND, researchers have determined current-dependent electrode lattice fluctuations6 as well as the effect of overcharging a lithium-ion battery,7 and more recently the evolution of lithium site occupancy and location as function of charge/discharge.8 Sodium, with a larger atomic number, can potentially be tracked in real-time during a time-resolved in situ synchrotron XRD experiment. The ability to track sodium as a function of charge and discharge provides unparalleled insight into the function of a sodium-ion battery. In this study we illustrate the time-resolved evolution of sodium in an electrode in a sodium-ion battery.
The following features have been determined while electrochemically cycling in real time: (i) the reaction mechanism evolution, (ii) the lattice parameter and volume evolution, (iii) the sodium evolution at the two crystallographic sites in the crystal structure using appropriate constraints, (iv) the rates of lattice and volume expansion/contraction and its relationship (intricately tied) to sodium evolution and behavior, (v) the maximum sodium extraction at the most charged voltage (4.3 V) using a potentiostatic step in the electrochemical cycle and its influence, and (vi) the critical differences between a fresh and a pre-cycled cell.
Experimental section
Na3V2O2x(PO4)2F3−2x (x = 0.8) was synthesized by the hydrothermal method from a ceramic precursor. The synthesis process took place in two steps. First, VPO4/C composite was synthesized by the ceramic method. V2O5 (Sigma-Aldrich, 99.99% purity) and NH4H2PO4 (Fluka, 99.5% purity) were mixed in an agate mortar in a stoichiometric ratio with a 25% molar excess of Ketjenblack. This mixture was annealed twice under nitrogen atmosphere at 300 and 850 °C. Second, the sodium fluorophosphate was prepared under mild hydrothermal conditions (170 °C) and autogenous pressure by reacting 4.5 × 10⁻³ mol of NaF (Sigma-Aldrich, 99% purity) and 1.37 × 10⁻³ mol of VPO4/C composite in 25 mL of water. The reaction mixture was sealed in a polytetrafluoroethylene (PTFE)-lined steel pressure vessel, which was maintained at 170 °C for 65 hours.The positive electrodes were manufactured by mixing 80% wt carbon coated Na3V2O2x(PO4)2F3−2x (x = 0.8) active material, 10% wt conductive carbon (Super C65, Timcal) and 10% wt polyvinylidenefluoride binder (PVDF 5130, Solvay). A few mL N-methylpyrrolidone (NMP, Aldrich) were added and the resulting slurry was stirred for 1 h. The slurry was coated on aluminium foil using the “doctor blade” technique. The electrode film was dried at 80 °C in a vacuum oven for 24 h. The electrode sheets were pressed to 100 kN using a flat plate press (MTI corporation) and dried overnight at 100 °C before transfer to the Ar-filled glovebox. Coin cell casings with 3 mm diameter holes and stainless spacers with 5 mm diameter holes were used for the construction of the coin cells for the in situ measurements. The coin cells contained Na metal (∼1 mm thickness), glass fiber separators with 1 M NaPF6 in dimethyl carbonate and diethyl carbonate (1![[thin space (1/6-em)]](https://www.rsc.org/images/entities/char_2009.gif) :
:![[thin space (1/6-em)]](https://www.rsc.org/images/entities/char_2009.gif) 1 wt%) electrolyte solution. Further details regarding coin cell construction and beamline setup can be found in ref. 9 and 10. In situ synchrotron XRD data were collected on the powder diffraction beamline11 at the Australian Synchrotron with a refined wavelength (λ) of 0.68816(2) Å, determined using the NIST LaB6 660b standard reference material. Two cells were used for the data collection: a fresh cell and a cycled cell (1 cycle offline). The fresh, uncycled, cell (denoted “Fresh”) was held for 4 minutes, charged at a current rate of 0.3 mA and discharged to 2.5 V at −0.3 mA (C/2). The cycled cell (“pre-cycled”) was cycled once offline and stored for 8 days before in situ synchrotron XRD experiments. It was then charged at a current rate of 0.3 mA, held at 4.3 V for 2 hours (potentiostatic step) to extract all possible Na at this voltage and discharged to 2.5 V at −0.3 mA (C/3.5). Data were collected continuously in 4 minute acquisitions.
1 wt%) electrolyte solution. Further details regarding coin cell construction and beamline setup can be found in ref. 9 and 10. In situ synchrotron XRD data were collected on the powder diffraction beamline11 at the Australian Synchrotron with a refined wavelength (λ) of 0.68816(2) Å, determined using the NIST LaB6 660b standard reference material. Two cells were used for the data collection: a fresh cell and a cycled cell (1 cycle offline). The fresh, uncycled, cell (denoted “Fresh”) was held for 4 minutes, charged at a current rate of 0.3 mA and discharged to 2.5 V at −0.3 mA (C/2). The cycled cell (“pre-cycled”) was cycled once offline and stored for 8 days before in situ synchrotron XRD experiments. It was then charged at a current rate of 0.3 mA, held at 4.3 V for 2 hours (potentiostatic step) to extract all possible Na at this voltage and discharged to 2.5 V at −0.3 mA (C/3.5). Data were collected continuously in 4 minute acquisitions.
Rietveld refinements were carried out using the GSAS12 software suite with the EXPGUI13 software interface. Rietveld analysis of the in situ data were undertaken by initially refining the lattice parameters followed by systematically refining atomic positional and isotropic displacement parameters. Constraints were used to minimise the number of refineable variables, e.g. constraining the atomic displacement parameters (ADPs) of all the oxygen sites to be equal. The positional parameters of the two sodium sites Na(1) and Na(2) were refined for the first in situ dataset and fixed, then the occupancies of these sites were refined. Overall, sequential refinements of the whole in situ datasets were performed with a number of permutations, e.g. all ADPs independently refining, all O ADPs constrained to be equal, constrained ADPs for the type of atom. Taking the ADPs as an example, there were minor changes in the statistics of the fits with refinable ADPs in the sequential refinements. This therefore did not justify the inclusion of the extra ADP parameters as it would potentially over-parameterise the model. Our approach for ADPs and sequential refinements were the following, constraining ADPs of F and O to be equal and the refinement of all ADPs for the first dataset in each region, the ADPs were then fixed for the sequential refinements in that region. Additionally in the case of sodium, where the ADPs can correlate with occupancy, for the first datasets in each region, the occupancy and ADP were refined one after the other (refine, fix, refine, fix and so on) until the changes in each were minimal.
In situ experiments in general feature an undulating background in the diffraction data due to the number of materials in the X-ray beam and this background can be complex to model. Our approach for the modelling the background involved initially defining a fixed background followed by allowing 22 background parameters to refine in the GSAS function 1 background, the shifted Chebyschev. This background function captured most of the apparent undulation in the data. Coin cell components of Al (cubic Fm![[3 with combining macron]](https://www.rsc.org/images/entities/char_0033_0304.gif) m, a = 4.05994(8) Å) and Na metal (cubic Im
m, a = 4.05994(8) Å) and Na metal (cubic Im![[3 with combining macron]](https://www.rsc.org/images/entities/char_0033_0304.gif) m, a = 4.3218(8) Å) were excluded from the refinements of the in situ data. The statistics of the Rietveld fits varied between 2.69% < Rwp < 3.16%, 2.05% < Rp < 2.43% and 1.15 < χ2 < 1.30 for the fresh cell and 3.39% < Rwp < 4.00%, 2.57% < Rp < 2.91% and 1.31 < χ2 < 1.37 for the pre-cycled cell.
m, a = 4.3218(8) Å) were excluded from the refinements of the in situ data. The statistics of the Rietveld fits varied between 2.69% < Rwp < 3.16%, 2.05% < Rp < 2.43% and 1.15 < χ2 < 1.30 for the fresh cell and 3.39% < Rwp < 4.00%, 2.57% < Rp < 2.91% and 1.31 < χ2 < 1.37 for the pre-cycled cell.
Results
Fresh cell characterization
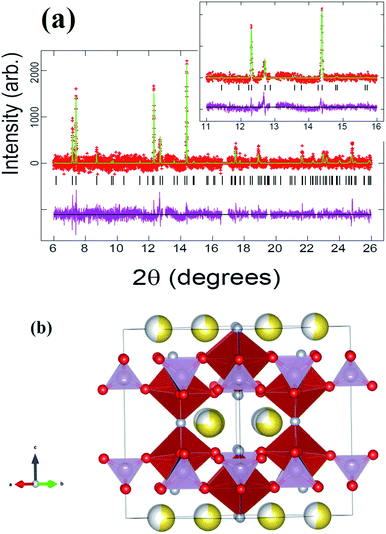
Rietveld refinements of the initial cathode structure were based on the Serras et al. and Le Meins et al.4,14 model using the diffraction pattern of the fresh cell before cycling. The cathodic material adopts the expected tetragonal P42/mnm symmetry with lattice parameters a = 9.07227(24), c = 10.6593(7) Å and has a sodium content of 2.72(11) with a slight preferential occupation of the Na(1) site of 0.74(4) versus 0.62(4) for the Na(2) site. Fig. 1 depicts the Rietveld refined fit to the synchrotron XRD data (a) and the crystal structure (b), while Table 1 displays the crystallographic details.| Atom | x | y | z | Site occupancy factor | Isotropic atomic displacement parameter (×100)/Å2 |
|---|---|---|---|---|---|
| a P42/mnm, a = 9.07227(24) Å, c = 10.6593(7) Å; Na content: 2.72(11). | |||||
| Na(1) | 0.54048 | 0.21364 | 0 | 0.74(4) | 1.59 |
| Na(2) | 0.71293 | 0.00445 | 0 | 0.62(4) | 2.42 |
| V(1) | 0.2326(14) | 0.2326(14) | 0.1963(9) | 1 | 1.6(4) |
| P(1) | 0 | 0.5 | 0.25 | 1 | 1.2(9) |
| P(2) | 0 | 0 | 0.256(8) | 1 | 6.7(9) |
| O(1) | 0.105(5) | 0.397(5) | 0.167(4) | 1 | 2.0(6) |
| O(2) | 0.095(5) | 0.095(5) | 0.150(7) | 1 | 2.0(6) |
| O(3) | 0.409(5) | 0.409(5) | 0.178(7) | 1 | 2.0(6) |
| F(1) | 0.227(4) | 0.227(4) | 0 | 1 | 1.8(9) |
| F(2) | 0.280(3) | 0.280(3) | 0.364(3) | 1 | 1.8(9) |
Although the lattice parameters and atomic positions obtained for the un-cycled fresh cell cathode are very similar to the published structural parameters for the raw material,4 there are two differences that must be mentioned. The first is the change in global sodium content, from 3.04(3) in the raw material [see ref. 4] to 2.72(11) in the prepared cathode material inside a half cell. The second difference for the un-cycled fresh cell cathode material is the slight change in sodium site distribution. In both the raw material and fresh cell cathode there exists a preference for the Na(1) site, but it is less pronounced for the fresh cell cathode. These subtle changes can be caused by the cathode preparation process (material heating, pressing, etc.) or even by some sodium interchange due to the contact with electrolyte in the half cell.
Reaction mechanism evolution of the fresh cell during charge/discharge was observed by time-resolved in situ synchrotron XRD data. The reaction evolution was found to undergo a first solid solution stage until the appearance of a second set of reflections that correspond to a similar structure with slightly smaller a and larger c lattice parameters at a potential of ca. 3.7 V. The appearance of the new reflections featured a concerted disappearance of the original reflections, a two-phase reaction. This two-phase reaction continued until 3.9 V (∼50% of charge) were the second phase becomes dominant and undergoes further removal of sodium via a second solid solution stage until the end of charge. The two-phase region corresponds to a large proportion of the 1st potential plateau-type feature in this electrode, with the second potential plateau-type feature showing predominantly solid solution behavior. On discharge, the solid solution behavior is observed first, followed by the two-phase region and another very small solid solution region. Fig. 2 presents the evolution of (111), (002), (220), (113) and (222) reflections during cycling. The 2D plots show that there are regions of two reflections coexisting (two-phase reaction regions) during the first or lower potential plateau-like feature that merge during solid solution stages.
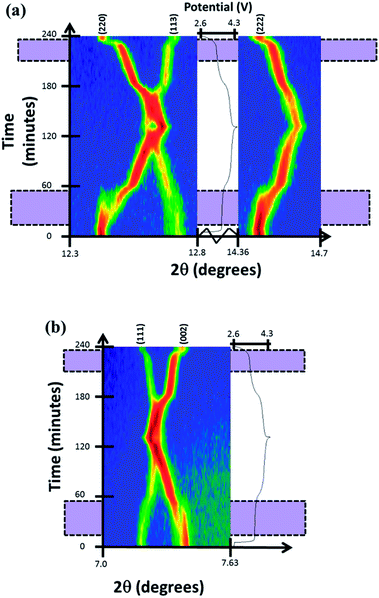 | ||
| Fig. 2 Two-dimensional plots of (a) (220), (113), (222) and (b) (111), (002) reflections versus time and voltage. Purple shaded zones mark two-phase regions where there are two sets of reflections. | ||
More detailed stacked plots of the diffraction patterns focused on the (220) and (222) reflections from 8 to 48 minutes are represented in Fig. 3. It can be seen that both reflections undergo a transfer of intensity from one phase to another, for example the decrease in intensity at 2θ = 12.39° and increase in intensity at the reflection initially located at 12.45° for (220), characteristic of a two-phase reaction. In addition, the reflection belonging to the second phase shows a change in 2θ value, and hence the lattice parameter during the two-phase region. It must be noted that the two phases involved in the two-phase reaction are very similar and it is unlikely that they would be resolved using conventional laboratory-based X-ray diffraction. These results indicate the presence of a two-phase reaction mechanism and the possibility of a simultaneous solid solution and two-phase reaction mechanism region, the latter has been previously demonstrated for LiFePO4 cathodes by in situ neutron diffraction experiments.15
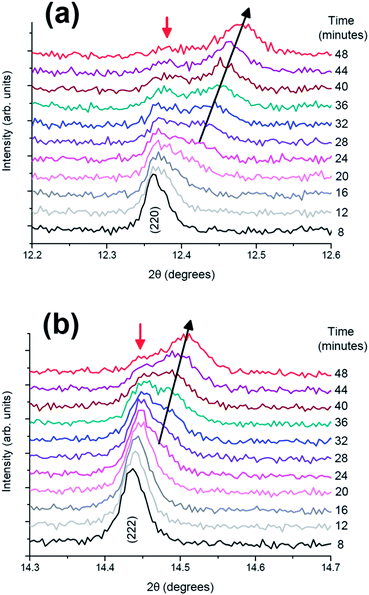 | ||
| Fig. 3 Diffraction patterns from 8 to 48 minutes in the 2θ ranges of (a) (220) and (b) (222) reflections. | ||
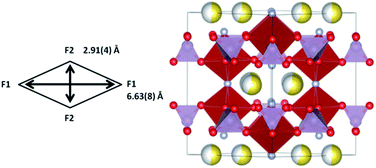
The structure of the phase present at the beginning of the second solid solution, that is, the second phase involved in the two-phase mechanism, named fresh-SS2, can be determined. Lattice parameters and atomic positions obtained from the Rietveld refinements of fresh-SS2 (during in situ data XRD collection) are shown in Table 2. As expected, the a lattice parameter decreases while c increases. The most remarkable change in this structure compared to the initial cathode in the cell is the sodium site ordering, with sodium for this fresh-SS2 cathode state predominantly occupying the Na(2) site, contrary to the Na distribution before cycling.
| Atom | x | y | z | Site occupancy factor | Isotropic atomic displacement parameter (×100)/Å2 |
|---|---|---|---|---|---|
| a P42/mnm, a = 8.9771(4) Å, c = 10.7463(5) Å; Na content: 2.15(12). | |||||
| Na(1) | 0.56383 | 0.14473 | 0 | 0.41(5) | 2.10 |
| Na(2) | 0.73342 | 0.05587 | 0 | 0.667(34) | 1.31 |
| V(1) | 0.243(2) | 0.243(2) | 0.191(1) | 1 | 2.55 |
| P(1) | 0 | 0.5 | 0.25 | 1 | 8.43 |
| P(2) | 0 | 0 | 0.241(6) | 1 | 3.83 |
| O(1) | 0.066(6) | 0.372(6) | 0.168(5) | 1 | 8.03 |
| O(2) | 0.097(8) | 0.097(8) | 0.168(11) | 1 | 8.03 |
| O(3) | 0.393(7) | 0.393(7) | 0.152(9) | 1 | 8.03 |
| F(1) | 0.233(5) | 0.233(5) | 0 | 1 | 0.14 |
| F(2) | 0.306(2) | 0.306(2) | 0.332(4) | 1 | 0.14 |
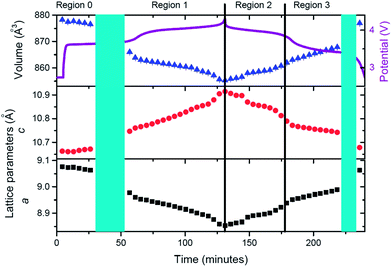
Having qualitatively described the reaction mechanism during charge/discharge, a more detailed description of the lattice and sodium evolution of the fresh cell in solid solution stages is presented. Sequential Rietveld refinements in the solid solution regions allow the tracking of the lattice and sodium evolution during these reactions. Fig. 4 presents the evolution of lattice parameters and unit cell volume of the fresh cell cathode as a function of time.
The cathode structure clearly expands and contracts to accommodate the reversible insertion/extraction of sodium. During charge, contraction in the a and expansion in c lattice parameters with overall volume decrease are registered. The inverse process is observed for discharge but, whereas changes are seemingly linear during charge, there is a significant change of the slope in volume and lattice parameters during discharge, for example before and after 180 minutes in Fig. 4. This feature leads to the region distribution depicted in Fig. 4, F-R0 to F-R3. To gain an understanding of the kinetic evolution of the lattice parameters a and c, and the volume, linear fits were conducted in these regions, and the slope or time constant is shown in Table 3. The rate constants (rate of change) for the c and a lattice parameters are of a similar magnitude and follow the same trend during charge (Region F-R1) and Region F-R2, the magnitude of c is larger than a. Whereas during Region F-R3 the rate constant of c is smaller than that of a. The volume rate constant is larger in each region during discharge relative to charge, suggesting more dramatic structural changes during discharge relative to charge. These results show the non-linearity of the lattice evolution during discharge.
| Region F-R1 (charge) | Region F-R2 (discharge, before 180 minutes) | Region F-R3 (discharge, after 180 minutes) | ||||
|---|---|---|---|---|---|---|
| Slope | R 2 | Slope | R 2 | Slope | R 2 | |
| Volume (Å3 min−1) | −0.115(7) | 0.94 | 0.130(8) | 0.96 | 0.139(1) | 0.99 |
| c (Å min−1) | 0.0021(1) | 0.98 | −0.0024(1) | 0.95 | −0.00081(2) | 0.99 |
| a (Å min−1) | −0.0014(1) | 0.98 | 0.0017(1) | 0.96 | 0.00106(1) | 0.99 |
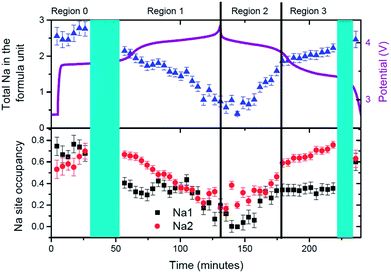
This is one of the first studies where sodium has been tracked in real-time during a time-resolved in situ synchrotron XRD experiment. In order to do this, the positions of the sodium atoms have been refined first, then fixed and then the site occupation is allowed to refine sequentially. The evolution of sodium at the Na(1) and Na(2) sites determined in this way is shown in Fig. 5. This sodium evolution is composed of two factors: how the occupancy changes at these pre-defined sites by either sodium migration or by extraction/insertion during the electrochemical charge/discharge.
In the first solid solution stage (Region F-R0) it can be seen that sodium starts to redistribute between the two possible sodium sites, Na(1) and Na(2), to give essentially equal contents on both. This equal distribution is recovered at the end of discharge, potentially highlighting the good reversible nature of the electrode. In the second solid solution section (Region F-R1) sodium is removed predominantly from the Na(1) site and then removed from the Na(2) site until this former is completely used up. On discharge sodium is inserted into the Na(1) site until it saturates (Region F-R2) and starts to insert into Na(2) site (Region F-R3). This change in sodium insertion mechanism appears close to the point that separates F-R2 and F-R3, where a slope change in unit cell volume and lattice parameters has been indicated above. It is remarkable that sodium distribution at the beginning and the end of the second solid solution section (start of F-R1 and end of F-R3) is essentially the same with sodium predominantly located on the Na(2) site (0.75) and a smaller sodium amount on the Na(1) site (0.35). This demonstrates a symmetry in the charge and discharge processes, in terms of both reaction mechanisms and sodium distribution and evolution at selected points. The end of discharge leads to an almost equal occupation of both sodium sites of about 0.6.
The most striking feature in sodium evolution for the fresh cell is the apparent lag in the sodium content relative to charge/discharge. The total sodium content (Fig. 5) reaches its minimum value on average around 0.68(14) at 118 minutes and remains virtually within error of this value until 153 minutes. Taking into account that the battery reaches a potential of 4.3 V at 131 minutes, this behavior suggests there is some delay in the sodium transfer that we can observe with our models of the crystalline phases. Indeed, this may account for the change of slope of the lattice parameters during discharge, specifically in the first 20 minutes of discharge, compared to the first charge of the fresh cell. On the other hand, our model assumes fixed sodium positions, so subtle changes in sodium position could account for the observed delay. With this in mind constrained refinements were performed to gauge the influence of sodium position and occupancy on its evolution. Unfortunately, the parameters seem to correlate quite extensively and meaningful interpretation was difficult to obtain, and minimal changes were obtained to the statistics of the fits with the inclusion of the sodium positional parameters.
The fresh cell was kept after discharge under ambient conditions for 1 day to observe if there were any changes to the material associated with storage after use. Table 4 displays the crystallographic data of the final structure at the end of the in situ measurement and the same cathode kept in the coin cell and re-collected after 1 day storage.
| Atom | x | y | z | Site occupancy factor | Isotropic atomic displacement parameter (×100)/Å2 |
|---|---|---|---|---|---|
| a P42/mnm, a = 9.06242(28) Å, c = 10.6781(6) Å; Na content: 2.46(23). b P42/mnm, a = 9.07261(17) Å, c = 10.6643(5) Å; Na content: 2.54(14). | |||||
| Na(1) | 0.50886 | 0.22812 | 0 | 0.60(8) | 5.00 |
| 0.65(5) | |||||
| Na(2) | 0.72501 | 0.03541 | 0 | 0.63(8) | 5.00 |
| 0.62(5) | |||||
| V(1) | 0.250(5) | 0.250(5) | 0.1986(2) | 1 | 1.66 |
| 0.2493(3) | 0.2493(3) | 0.1985(9) | |||
| P(1) | 0 | 0.5 | 0.25 | 1 | 0.11 |
| P(2) | 0 | 0 | 0.267(10) | 1 | 1.09 |
| 0.277(6) | |||||
| O(1) | 0.094(11) | 0.390(11) | 0.164(9) | 1 | 2.36 |
| 0.096(7) | 0.400(7) | 0.157(5) | |||
| O(2) | 0.10(1) | 0.10(1) | 0.16(2) | 1 | 2.36 |
| 0.088(7) | 0.088(7) | 0.180(9) | |||
| O(3) | 0.39(1) | 0.39(1) | 0.18(1) | 1 | 2.36 |
| 0.402(8) | 0.402(8) | 0.150(9) | |||
| F(1) | 0.245(14) | 0.245(14) | 0 | 1 | 2.98 |
| 0.248(9) | 0.248(9) | ||||
| F(2) | 0.291(4) | 0.291(4) | 0.357(4) | 1 | 2.98 |
| 0.282(3) | 0.282(3) | 0.350(3) | |||
Firstly, the total sodium content of the totally discharged cathode, 2.46(23), is lower than expected. This could be due to the fact that some of the sodium can be located on the surface layers of the material that are unobservable with X-ray diffraction. Comparing the discharged structure and the stored structure, the total sodium content slightly increases with storage, with the concurrent increase in a and decrease in c lattice parameters. This increase can be due to some interchange with the electrolyte in the coin cell during storage. The atomic parameters evolve leading to an increase in the size of channels in xy plane (Fig. 6). Moreover, sodium site occupancy varies, tending to a more equal distribution of sodium between both Na sites. This evidence indicates that there exists some relaxation processes occurring in these cathode materials after removing the electrochemically applied current. This highlights the importance of in situ studies as a complement to ex situ studies, since ex situ characterization can get close to what is actually taking place in the material (thermodynamically stabilized phases), but only time-resolved in situ measurements can provide instantaneous snapshots of the reaction mechanism and structural evolution (kinetically evolving phases).
 | ||
| Fig. 6 Channel size in the xy plane for the discharged fresh cell cathode and the same material stored in the coin cell for 1 day. | ||
Pre-cycled cell characterization
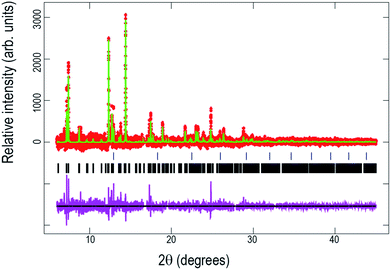
Fig. 7 shows the Rietveld refined fit of the initial structural model to the synchrotron XRD pattern of the pre-cycled cell after one cycle offline and 8 days storage at the beginning of the in situ synchrotron XRD experiment. Table 5 presents the obtained crystallographic data for this structure.| Atom | x | y | z | Site occupancy factor | Isotropic atomic displacement parameter (×100)/Å2 |
|---|---|---|---|---|---|
| a P42/mnm, a = 9.06730(16) Å, c = 10.6530(5) Å; Na content: 2.60(12). | |||||
| Na(1) | 0.5562 | 0.20262 | 0 | 0.50(5) | 1.6(2) |
| Na(2) | 0.72933 | 0.01458 | 0 | 0.80(4) | 2.4(1) |
| V(1) | 0.242(2) | 0.242(2) | 0.1979(7) | 1 | 2.7(4) |
| P(1) | 0 | 0.5 | 0.25 | 1 | 3.6(1) |
| P(2) | 0 | 0 | 0.232(4) | 1 | 3.8(1) |
| O(1) | 0.124(3) | 0.399(3) | 0.162(2) | 1 | 0.10(5) |
| O(2) | 0.088(3) | 0.088(3) | 0.139(4) | 1 | 0.10(5) |
| O(3) | 0.436(3) | 0.436(3) | 0.176(4) | 1 | 0.10(5) |
| F(1) | 0.222(3) | 0.222(3) | 0 | 1 | 0.50(7) |
| F(2) | 0.281(2) | 0.281(2) | 0.362(2) | 1 | 0.50(7) |
Structural analysis of the pre-cycled cell at the beginning of the in situ experiment shows a sodium distribution different to the previously observed for the raw material [see ref. 4] and the cycled fresh cell both of which show preferential Na(1) site occupation, while the pre-cycled cell shows sodium preferentially located on the Na(2) site. This rearrangement of sodium may be due to extended storage or the potentiostatic step applied in the first offline cycle. The total sodium content, 2.60(12), also illustrates a decrease with respect to the raw material, 3.04(3), probably due to cathode preparation process (material heating, pressing, etc.) or by some sodium interchange due to the contact with electrolyte in the half cell.
Reaction mechanism evolution of the pre-cycled cell during charge/potentiostatic step/discharge is similar to the evolution of the fresh cell. Charge begins with a solid solution mechanism until the appearance of a second set of reflections corresponding to a similar structure with slightly smaller a and larger c lattice parameters at a potential of ∼3.7 V. This two-phase mechanism continues during the first plateau-like feature until 3.9 V where the second phase becomes dominant and undergoes further sodium removal via a second solid solution reaction until the end of charge, corresponding mainly to the second plateau-like feature. On discharge the inverse mechanism is observed with a little delay in the start of the two-phase region, that appears at 3.5 V. Fig. 8 shows the evolution of (220), (113) and (222) reflections. Two-phase regions where the two reflections coexist are indicated.
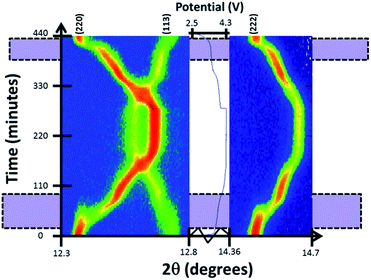 | ||
| Fig. 8 Two-dimensional plots of (220), (113) and (222) reflections versus time and voltage. Purple shaded areas mark two-phase regions where there are two sets of reflections. | ||
Individual diffraction patterns in Fig. 9 show in more detail that in the two-phase region, as shown in the fresh cell (Fig. 3), the (220) reflection undergoes a transfer of intensity from one phase to another, similar to the fresh cell, and this latter reflection experiences a change in the 2θ value and hence a change in the lattice parameters during the two-phase region.
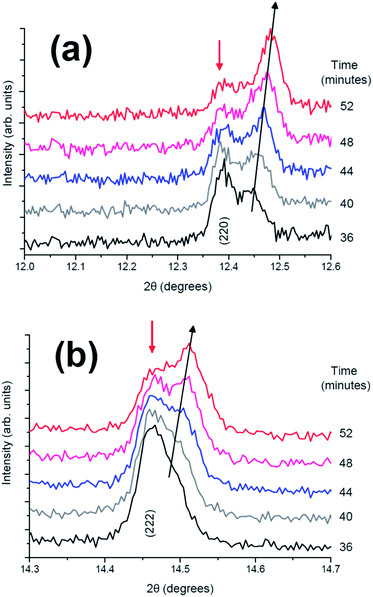 | ||
| Fig. 9 Diffraction patterns from 36 to 52 minutes in the 2θ ranges of (a) (220) and (b) (222) reflection. | ||
A closer look at the structures of the phase at the end of the initial solid solution region and the start of the second solid solution region (3.91 V or 72 minutes) can provide more information about the two-phase region in the charge mechanism. Tables 6 and 7 display crystallographic parameters for these phases, the end of the first solid solution (named pre-SS1) and the start of the second solid solution region (named pre-SS2).
| Atom | x | y | z | Site occupancy factor | Isotropic atomic displacement parameter (×100)/Å2 |
|---|---|---|---|---|---|
| a P42/mnm, a = 9.06024(20) Å, c = 10.6594(7) Å; Na content: 2.62(16). | |||||
| Na(1) | 0.5562 | 0.20262 | 0 | 0.57(6) | 2.13 |
| Na(2) | 0.72933 | 0.01458 | 0 | 0.74(5) | 1.31 |
| V(1) | 0.24(2) | 0.24(2) | 0.1960(8) | 1 | 2.7(4) |
| P(1) | 0 | 0.5 | 0.25 | 1 | 4.7(1) |
| P(2) | 0 | 0 | 0.235(5) | 1 | 3.1(1) |
| O(1) | 0.123(3) | 0.394(3) | 0.161(2) | 1 | 0.6(5) |
| O(2) | 0.085(3) | 0.085(3) | 0.141(5) | 1 | 0.6(5) |
| O(3) | 0.435(3) | 0.435(3) | 0.175(5) | 1 | 0.6(5) |
| F(1) | 0.220(3) | 0.220(3) | 0 | 1 | 1.9(8) |
| F(2) | 0.281(3) | 0.281(3) | 0.364(3) | 1 | 1.9(8) |
| Atom | x | y | z | Site occupancy factor | Isotropic atomic displacement parameter (×100)/Å2 |
|---|---|---|---|---|---|
| a P42/mnm, a = 8.96128(26) Å, c = 10.7354(4) Å; Na content: 2.09(9). | |||||
| Na(1) | 0.5562 | 0.20262 | 0 | 0.683(33) | 2.12 |
| Na(2) | 0.72933 | 0.01458 | 0 | 0.364(31) | 1.31 |
| V(1) | 0.246(1) | 0.246(1) | 0.1913(7) | 1 | 3.3(4) |
| P(1) | 0 | 0.5 | 0.25 | 1 | 3.3(1) |
| P(2) | 0 | 0 | 0.247(7) | 1 | 7.1(2) |
| O(1) | 0.121(4) | 0.424(4) | 0.162(4) | 1 | 3.2(6) |
| O(2) | 0.101(5) | 0.101(5) | 0.178(6) | 1 | 3.2(6) |
| O(3) | 0.417(4) | 0.417(4) | 0.140(5) | 1 | 3.2(6) |
| F(1) | 0.276(3) | 0.276(3) | 0 | 1 | 0.8(7) |
| F(2) | 0.288(2) | 0.288(2) | 0.358(2) | 1 | 0.8(7) |
Comparison of pre-SS1 and pre-SS2 structures reveals significant changes, but the overall symmetry is preserved. First, the lattice parameters change by 0.0790(3) and 0.0769(1) Å in a and c respectively, what leads to a ca. 1% change in lattice. Second, the sodium content decreases from 2.62 to 2.09, and the sodium site preference is switched between the first and second solid solution regimes. The first solid solution region shows dominant Na concentration on the Na(2) site and prevalent Na(1) occupation is found in the second solid solution region. This information indicates that the two-phase region is composed of a sodium-rich and a sodium-poor phase with approximate sodium ratios of 2.6 and 2.1, and that these compositions feature different distributions of sodium on the Na(1) and Na(2) sites. This phenomenon is observed in some Li-ion battery cathodes such as LiCoO2 which shows regions of two-phase behavior with Li-rich and Li-poor variants, but both of which adopt the same crystal structure.16,17
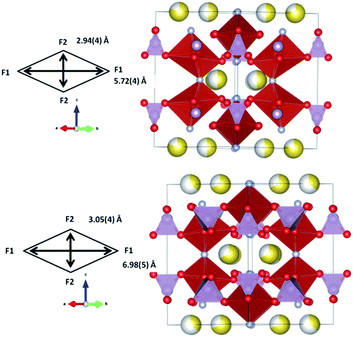
The observation of the structures of pre-SS1 and pre-SS2 helps to understand why the transformation to the second solid solution occurs via a two-phase mechanism (Fig. 10). As it can be seen, the pre-SS1 structure is highly distorted and presents relatively small channels in the xy plane for the sodium ions, whilst pre-SS2 features channels that are more than 1 Å greater in both dimensions in the xy plane. Thus, to attain the structure that accommodates more facile Na-ion extraction requires the coexistence of these two phases, thus SS2 develops at the expense of pre-SS1. The larger channels in SS2 are likely to be more favorable for the facilitation of the solid solution reaction mechanism relative to pre-SS1.
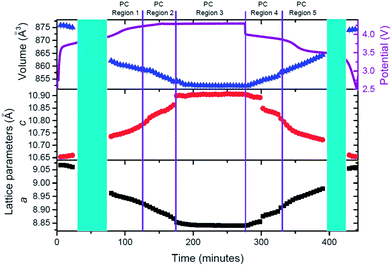
In order to analyze lattice evolution during the solid solution stages, different regions have been defined in the electrochemical reaction. Fig. 11 shows these regions with the evolution of lattice parameters and unit-cell volume of the cathode as a function of time.
Similar to the fresh cell, the structure of the cathode expands and contracts to accommodate the reversible extraction/insertion of sodium. However, these variations are not linear throughout the charge or discharge process, showing subtle changes in the rate of expansion and contraction, for example, the changes of the slope in c parameter at 132 and 346 minutes in Fig. 11. Linear fits have been conducted in the different regions to gain an understanding of the kinetic evolution of the lattice (Table 8).
| Volume (Å3 min−1) | c (Å min−1) | a (Å min−1) | ||
|---|---|---|---|---|
| Region PC-R1 (charge) | Slope | −0.069(4) | 0.00095(1) | −0.00076(2) |
| R 2 | 0.97 | 0.97 | 0.99 | |
| Region PC-R2 (charge & potentiostatic) | Slope | −0.107(6) | 0.0016(1) | −0.00121(5) |
| R 2 | 0.97 | 0.99 | 0.99 | |
| Region PC-R3 (potentiostatic) | Slope | −0.004(1) | 0.00006(1) | −0.00008(1) |
| R 2 | 0.57 | 0.63 | 0.60 | |
| Region PC-R4 (discharge) | Slope | 0.090(4) | −0.0020(1) | 0.00126(7) |
| R 2 | 0.97 | 0.93 | 0.96 | |
| Region PC-R5 (discharge) | Slope | 0.111(1) | −0.0013(1) | 0.00111(4) |
| R 2 | 0.99 | 0.90 | 0.99 | |
Comparison of the slopes (rate constants) in the different regions reveals that large changes are experienced between Region PC-R1 and PC-R2, which suggests that the final sodium extraction processes, that is, extracting more than 1.78(8) sodium from the structure, leads to a more dramatic change in the lattice and volume of the cathode. Additionally, the volume contraction and lattice parameter fluctuations registered in Region PC-R2 continue until approximately 25 minutes into Region PC-R3, the potentiostatic step. The lattice and volume stabilizes with minimal fluctuation for the remainder of the potentiostatic region. This potentiostatic step was designed to ensure the structure had reached equilibrium at 4.3 V which is demonstrated by the decay in current; and also to ensure that the maximum possible amount of sodium was extracted at 4.3 V. Structural data extracted from the Rietveld analysis of the ‘equilibrium structure' at 4.3 V during the potentiostatic step are displayed in Table 9 and the structure is plotted in Fig. 12.
| Atom | x | y | z | Site occupancy factor | Isotropic atomic displacement parameter (×100)/Å2 |
|---|---|---|---|---|---|
| a P42/mnm, a = 8.84081(18) Å, c = 10.9043(6) Å; Na content: 0.77(4). | |||||
| Na(1) | 0.5562 | 0.20262 | 0 | 0 | 2.12 |
| Na(2) | 0.72933 | 0.01458 | 0 | 0.377(21) | 1.31 |
| V(1) | 0.246(1) | 0.246(1) | 0.1913(7) | 1 | 3.9(4) |
| P(1) | 0 | 0.5 | 0.25 | 1 | 5.5(1) |
| P(2) | 0 | 0 | 0.275(4) | 1 | 2.3(2) |
| O(1) | 0.120(5) | 0.416(4) | 0.168(3) | 1 | 1.4(6) |
| O(2) | 0.101(5) | 0.101(5) | 0.161(5) | 1 | 1.4(6) |
| O(3) | 0.402(4) | 0.402(4) | 0.127(4) | 1 | 1.4(6) |
| F(1) | 0.262(6) | 0.262(6) | 0 | 1 | 5.0(8) |
| F(2) | 0.268(4) | 0.268(4) | 0.346(2) | 1 | 5.0(8) |
It can be seen that sodium occupancy equates out to zero on the Na(1) site and averages to 0.38(2) on the Na(2) site, leading to a composition of Na0.77(4)V2O2x(PO4)2F3−2x. Indicative changes can be observed by comparing the bond distances of pre-SS2 phase and the phase during potentiostatic step. Table 10 displays the bond distances inside the vanadium coordination polyhedron for these two phases. Shortening of all V-anion bond lengths is a clear indication of an increase of the vanadium oxidation state.
| Bond | Bond distance in pre-SS2 (Å) | Bond distance in the potentiostatic step (Å) |
|---|---|---|
| V–O1 | 1.97(4) | 1.88(4) |
| V–O2 | 1.84(6) | 1.81(6) |
| V–O3 | 2.24(5) | 2.05(5) |
| V–F1 | 2.088(11) | 1.996(12) |
| V–F2 | 1.865(26) | 1.813(25) |
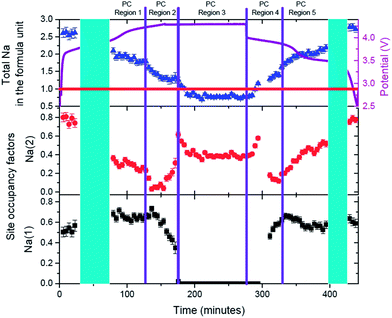
Evolution of sodium in the pre-cycled cell at the Na(1) and Na(2) sites is shown in Fig. 13. The initial state of the pre-cylced electrode effectively retains the same sodium occupation and distribution after charge/potentiostatic hold/discharge processes, highlighting the reversibility at the atomic scale of this cathode material. Unlike ex situ synchrotron XRD analysis on the pure powders [see ref. 4], the sodium distribution over the Na(1) and Na(2) sites is reversed at both the initial state and final discharged state, with Na(2) showing higher occupancy than Na(1). It should be noted that the electrode in this coin cell has been cycled once and this distribution maybe a result of the first cycle and subsequent storage. A comparison of the initial states, for both the fresh and pre-cycled cell, indicates that before cycling the fresh electrode shows sodium preferentially located on the Na(1) site, while one charge/discharge cycle results in a more homogeneous sodium distribution. However, a distinct preference for the Na(2) site is observed in the pre-cycled cell. Thus, sodium redistribution is likely to occur following the first cycle of this cathode material. Further long term in situ studies are required to confirm this observation.
The same regions used for lattice parameters rate analysis are used to study sodium evolution during charge/potentiostatic hold/discharge. Region PC-R1 shows the continuous extraction of sodium from Na(2) site and virtually no change in the sodium occupancy of the Na(1) site. This results, as shown in Fig. 11, in a linear change in the lattice as expected by Vegard's law for solid solution type behavior with ion insertion/extraction from one crystallographic site. At the onset of Region PC-R2 (135 minutes), corresponding to a more dramatic or an increase in the rate of change in the lattice parameters, the sodium extraction mechanism changes and most of the removal of sodium occurs from the Na(1) site. However, an increase in the Na(2) site occupancy indicates that some of the sodium that comes out of the Na(1) site is either placed on the Na(2) site or is removed from the structure via this site. This process effectively continues until Na(1) is empty and Na(2) contains all the sodium (≈175 minutes), corresponding to the beginning of Region PC-R3. During the potentiostatic step, sodium is subsequently removed from the Na(2) until an equilibrium sodium concentration is established with no further sodium extraction at 4.3 V (≈225 minutes). In Region PC-R4 sodium starts inserting on to the Na(2) site until it achieves a maximum occupation and then starts to reduce occupancy by concurrently moving or inserting onto the Na(1) site. The maximum occupation of 0.66(3) of Na(1) at the end of Region PC-R4 is very similar to the Na(1) concentration in Region PC-R1 during charge. Unlike charge where the Na(1) site maintains on average the 0.65(3) composition during Region PC-R1, the Na(1) site occupancy drops slightly at the onset of Region PC-R5 and seems to equilibrate on average at 0.56(3) (≈335 minutes), lower than Region PC-R1. During Region PC-R5, sodium insertion occurs mostly on the Na(2) site which gradually increases in content while Na(1) is effectively constant. Thus, during discharge, the Na(1) site reaches a maximum value, so sodium insertion needs to occur on the Na(2) site and at a certain point in discharge both sites cannot handle any more sodium, so a two-phase process is initiated (≈395 minutes).
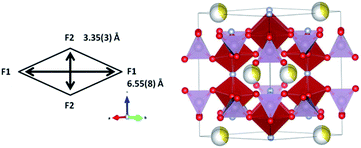
The crystal structure of the cathode at the end of PC-R5 (∼400 min) is detailed in Table 11 and illustrated in Fig. 14. The channel dimension becomes too small along the c axis which instigates the subsequent two-phase region.
| Atom | x | y | z | Site occupancy factor | Isotropic atomic displacement parameter (×100)/Å2 |
|---|---|---|---|---|---|
| a P42/mnm, a = 8.97847(27) Å, c = 10.7221(4) Å; Na content: 2.19(9). | |||||
| Na(1) | 0.5562 | 0.20262 | 0 | 0.58(4) | 2.12 |
| Na(2) | 0.72933 | 0.01458 | 0 | 0.516(33) | 1.31 |
| V(1) | 0.2473(16) | 0.2473(16) | 0.1969(7) | 1 | 3.90 |
| P(1) | 0 | 0.5 | 0.25 | 1 | 1.74 |
| P(2) | 0 | 0 | 0.238(8) | 1 | 9.76 |
| O(1) | 0.124(3) | 0.428(3) | 0.165(3) | 1 | 1.40 |
| O(2) | 0.104(4) | 0.104(4) | 0.168(5) | 1 | 1.40 |
| O(3) | 0.418(3) | 0.418(3) | 0.153(5) | 1 | 1.40 |
| F(1) | 0.261(6) | 0.261(6) | 0 | 1 | 5.45 |
| F(2) | 0.283(2) | 0.283(2) | 0.365(2) | 1 | 5.45 |
Discussion
This work analyzes the structural changes and electrochemical sodium extraction/insertion mechanisms of the Na3V2O2x(PO4)2F3−2x cathode in a coin cell versus metallic sodium by in situ synchrotron XRD under different conditions. A fresh and a pre-cycled cell have been studied by using galvanostatic cycling and galvanostatic/potentiostatic/galvanostatic mode, respectively in order to study the response of the material before and after cycling and the influence of a potentiostatic step in the cathode behavior.Both fresh and pre-cycled cells show the same scheme of reaction mechanism in general terms. They show an initial short solid solution regime followed by a biphasic region and a second solid solution domain that continues until the completion of charge and this solid solution accounts for the majority of the initial discharge. The final part of the low voltage plateau-like feature during discharge consists of a biphasic region followed by a final solid solution section. However, analysis of the lattice parameters and sodium occupancy evolution during electrochemical reactions demonstrates that there exist differences between the first and the following cycles of Na3V2O2x(PO4)2F3−2x based cathodes and that the use of a potentiostatic step has an influence on subsequent discharge.
The rate of change of lattice parameters of the cathode in the fresh and pre-cycled cells during the charge process can only be qualitatively compared because Region F-R1 of the fresh cell corresponds to Region PC-R1 and half of Region PC-R2 of pre-cycled cell. Generally, the fresh cell cathode presents a faster rate of change than the pre-cycled cell cathode during charge, that is, the fresh cell cathode contracts faster than the pre-cycled cathode. This could be a result of the different sodium distribution in the fresh and pre-cycled cathodes that in turn influence the lattice and volume evolution. The fresh cell cathode shows Na(2) site preference for the majority of charge (fresh-SS2 phase) whereas the pre-cycled cell cathode shows Na(1) site preference (pre-SS2 phase).
Lattice evolution during discharge process can be compared more directly as both cells feature two distinct rates of change, Regions F-R2 and F-R3 in the fresh cell and Regions PC-R4 and PC-R5 in the pre-cycled cell. The higher voltage plateau-like feature corresponds to Region F-R2 and Region PC-R4 in fresh and pre-cycled cell respectively. In this region, the fresh cell presents higher rates of change compared to the pre-cycled one, 1.2(1), 1.3(1) and 1.4(1) times higher for c, a, and volume respectively. This suggests that the potentiostatic step in the pre-cycled cell may act to stabilize the charged crystal structure such that during initial discharge a slower rate of change in lattice parameters and volume is observed. In terms of sodium evolution, the pre-cycled cell presents predominant occupation of sodium on the Na(2) site at the end of potentiostatic step prior to the beginning of discharge and during initial discharge (Region PC-R4) sodium is inserted to the Na(2) site. Following this, sodium is inserted on the Na(1) site in addition to a concerted redistribution to the Na(1) site from the Na(2) site, influencing the slower rate of change of the lattice parameters. Comparatively, in the fresh cell (Region F-R2) sodium is inserted on both sites relatively evenly and thus may show a faster rate of expansion/contraction in lattice parameters and volume compared to the more complex behavior observed in the pre-cycled cell.
The lower voltage plateau-like feature corresponds to Region F-R3 and Region PC-R5 in the fresh and pre-cycled cells respectively. In this region, the pre-cycled cell features higher changes in the rates of change in the lattice compared to the fresh cell. This can be thought of as the pre-cycled cell catching up to the fresh cell in terms of the structural changes. Considering the sodium evolution, sodium insertion in both cells occurs predominantly on the Na(2) site but the fresh cell shows a lower overall occupancy of Na(1) site and higher occupancy of Na(2), while in the pre-cycled cell the Na(1) site occupancy has a higher overall occupancy than the Na(2) site. These tendencies show that the rate of lattice and volume evolution is clearly dependent on the sodium insertion/extraction mechanism, the occupancy and distribution of sodium, and the electrochemical cycling history.
The minimum sodium content registered for the fresh and pre-cycled cathodes is 0.68(14) and 0.77(4) on average respectively. These values are very close, so the influence of the potentiostatic step is not significant in this case, in relation to the obtained specific capacity. Comparing sodium evolution of both cells, the fresh cell shows Na(2) site preference in almost all the electrochemical reaction whereas pre-cycled cell presents predominant Na(1) occupation in the majority of the electrochemical process. The fresh cell also presents a more symmetric sodium occupancy evolution than the pre-cycled one (that includes a potentiostatic step). However, the cathode in both of the cells show predominant Na(2) occupation for the completely charged state and feature distinctly different sodium preferential occupation during discharge. This may indicate that the use of a potentiostatic step can be a way to tune site occupancy in these materials during discharge. Nevertheless, it must be taken into account that the first cycle usually features different behavior for a large number of electrode materials. In any case, the possibility of discharging a material with similar sodium occupancy via preferentially either the Na(1) or Na(2) sites suggests that sodium site occupancy and mobility in the tunnels is interchangeable and fluid.
Fig. 15 shows the site-specific occupancies and total sodium content for both fresh and pre-cycled cell vs. specific capacity allowing direct comparison of the electrochemical capacity and the sodium atomic parameters. The behaviour between Na(1) and Na(2) site-occupancy is clearly different in the fresh and precycled cell. The fresh cell exhibits a lower overall occupancy of the Na(1) site and higher occupancy of Na(2) sites throughout the electrochemical process. The opposite behaviour is shown for the pre-cycled cell. Notably, the total sodium content in both cells follow effectively the same trend, but the individual site-occupancies and evolution are very distinct in each. This highlights the electrochemical reproducibility in terms of sodium content in the overall cathode, even though individual crystallographic sodium sites differ significantly.
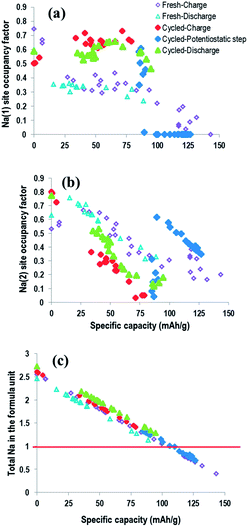 | ||
| Fig. 15 Sodium occupancies (a and b) and total content (c) vs. specific capacity for the fresh and pre-cycled cell. | ||
The promise for this cathode material is the fact that the structure seems to be entirely reversible, even at the sodium distribution scale, and the majority of the charge/discharge process is a solid solution reaction. The total volume change between the two phases at the end of the first solid solution and the beginning of the second solid solution is ∼1.5%.
Conclusions
This work analyzes the structural changes and electrochemical sodium extraction/insertion mechanisms in the Na3V2O2x(PO4)2F3−2xx = 0.8 cathode material in a coin cell versus metallic sodium by time-resolved in situ synchrotron X-ray diffraction under different conditions. A fresh and a pre-cycled cell have been studied by using galvanostatic cycling and galvanostatic/potentiostatic/galvanostatic cycling, respectively in order to study the response of the material before and after cycling and the influence of a potentiostatic step in the cathode behavior.Both cells show similar reaction mechanisms, of an initial short solid solution regime followed by a biphasic region and a second solid solution domain that continues until the completion of charge and accounts for a significant fraction of the discharge. The final part of discharge corresponding to the low voltage plateau-like feature consists of a biphasic region followed by a final solid solution section. This work provides for the evidence for two-phase reaction regimes for the Na3V2O2x(PO4)2F3−2x cathode during electrochemical cycling, in contrast with the full solid solution behavior observed by ex situ X-ray diffraction.
This work shows unprecedented insight into the sodium site and occupancy evolution during the solid solution regimes over the course of charge/discharge. The sodium insertion/extraction mechanism, sodium occupancy and distribution in the structure, and the electrochemical cycling history clearly influence lattice and volume contraction/expansion. These findings are notable, as they directly show which sodium sites are ‘active’ and when during charge and discharge. From this information we can further understand the function of this cathode in these batteries.
Sodium occupancy evolution during charge/discharge in a fresh cell is more symmetric than in the pre-cycled cell with a potentiostatic step. Additionally, evidence that the use of a potentiostatic step can be a way to tune site occupancy in this material during discharge has also been illustrated. Finally, as this material is able to discharge via either Na(1) or Na(2) site preference, the sodium site occupancy and mobility in the tunnels appears to be interchangeable and fluid.
Thus, this work provides an in-depth analysis of the reaction mechanisms taking place during the electrochemical reaction by using time-resolved in situ synchrotron X-ray diffraction, and shows that this material is a good choice as a cathode for Na-ion batteries because its structure seems to be flexible, entirely reversible and the majority of the charge/discharge process is a solid solution reaction.
The simultaneous time-resolved assessment of crystal structure and electrochemistry illustrates how these aspects are intricately linked. This type of in situ experiment demonstrates the relationship between batteries stored/used under different conditions and provides direction on what structural motifs or aspects are desired for optimal performance. Such information can be used by researchers to tailor materials for desired battery performance.
Notes and references
- H. Pan, Y.-S. Hu and L. Chen, Energy Environ. Sci., 2013, 6, 2338 CAS.
- A. Yamada, S. C. Chung and K. Hinokuma, J. Electrochem. Soc., 2001, 148, A224 CrossRef CAS PubMed.
- P. Serras, V. Palomares, A. Goñi, I. Gil de Muro, P. Kubiak, L. Lezama and T. Rojo, J. Mater. Chem., 2012, 22, 22301 RSC.
- P. Serras, V. Palomares, J. Alonso, N. Sharma, J. M. López del Amo, P. Kubiak, M. L. Fdez-Gubieda and T. Rojo, Chem. Mater., 2013, 25, 4917 CrossRef CAS.
- Y.-U. Park, D. H. Seo, H.-S. Kwon, B. Kim, J. Kim, H. Kim, I. Kim, H.-I. Yoo and K. Kang, J. Am. Chem. Soc., 2013, 135(37), 13870 CrossRef CAS PubMed.
- N. Sharma and V. K. Peterson, Electrochim. Acta, 2013, 101, 79 CrossRef CAS PubMed.
- N. Sharma and V. K. Peterson, J. Power Sources, 2013, 244, 695 CrossRef CAS PubMed.
- N. Sharma, D. Yu, Y. Zhu, Y. Wu and V. K. Peterson, Chem. Mater., 2013, 25, 754 CrossRef CAS.
- R. J. Gummow, N. Sharma, R. Feng, G. Han and Y. He, J. Electrochem. Soc., 2013, 160, A1556 CrossRef PubMed.
- W. Brant, S. Schmid, Q. Gu, G. Du and N. Sharma, J. Power Sources, 2013, 244, 109 CrossRef CAS PubMed.
- K. S. Wallwork, B. J. Kennedy and D. Wang, AIP Conf. Proc., 2007, 879 CrossRef CAS PubMed.
- A. C. Larson and R. B. Von Dreele, Los Alamos National Laboratory Report LAUR, 1994, pp. 86–748 Search PubMed.
- B. H. Toby, J. Appl. Crystallogr., 2001, 34, 210 CrossRef CAS.
- J.-M. Le Meins, M.-P. Crosnier-Lopez, A. Hemon-Ribaud and G. Courbion, J. Solid State Chem., 1999, 148, 260 CrossRef CAS.
- N. Sharma, G. Du, Z. Guo, J. Wang, Z. Wang and V. K. Peterson, J. Am. Chem. Soc., 2012, 134, 7867 CrossRef CAS PubMed.
- N. Sharma, V. K. Peterson, M. M. Elcombe, M. Avdeev, A. J. Studer, N. Blagojevic, R. Yusoff and N. Kamarulzaman, J. Power Sources, 2010, 195, 8258 CrossRef CAS PubMed.
- Y. Takahashi, N. Kijima, K. Tokiwa, T. Watanabe and J. Akimoto, J. Phys.: Condens. Matter, 2007, 19, 436202 CrossRef.
| This journal is © The Royal Society of Chemistry 2014 |

