 Open Access Article
Creative Commons Attribution 3.0 Unported Licence
High power nano-structured V2O5 thin film cathodes by atomic layer deposition†
Erik
Østreng
,
Knut Bjarne
Gandrud
,
Yang
Hu
,
Ola
Nilsen
* and
Helmer
Fjellvåg
Department of Chemistry and Centre for Materials Science and Nanotechnology, University of Oslo, Norway. E-mail: ola.nilsen@smn.uio.no
First published on 22nd July 2014
Abstract
Atomic layer deposition (ALD) has been used to prepare nano-structured cathode films for Li-ion batteries of V2O5 from VO(thd)2 and ozone at 215 °C. The resulting films were strongly textured and rough without application of a template. The best electrochemical performance was observed for 10 nm nano-structured V2O5, that could sustain discharge rates up to 960 C while maintaining 20% of the initial 1 C capacity. The optimized cathode endured a discharge rate of 120 C for more than 1500 cycles while maintaining more than 80% of capacity, proving the rare combination of both high discharge rates and long life time simultaneously. The growth mechanism of the VO(thd)2 and ozone provides a highly textured surface consisting of platelets of V2O5 providing a large contact area towards the electrolyte. The current V2O5 films show potential as cathodes in thin film micro batteries.
Introduction
Nano-structured electrodes appear to be key for achieving high power, fast charge and discharge rates and extended life times for micro batteries.1 Their overall electronic and ionic conductivities may increase due to enhanced contact area with the current collectors and the electrolyte, and possibly also exhibit improved transport properties caused by nano-sized particles. The detrimental effects of volume work during Li-intercalation may also become less severe for nano particles. On this basis, it is interesting to explore whether the semiconducting V2O5 cathode material can be further improved upon nano-structuring. So far there are relatively few reports on vanadium oxide cathodes with both high power and long lifetime. Some examples are: V2O5 applied on nets of TiSi2 as reported by Zhou et al., that retained 80% of the original capacity after 9800 cycles at a rate of 25 C;2 Yamada et al., who developed a carbon–vanadium oxide composite with discharge rates higher than 100 C, however, the redox peaks in the CV do not correspond to V2O5 and the cycling stability was not specified;3 Yan et al. who showed that nano wires of V2O5 can be cycled at rates up to 215 C, while retaining 70% of the original capacity up to 500 cycles;4 and finally Patrissi et al. who showed that nano wires of V2O5 can exhibit discharge rates above 1000 C but with limited cycling stability.5 Several studies have shown that long term cycling stability correlates with the particle size of the cathode material.4–8Vanadium may take oxidation states between two and five in oxides, thus having a potential for storing large amounts of electrochemical energy. Several vanadium oxides can indeed intercalate lithium, and vanadium pentaoxide is well known for its use in lithium ion batteries with a theoretical capacity of 440 mA h g−1. Upon lithium intercalation, phase transitions occur at 3.4 and 3.2 V, first reversibly between the α and ε polymorphs, thereafter between ε and δ (ref. 9). At lower voltages, an apparent irreversible change to the γ-phase occurs at 2.3 V. This phase can, however, be cycled reversibly, but then only at slow rates owing to a low Li-diffusivity.9 The useful capacity of V2O5 is therefore limited to intercalation of one half lithium per formula unit, corresponding to a cycling window between 4 and 2.5 volts and a capacity of 147 mA h g−1. Cycling in this voltage region increases significantly the lifetime of the battery compared to cycling down to 2.3 V or below.9–12
The current work utilizes the atomic layer deposition (ALD) technique, based on self-limited reactions between gas phase precursors and active sites on surfaces, to grow uniform and pin hole free oxide films.13 The ALD technique is proven suitable for deposition of various materials for battery applications,14 either for use in compact thin film batteries15–18 or as coatings for bulk electrode materials.19 One of the real strongholds of ALD is its scalability and the fact that it can do batch processes. In such settings, a traditional slow growth process is turned into an overall fast process capable of utilizing thousands of wafers per hour.14
Le et al. was first to study electrochemical properties of amorphous V2O5 thin films deposited by ALD20 from VO(OiPr)3 (OiPr = isopropoxy) and water. The deposited films were studied as cathodes in lithium-ion batteries between 4.0 and 1.5 V, exhibiting close to theoretical capacity at 0.1 C. Recently, Chen et al. demonstrated very stable cycling between 4.0 and 2.6 V during 100 cycles and at rates of 4 C for crystalline V2O5 as deposited from VO(OiPr)3 and ozone using an alumina template.21 Chen et al. found that crystalline films of V2O5 show better performance in terms of capacity than amorphous films.22 Highest specific capacity and best capacity retention was found for thinner films. This shows that the choice of ALD precursors can have a significant impact on the crystallinity, morphology and the electrochemical properties of the deposited V2O5 films. The prior attempts for growth of V2O5 by ALD have though not resulted in materials capable of both high discharge rates and long life time simultaneously.
The current contribution use ALD to deposit template free nano structured surfaces of vanadium oxide with controlled particle size from a recently discovered ALD process.23 The electrochemical properties of the deposited cathode materials are subsequently characterised with the aim to determine optimal particle size and morphology of the electrode. The currently optimized cathode structure is found to sustain discharge rates up to 960 C and can endure more than 2000 cycles at 120 C, which are the fastest discharge rates and longest lifetimes reported so far for ALD grown cathode materials – by about one order of magnitude. This gives good promise for development of efficient high rate cathodes for micro batteries with basis in inexpensive metals.
Experimental
Thin films of V2O5 were deposited in an F-120 Sat ALD-reactor (ASM Microchemistry Ltd) using VO(thd)2 and O3 as precursors. VO(thd)2 (thd = 2,2,6,6-tetramethylhepta-3,5-dione) was synthesized in-house24 and sublimated inside the reactor at 125 °C. O3 was prepared from 99.6% oxygen using an IN-USA AC-2025 generator. Nitrogen was used as a carrier gas, supplied at a total of 500 sccm as generated by a Schmidlin Sirocco 5, yielding an inert gas (N2 + Ar) purity of 99.999% or better.The films were prepared at a substrate temperature of 215 °C by using 250–5000 ALD-cycles each consisting of 2 s pulse of VO(thd)2, 1 s purge, 3 s pulse of O3, and 2 s purge, as previously reported.23 The films were deposited on silicon (100), soda lime glass and 12 mm steel discs. The glass and steel discs were cleaned with ethanol prior to deposition, while the silicon substrates were used as-supplied.
The crystallinity of the films was characterized using a Bruker D8-Discover with Cu-Kα1-radiation. The surface morphology was investigated by atomic force microscopy (AFM) in tapping mode using a Park Systems XE-70 together with the XEI-software package. Scanning electron microscopy was done using a FEG-SEM FEI Nova NanoSEM 650. The thicknesses of films deposited on silicon substrates were determined by ellipsometry using a J. A. Woollam alpha-SE spectroscopic ellipsometer (SE) together with the CompleteEase software package. The total deposited mass was also measured by X-ray fluorescence spectroscopy (XRF) using a Philips PW2400 and analysed further with the UniQuant software.
V2O5 thin film electrodes were deposited on steel substrates and sealed into CR2032 coin cells for characterisation of electrochemical properties. Cell assembly was carried out in an Ar-filled glove box with water and oxygen levels below 0.1 ppm. Metallic lithium (99.9%, Sigma-Aldrich) was used as anode. The electrolyte consisted of 1 M LiClO4 (99.99%, Sigma-Aldrich) in a 1![[thin space (1/6-em)]](https://www.rsc.org/images/entities/char_2009.gif) :
:![[thin space (1/6-em)]](https://www.rsc.org/images/entities/char_2009.gif) 1 w/w mixture of ethylene carbonate (EC; 99%, Sigma-Aldrich) and dimethyl carbonate (DMC; ≥99% Sigma Aldrich). Electrochemical properties were measured at room temperature using a MPG2 (Biologic) battery cycler. Galvanostatic data were measured during charge/discharge cycles over the voltage range 2.75–3.80 V with 5 min relaxation time after each cycle. For investigation of the cycling stability at high current rates (120 C), a relaxation time of 2 min after each cycle was used. Cyclic voltammetry measurements were carried out in the range 2.75–3.80 V with a scanning rate of 0.1 mV s−1. The electrochemical behaviour of the assembled batteries was also characterized by electrochemical impedance spectroscopy (EIS) (Novocontrol Alpha-A + POT/GAL 15V 10A, Novocontrol Technologies) on fully charged cells with 100% state-of-charge (SoC). Impedance was performed by using an alternating perturbation of 5 mV over a frequency range from 100 kHz to 1 Hz at room temperature. Obtained results were analysed by equivalent circuits using ZView2 electrochemical impedance software (Scribner Associates Inc.).
1 w/w mixture of ethylene carbonate (EC; 99%, Sigma-Aldrich) and dimethyl carbonate (DMC; ≥99% Sigma Aldrich). Electrochemical properties were measured at room temperature using a MPG2 (Biologic) battery cycler. Galvanostatic data were measured during charge/discharge cycles over the voltage range 2.75–3.80 V with 5 min relaxation time after each cycle. For investigation of the cycling stability at high current rates (120 C), a relaxation time of 2 min after each cycle was used. Cyclic voltammetry measurements were carried out in the range 2.75–3.80 V with a scanning rate of 0.1 mV s−1. The electrochemical behaviour of the assembled batteries was also characterized by electrochemical impedance spectroscopy (EIS) (Novocontrol Alpha-A + POT/GAL 15V 10A, Novocontrol Technologies) on fully charged cells with 100% state-of-charge (SoC). Impedance was performed by using an alternating perturbation of 5 mV over a frequency range from 100 kHz to 1 Hz at room temperature. Obtained results were analysed by equivalent circuits using ZView2 electrochemical impedance software (Scribner Associates Inc.).
Results and discussion
Growth of thin films
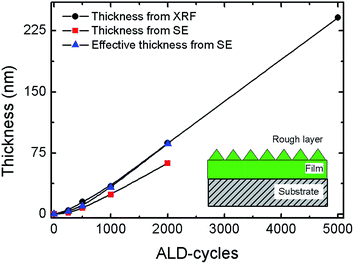
Previously, we showed that the texture of V2O5 deposited by ALD from VO(thd)2 depends strongly on the deposition temperature and on the number of ALD-cycles.23 In the present study we focus on highly textured films that enhance the available surface area. A deposition temperature of 215 °C was therefore chosen.23 The V2O5 electrode properties were studied as function of film thickness for a series of samples deposited during 250, 500, 1000, 2000 and 5000 ALD-cycles, the samples are summarized in Table 1. Since the films are rough and strongly textured, assessment of the amount of deposited material is not straight forward. We therefore report an effective thickness of an idealized specimen with no roughness and with a density corresponding to the bulk state. This effective thickness is obtained by dividing the mass per area obtained from XRF with the bulk density of 3.41 g cm−3. The effective thickness can also be obtained from ellipsometry (SE) by applying the effective medium approximation in reverse to calculate the total mass of the deposited material (assuming 50% V2O5 in the rough layer). In this approximation, the rough surface is treated as a layer where a fraction of the volume is occupied with a dense material and the other by voids, see sketch in Fig. 1. The effective thickness increases non-linearly with the number of deposition cycles up to about 1000 cycles, thereafter the growth follows a linear regime, Fig. 1. This concurs with our previous findings, however, yet different from what typically observed for ALD oxide processes. The non-linear development is caused by a highly textured material that gives rise to an increases in the overall surface area and hence also in the overall growth rate. The sample deposited using 5000 cycles is very rough and appears opaque and milky, and could not be measured properly with optical techniques. In general, the surface roughnesses of all samples were too large for meaningful X-ray reflectometry (XRR) analyses.| Sample name | Cycles | Effective thickness (nm) | Deposited mass (μg) | Orientation |
|---|---|---|---|---|
| ALD250 | 250 | 3.5 | 2.9 | [001] |
| ALD500 | 500 | 10 | 9.51 | [001] |
| ALD1000 | 1000 | 33 | 21.9 | [001]/[010] |
| ALD2000 | 2000 | 86 | 55.8 | [001]/[010] |
| ALD5000 | 5000 | — | 154 | Random |
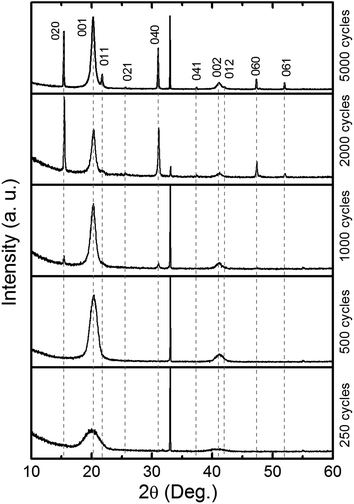
According to X-ray diffraction all samples consist of crystalline V2O5 (space group Pmmn),25 as shown in Fig. 3. The texture of the samples varies with the number of deposition cycles. When deposited with less than 1000 ALD-cycles the predominant orientation is along [001]. The broad reflections suggest that the crystallites are rather thin in this direction. A sudden appearance of a sharp (0k0)-family of Bragg reflections is seen for depositions in the range 1000–2000 cycles. Furthermore, reflections such as (021) and (061) become visible for depositions with 5000 cycles. The evolution in intensity and shape of the different families of reflections indicates that the film consists of thin platelets with its thinnest direction along the c-axis. The evolution of texture versus deposition cycles is studied with SEM and AFM, see Fig. 2 and ESI 1.† In the initial growth stage, the plates nucleate and grow fastest in the a- and b-directions, filling the available surface with plates oriented with [001] normal to the substrate plane. However, those nuclei orientated with the a- or b-axis normal to the substrate will protrude further from the substrate than the [001] oriented platelets and experience a faster growth normal to the substrate surface. These a- or b-oriented platelets will eventually overgrow the other nuclei and become more visible by XRD. Eventually the surface is composed of platelets with their edges orientated normal to the substrate. The differences in width of the {00l} and the other reflections are also in favour of a platelet morphology. This evolution in texture is not typical for thin films grown by ALD which usually result in more isotropic shapes of the crystallites, or amorphous growth. The crystal growth was therefore evaluated by simulation of evolution in texture based on collective growth of crystallites in the same manner as presented by Nilsen et al.,26 see Fig. 2E. In these simulations the crystallite shape is modelled as octagons inspired by SEM and AFM-images of the thickest samples and show the same type of evolution as described above.
The morphology and crystallite size is similar for samples deposited on silicon and steel discs used for assembling batteries except for samples deposited using 250 and 5000 cycles, as shown in ESI 2.† The samples deposited using 250 cycles do not appear to fully cover the surface, thus exposing the steel to the electrolyte solution. In addition, this thin sample has a high roughness dominated by the substrate, thus making direct comparison less relevant.
Electrochemical investigations
The as-deposited V2O5 coatings on stainless steel discs were tested as cathode in half-cell configurations versus Li/Li+. A potential window of 2.75–3.80 V was chosen due to the reported good cycling stability of V2O5 in this range.9–11 This voltage window corresponds to one mole of intercalated lithium per formula unit of V2O5 resulting in a theoretical capacity of 147 mA h g−1.The electrochemical behaviour of the V2O5 thin films was investigated by cyclic voltammetry (CV), as shown in Fig. 4. Apart from sample ALD250, all samples show as expected,9 reduction and oxidation peaks around 3.4 and 3.2 V for intercalation of lithium into V2O5. No other peaks are observed, indicating that V2O5 is the only active material. As expected, the current densities for the oxidation and reduction peaks increase with increasing film thickness. All samples (except ALD250) show similar and close to theoretical capacity (147 mA h g−1). The potentials for Li intercalation and deintercalation of the thinnest samples are closer to the expected values (3.4 and 3.2 V vs. Li+/Li)9 than for the thicker samples, see ESI 6.† The over-potentials are about 0.08 V for ALD5000, about twice of what is observed for ALD500. Considering the morphology and the smaller platelet size for ALD500 than for ALD5000 it is plausible that the kinetics of the smaller crystallites is superior. Note, however, that for ALD500 the majority of the crystallites are likely in contact with both the electrolyte and the current collector.
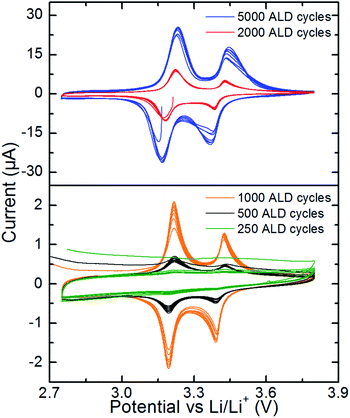 | ||
| Fig. 4 Cyclic voltammetry of V2O5 thin films in the voltage range 2.75–3.80 V at a scan rate of 0.1 mV s−1. | ||
In order to investigate the effect of film thickness and particle size on the cycleability, all samples were investigated by galvanostatic charge/discharge at 1 C rate for 75 cycles as shown in ESI 5.† Apart from ALD250, all samples show close to 100% columbic efficiency, indicating fully reversible lithium intercalation and deintercalation.
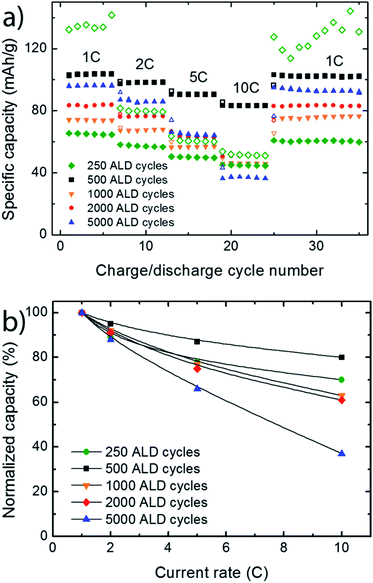
The kinetics of the V2O5 based thin film battery cells were investigated by performing charge discharge cycles with increasing C-rates. Fig. 5 shows discharge curves obtained from galvanostatic cycling at current rates between 1 and 10 C (1 C = 147 mA g−1). At 1 C, all discharge curves (except ALD250) show two distinct voltage plateus consistent with the well-defined phase tranformations of α–ε–δ in LixV2O5.9Fig. 6 shows that the thinner films have better capacity retention at higher C-rates. ALD500 is least affected by increased discharge rates with a decrease in capacity from 104 to 83 mA h g−1 between 1 and 10 C. The largest capacity loss is seen for ALD5000 (from 96 to 36 mA h g−1). The specific capacity is recovered for all samples when the current rate is decreased from 10 C back to the initial value of 1 C, showing that the capacity loss at high rate performance is reversible.
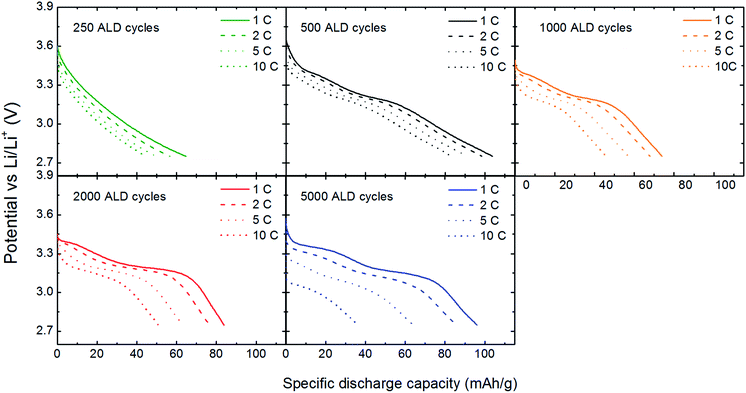 | ||
| Fig. 5 Voltage vs. capacity curves of coin cells with V2O5 as cathode deposited during 250–5000 ALD-cycles. Discharge rates 1–10 C, voltage window 2.75–3.80 V. | ||
In order to compare rate performances, the specific capacity from the second discharge cycle for each C-rate is normalized to the discharge capacity at 1 C, Fig. 6b. The capacity retention at higher C-rates decreases as the effective film thickness increase. ALD500 with a surface dominated by [001]-oriented V2O5 platelets, shows the best rate perfomance. The high rate performance probably results from the morphology of the cathode. ALD500 consists of a single layer of nano particles which ensures good contact between the film, current collector, and electrolyte. The plates are also rather thin along the c-direction, which can enhance the intercalation rate. Thin layers of V2O5 have previously been shown to have excellent rate performance.27 The directional dependency of the ionic conductivity could play a role in the variation of capacity with charging rate. Braithwaite et al. have found by DFT-modelling that conduction of lithium is most favourable along [100],28 which is also verified experimentally.29 [100] is within the plane of the platelets observed in the AFM and SEM-images.
The drop in capacity retention from ALD500 to ALD1000 and ALD2000, indicates slower kinetics and larger electrochemical polarization. As observed from the SEM images and also measured by AFM (ESI Fig. 4†), both the platlets size and thickness grows larger with the number of deposition cycles. Thus, it is not suprising that there is an optimal V2O5 platlet thickness and surface morphology, were the kinetics are at its best. As the thickness and size of the platlets continues to increase above this optimal size, the Li+ – electron paths becomes longer and the kinetics are reduced.
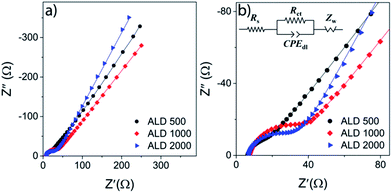
To further investigate the impact of the electrode thickness on the kinetics, three new coin-cells were assembled and investigated by electrochemical impedance spectroscopy EIS, see Fig. 7. The coin cells were cycled two times between 2.75 and 3.80 V before the EIS measurements were carried out at open-circuit voltage at 100% SoC.
The Nyquist plots of the impedance obtained from assembled cells with different thicknesses of V2O5 thin film electrodes at fully charged state are depicted in Fig. 7, as well as its enlarged high frequency region, shown as Fig. 7b. Solid lines represent the results of fitting by using the corresponding equivalent circuits, as inserted in Fig. 7b. No matter the thicknesses of V2O5 thin films, the impedance consists of a depressed semi-circle in high frequency region related to the charge transfer process at electrolyte/V2O5 interface (RctCPEdl), and an inclined line in low frequency region attributed to the solid-state diffusion of Li-ions (Zw). And as represented in the equivalent circuits, the series ohmic resistances (Rs) of all cell components can be obtained from the intercepts of impedance with the Z′ axis. From the analysis model applied in this work, the high frequency charge transfer resistance (Rct), which is ascribed to the Li intercalation and deintercalation into/from the thin films electrodes shows considerable thickness dependence, as shown in Table 2. ALD500 electrode exhibits much lower Rct than the thicker electrodes, suggesting an enhanced kinetics of Li+ intercalation/deintercalation at the electrolyte/electrode interface which enables a faster discharge/charge rate.
| Sample name | R s (Ω) | R ct (Ω) |
|---|---|---|
| ALD500 | 6.0 | 7.8 |
| ALD1000 | 7.0 | 23.1 |
| ALD2000 | 6.3 | 25.1 |
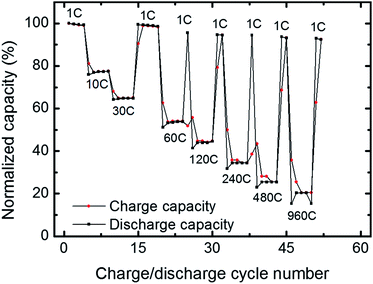
Of the examined thicknesses and morphologies, ALD500 shows superior cycleability and capacity at high discharge rates. A second coin cell battery was assembled to evaluate the performance limits. Charge rates between 1 and 960 C were explored with good performance results. At 960 C the coloumbic efficiency is still close to 100% whereas the capacity is lowered to 20% of the capacity at 1 C, see Fig. 8. In terms of specific power, this corresponds to 395 W g−1 V2O5, which is comparable to what was acheived from template based nanowires of V2O5 that showed 405 W g−1 (ref. 5) at 1021 C. The current cycling speed and specific power appears superior to recent results from pseudocapacitors where 230 W g−1 was obtained at 1000 C.30 A comparison shows that the 141 A g−1 current density from the present battery is about seven times higher than the 20 A g−1 densities reported for ALD grown vanadium oxide pseudocapacitors.31
In order to further investigate the cycling stability, a V2O5 cathode made with 500 ALD-cycles was subjected to 2000 charge discharge cycles at 120 C, Fig. 9. The capacity remains stable up to 650 cycles and first after 1530 cycles the capacity drops below 80% of the initial value (grey band in Fig. 9). The battery was further cycled up to a 4000 cycles where it still retained some 30% capacity (ESI 7†). The combination of the high cycling stability and high power density reported currently has to the best of our knowledge not been previously reported.
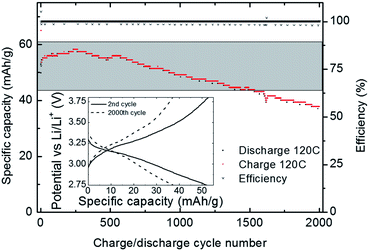 | ||
| Fig. 9 Discharge rate cycling stability at 120 C conducted directly after the rate performance test shown in Fig. 8. The grey band indicates a window with less than 80% capacity loss relative to the initial capacity (55 mA h g−1 at 120 C). Coulombic efficiency is close to 100%. Inset: charge and discharge curves shown for the 2nd and 2000th cycle. | ||
The combination of high power and high cycling stability is ascribed to the particle size and the good contact with the current collector. The findings suggest that properly nano-structured V2O5 is an even more feasible cathode material than previously anticipated. Nano-structuring of V2O5 may possibly be a feasible route to high energy and high power cathodes with long life, also in bulk. Preparing cathodes as thin films using ALD also have the advantage that it requires no binders or carbon which increases the capacity. ALD can also be used to deposit electroactive films inside 3D structures as suggested by Notten et al.32
Conclusions
Nano-structured cathodes of V2O5 with different thickness, particle sizes, and morphologies were deposited by atomic layer deposition in a template free manner from VO(thd)2 and O3. The samples subjected to electrochemical testing were prepared directly on stainless steel discs using between 250 and 5000 ALD-cycles. The morphology of the cathode strongly depends on the number of applied ALD-cycles. For less than 500 ALD-cycles a single layer of thin platelet shaped crystallites are formed. For thicker electrodes, prepared by applying more than 500 ALD cycles, the electrochemical performance drop. A cathode layer of 10 nm (500 ALD-cycles) show superior electrochemical performance relative to other cathodes thicknesses, probably due to good contact with the current collector and the electrolyte, along with small particle size. All samples proved stable during cycling for at least 75 cycles at discharge rates of 10 C. The optimized cathode handled discharge rates of up to 960 C. At 120 C the cathode showed stable capacity up to 650 cycles with a modest capacity fading that remained within 80% of the original capacity after 1530 cycles and endured up to 4000 cycles without failure. The combination of high power density and longevity makes the reported nano-structured V2O5 cathodes quite unique. The results show that lithium ion battery cathodes can be made from nano-structured V2O5 with high cycling stability, fast charge and discharge as well as very high power density by optimizing particle size and morphology. The reported V2O5 cathodes have potential to act as an interesting material for all-solid-state micro batteries.Acknowledgements
The authors want to thank Michael Getz for performing the depositions of the V2O5 samples for EIS characterisation and Dr Annett Thøgersen, SINTEF, Oslo, for conducting the SEM-analysis. Funding through the projects MAHEATT, no. 227541 by the European Commission, and 3D-batt 2000030/s60 by the Research Council of Norway, is gratefully acknowledged. The Department of Chemistry, University of Oslo is acknowledged for financial support.References
- H. Zhang, X. Yu and P. V. Braun, Nat. Nanotechnol., 2011, 6, 277–281 CrossRef CAS PubMed.
- S. Zhou, X. Yang, Y. Lin, J. Xie and D. Wang, ACS Nano, 2011, 6, 919–924 CrossRef PubMed.
- H. Yamada, K. Tagawa, M. Komatsu, I. Moriguchi and T. Kudo, J. Phys. Chem. C, 2007, 111, 8397–8402 CAS.
- J. Yan, A. Sumboja, E. Khoo and P. S. Lee, Adv. Mater., 2011, 23, 746–750 CrossRef CAS PubMed.
- C. J. Patrissi and C. R. Martin, J. Electrochem. Soc., 1999, 146, 3176–3180 CrossRef CAS PubMed.
- S. H. Choi, J.-W. Son, Y. S. Yoon and J. Kim, J. Power Sources, 2006, 158, 1419–1424 CrossRef CAS PubMed.
- M. Jo, Y.-S. Hong, J. Choo and J. Cho, J. Electrochem. Soc., 2009, 156, A430–A434 CrossRef CAS PubMed.
- A. Q. Pan, H. B. Wu, L. Zhang and X. W. Lou, Energy Environ. Sci., 2013, 6, 1476–1479 CAS.
- N. A. Chernova, M. Roppolo, A. C. Dillon and M. S. Whittingham, J. Mater. Chem., 2009, 19, 2526–2552 RSC.
- G. Sudant, E. Baudrin, B. Dunn and J. M. Tarascon, J. Electrochem. Soc., 2004, 151, A666–A671 CrossRef CAS PubMed.
- J. A. Yan, A. Sumboja, E. Khoo and P. S. Lee, Adv. Mater., 2011, 23, 746–751 CrossRef CAS PubMed.
- M. S. Whittingham, Chem. Rev., 2004, 104, 4271–4301 CrossRef CAS.
- V. Miikkulainen, M. Leskelä, M. Ritala and R. L. Puurunen, J. Appl. Phys., 2013, 113, 021301 CrossRef PubMed.
- O. Nilsen, V. Miikkulainen, K. B. Gandrud, E. Østreng, A. Ruud and H. Fjellvåg, Phys. Status Solidi A, 2013, 211, 357–367 CrossRef PubMed.
- T. Aaltonen, O. Nilsen, A. Magraso and H. Fjellvåg, Chem. Mater., 2011, 23, 4669–4675 CrossRef CAS.
- V. Miikkulainen, O. Nilsen, M. Laitinen, T. Sajavaara and H. Fjellvåg, RSC Adv., 2013, 3, 7537–7542 RSC.
- E. Østreng, P. Vajeeston, O. Nilsen and H. Fjellvåg, RSC Adv., 2012, 2, 6315–6322 RSC.
- V. Miikkulainen, A. Ruud, E. Østreng, O. Nilsen, M. Laitinen, T. Sajavaara and H. Fjellvåg, J. Phys. Chem. C, 2013, 118, 1258–1268 Search PubMed.
- Z. Chen, Y. Qin, K. Amine and Y. K. Sun, J. Mater. Chem., 2010, 20, 7606–7612 RSC.
- V. K. Le, H. Groult, A. Mantoux, L. Perrigaud, F. Lantelme, R. Lindstroem, R. Badour-Hadjean, S. Zanna and D. Lincot, J. Power Sources, 2006, 160, 592–601 CrossRef PubMed.
- X. Chen, E. Pomerantseva, P. Banerjee, K. Gregorczyk, R. Ghodssi and G. Rubloff, Chem. Mater., 2012, 24, 1255–1261 CrossRef CAS.
- X. Chen, E. Pomerantseva, K. Gregorczyk, R. Ghodssi and G. Rubloff, RSC Adv., 2013, 3, 4294–4302 RSC.
- E. Østreng, O. Nilsen and H. Fjellvåg, J. Phys. Chem. C, 2012, 116, 19444–19450 Search PubMed.
- M. A. K. Ahmed, H. Fjellvåg, A. Kjekshus and B. Klewe, Z. Anorg. Allg. Chem., 2004, 630, 2311–2318 CrossRef CAS PubMed.
- V. Shklover, T. Haibach, F. Ried, R. Nesper and P. Novák, J. Solid State Chem., 1996, 123, 317–323 CrossRef CAS.
- O. Nilsen, O. B. Karlsen, A. Kjekshus and H. Fjellvåg, Thin Solid Films, 2007, 515, 4550–4558 CrossRef CAS PubMed.
- X. Rui, Z. Lu, H. Yu, D. Yang, H. H. Hng, T. M. Lim and Q. Yan, Nanoscale, 2013, 5, 556–560 RSC.
- J. S. Braithwaite, C. R. A. Catlow, J. D. Gale and J. H. Harding, Chem. Mater., 1999, 11, 1990–1998 CrossRef CAS.
- H. Miyazaki, H. Sakamura, M. Kamei and I. Yasui, Solid State Ionics, 1999, 122, 223–229 CrossRef CAS.
- V. Augustyn, J. Come, M. A. Lowe, J. W. Kim, P.-L. Taberna, S. H. Tolbert, H. D. Abruña, P. Simon and B. Dunn, Nat. Mater., 2013, 12, 518–522 CrossRef CAS PubMed.
- S. Boukhalfa, K. Evanoff and G. Yushin, Energy Environ. Sci., 2012, 5, 6872–6879 CAS.
- P. H. L. Notten, F. Roozeboom, R. A. H. Niessen and L. Baggetto, Adv. Mater., 2007, 19, 4564–4567 CrossRef CAS PubMed.
Footnote |
| † Electronic supplementary information (ESI) available: Detailed AFM studies and electrochemical results. See DOI: 10.1039/c4ta00694a |
| This journal is © The Royal Society of Chemistry 2014 |

