 Open Access Article
Creative Commons Attribution 3.0 Unported Licence
High performance of microtubular solid oxide fuel cells using Nd2NiO4+δ-based composite cathodes
Miguel A.
Laguna-Bercero
*a,
Amir R.
Hanifi
b,
Hernán
Monzón
a,
Joshua
Cunningham
b,
Thomas H.
Etsell
b and
Partha
Sarkar
c
aInstituto de Ciencia de Materiales de Aragón (ICMA), CSIC- Universidad de Zaragoza, C/ Pedro Cerbuna 12, E-50009, Zaragoza, Spain. E-mail: malaguna@unizar.es
bDepartment of Chemical & Materials Engineering, University of Alberta, Edmonton, Alberta T6G 2V4, Canada
cEnvironment & Carbon Management, Alberta Innovates – Technology Futures, Edmonton, Alberta T6N 1E4, Canada
First published on 6th May 2014
Abstract
Nd2NiO4+δ infiltrated into porous yttria stabilized zirconia (YSZ) is proposed in this work as a cathode for solid oxide fuel cells (SOFCs). In order to obtain nickelate single phase, calcination times and temperatures of the salt precursors are studied. Anode supported microtubular cells using this cathode are fabricated and characterized, showing power densities of about 0.76 W cm−2 at 800 °C and a voltage as high as 0.8 V. No degradation is detected after 24 hours under current load, assuring reasonable stability of the cell. Preliminary solid oxide electrolysis cell (SOEC) results show slightly better performances in comparison with SOFC operation. It is believed that infiltration of nickelate salt precursors followed by calcination proposed in this work avoids high temperature sintering of the nickelate phase with the electrolyte and as a consequence, prevents their reaction. For this reason, infiltrated nickelates are very attractive for their use as intermediate temperature (IT) SOFC cathodes.
1. Introduction
Solid oxide fuel cells (SOFCs) are one of the cleanest and most efficient methods to directly convert chemical to electrical energy. In addition, fuel flexibility is another advantage of SOFCs as they can use hydrogen or different hydrocarbons and also operate in reverse mode to produce hydrogen and oxygen (steam electrolysis) or syngas from CO2 and steam (co-electrolysis).1–3 However, one of the major issues still to be solved is the large contribution to cell resistance due to electrode polarization at the cathode side, especially at intermediate temperatures (IT, 500–700 °C).4,5 Different alternatives to the traditional lanthanum strontium manganite (LSM) or lanthanum strontium cobalt ferrite (LSCF) perovskites have been proposed for IT-SOFC cathodes such as, for example, Ruddlesden-Popper phases, double perovskites based on the LnBaCo2O5+δ formula, with Ln = Pr, Nd, Sm, or Gd, and the CeNbO4+δ fergusonite.6,7 Ruddlesden-Popper materials are considered MIEC (mixed ionic and electronic conductor) materials, as they exhibit good electronic conductivity due to the metal mixed valence, and good ion transport properties due to the oxygen over-stoichiometry.8From all these families, the nickelates Ln2NiO4+δ, with Ln = Nd, La or Pr, have been widely investigated.7 For example, Mauvy et al. studied the electrochemical behaviour of nickelate-type cathodes and concluded that the Nd-derivative would present the best performance.9 This material has been also proposed as an oxygen electrode for SOEC applications.10 The phase presenting the highest oxygen diffusion parameters is Pr2NiO4+δ (PNO).11 The main drawback of these nickelate phases is their reactivity with standard YSZ or GDC electrolytes. For example, a significant reaction was observed between La2NiO4+δ (LNO) and GDC (gadolinia doped ceria) at 900 °C with the formation of the higher order Ruddlesden-Popper phases.12 Similar results were found by Amow et al. on cobalt doped LNO and GDC composites.13 In addition, Montenegro-Hernández et al.14 studied the chemical compatibility of Ln2NiO4+δ (Ln = La, Pr, Nd) with both GDC and YSZ electrolyte materials, showing that La2NiO4+δ reacts with both YSZ and GDC above 900 and 700 °C, respectively; the Pr-derivative showed inconclusive results due to Pr2NiO4+δ decomposition; and finally the Nd-derivate reacts with both YSZ and GDC at about 1000 °C. From all the literature data we can conclude that, although IT-SOFCs are intended to be used at temperatures below 800 °C, the use of the nickelates as SOFC electrodes is very limited, as typical sintering temperatures are usually higher than 1000 °C in order to get strong adhesion at the electrode/electrolyte interface and also a suitable microstructure.
In order to avoid sintering the nickelate phase with the electrolyte and, as a consequence avoid their reaction, infiltration of nickelate salt precursors followed by calcination is proposed in this work. Infiltration is found to be an efficient technique for high performing electrode fabrication in SOFCs. It is carried out in order to improve the catalytic activity and/or increase the ionic or electronic conductivity in fuel cell anodes and/or cathodes. While the fine dispersed infiltrate particles enhance the catalytic activity, the connected nano-sized particles (which have a high surface area) introduce conduction pathways and can lower the cell resistance and thereby improve the electrochemical performance. This process enables reduction of the cell operating temperature and thus improvement in the long term stability of the cells.15–19 For example, it is possible to modify the microstructure of a conventional LSM-YSZ composite oxygen electrode by infiltrating LSM nanoparticles in order to increase the electrical performance of the cell.20–23
One of the advantages of this fabrication method is an increased TPB (triple-phase boundary) length compared with the standard LSM–YSZ composite due to the smaller size of the dispersed LSM particles with a higher surface area. In addition, no sintering process for the LSM cathode is needed and, as a consequence, formation of non-conducting secondary phases such as La2Zr2O7 and also coarsening of the catalyst during sintering will be eliminated.
Remarkable results against anode thermal and redox cycling were demonstrated by Hanifi et al. by infiltrating Ni–SDC nanoparticles into the anode support.24 They showed that after 100 thermal and 10 redox (with air purging as anode oxidant) cycling tests, the cell showed extremely high resistance to both thermal and redox cycling as confirmed by unaltered OCV values and a crack free anode and electrolyte microstructure confirmed by SEM analysis. Infiltration of Ruddlesden-Popper materials into YSZ porous structures was first proposed by Choi et al.25 They fabricated Lan+1NinO3n+1 (n = 1, 2, 3)-YSZ composites as cathodes for planar SOFCs, obtaining maximum power densities of 0.717, 0.754 and 0.889 W cm−2 at 750 °C for La2NiO4, La3Ni2O7 and La4Ni3O10, respectively.
The selected configuration for the present study is the microtubular geometry (mT-SOFC), as they have recently attracted much interest due to their superior resistance to thermal cycling, shorter start-up/shut-down times and higher volumetric power densities in comparison with the traditional planar geometry.26–28 Results including the fabrication of the cell and infiltration processes, microstructural and structural analysis, as well as electrochemical studies will be described.
2. Experimental
Standard NiO–YSZ (yttria stabilized zirconia) tubes were fabricated at ICMA by cold isostatic pressing (CIP) of NiO (Alfa-Aesar), YSZ (Tosoh) and pore former powders, followed by spray coating of the electrolyte using a YSZ suspension in isopropanol. Both components were then co-sintered at 1400 °C. The final thickness of the YSZ electrolyte is about 18 μm. Additional details of the half-cell fabrication process can be found in ref. 29 and 30.For infiltration of the Nd2NiO4+δ (NNO) phase, YSZ (calcined at 1500 °C, milled for 72 h in water and dried) was mixed with 20 vol% graphite, dispersant (Menhaden fish oil), azeotropic solvent (toluene/ethanol) and binder (polyvinyl butyral). The components were mixed at 300 rpm for 1 h in a planetary mill prior to coating. The mixture was then applied to the sintered electrolyte by briefly dip coating. The tube was heat treated at 300 °C and 700 °C for 1 h to burn off the organic components and graphite and sintered at 1350 °C for 3 h to form a thin porous layer of about 35 μm in thickness.
In order to infiltrate Nd–nickelate into the porous support, 0.73 g Ni(NO3)2·6H2O and 2.19 g Nd(NO3)3·6H2O were mixed with 0.3 g of a polymeric dispersant (Triton X-45, Union Carbide Chemicals and Plastics Co. Inc.) and 1 g water. The mixture was heat treated at 100 °C to give a high viscosity, concentrated solution. The viscous solution drops were placed on the surface of the thin porous YSZ layer. The tube was then dried at 120 °C for 15 minutes then heat treated at 350 °C for 15 minutes to co-precipitate the NiO and Nd2O3. The infiltration procedure was repeated four times to deposit sufficient infiltrated particles into the YSZ matrix.
To calculate the open porosity of the porous YSZ layer (prior to cathode infiltration), a 3 mm disk was cast (with the same recipe used for the porous YSZ layer) and sintered at 1350 °C for 3 h. A density measurement was carried out on the disk applying Archimedes principle showing 50 vol% open porosity for the disk with a similar microstructure and porosity to that of the porous YSZ layer. By measuring the weight of the anode support, electrolyte and the coated thin porous YSZ layer during cell fabrication, the volume of the infiltrate in the YSZ structure was calculated based on the weight gain of the cathode following infiltration taking into account the density of YSZ and the Nd2NiO4+δ.
In order to track the phase evolution following calcination between 800–1000 °C, similar Nd–nickelate recipes as explained above were prepared in separate porcelain crucibles and each batch was heat treated at a specific temperature. The active surface area of the cathodes was 1.1 cm2.
XRD patterns of the cathode samples were directly collected over the surface of the tubes using CuKα radiation in a D-Max Rigaku instrument. The percentages were calculated based on the intensity ratios among the main peaks for each phase. SEM analysis was carried out on polished transverse cross-section samples using a Merlin field emission SEM (Carl Zeiss, Germany). Electrochemical studies were performed using a potentiostat/galvanostat/FRA analyzer (Princeton Applied Research, Oak Ridge, USA) at temperatures between 600 °C and 800 °C using RT humidified pure hydrogen at the fuel electrode (QT = 100 sccm) and 20% oxygen/80% nitrogen (QT = 100 sccm) at the oxygen electrode site. Excess hydrogen was used in order to avoid concentration polarization at high current densities. Fuel utilization was about 10%. Electrical connections were made using four platinum wires. Ni foam was used as current collector on the fuel electrode side (inner side of the tube) and Au paste (Metalor) as the current collector on the oxygen electrode side. j–V (current density–voltage) measurements were recorded in galvanodynamic mode from OCV down to 0.5 V at a scan rate of 2.5 mA cm−2 s−1. Hydrogen consumption was analyzed using a gas chromatograph (Agilent Technologies MicroGC 900). Measured values corresponded to those predicted by Faraday's law. AC impedance measurements were recorded in galvanostatic mode using a sinusoidal signal amplitude of 20 mA over the frequency range of 500 kHz down to 0.1 Hz. Details of the experimental set-up can be found elsewhere30–32
3. Results and discussion
3.1. Infiltration of Nd and Ni salt precursors
Based on subsequent heat treatment of the infiltrated cathode at 800 °C and recording weight changes, the calculation shows that the ratio of YSZ![[thin space (1/6-em)]](https://www.rsc.org/images/entities/char_2009.gif) :
:![[thin space (1/6-em)]](https://www.rsc.org/images/entities/char_2009.gif) Nd2NiO4+δ was estimated to be 74
Nd2NiO4+δ was estimated to be 74![[thin space (1/6-em)]](https://www.rsc.org/images/entities/char_2009.gif) :
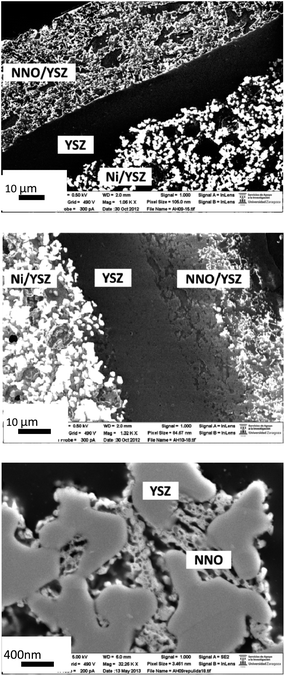
:![[thin space (1/6-em)]](https://www.rsc.org/images/entities/char_2009.gif) 26 vol%. Infiltration of the Nd–nickelate recipe four times led to a decrease of about 13% in open porosity from 50 vol% to 37 vol%. Despite its notable dispersed and homogeneous microstructure, it is remarkable that this small amount of the infiltrated phase could provide sufficient electronic conduction. Fig. 1 shows the interface between the electrolyte and the infiltrated cathode in the cell studied, presenting a suitable connectivity and thus electronic conductivity which together with expected high catalytic activity (due to the high surface area of the particles) can lead to a high performing cathode. Interestingly Nd–nickelate cathode appears in the form of nano-sized fine particles (50–100 nm) forming the edge of planar Nd–nickelate cathode which themselves are stacked together. While fine particles improve the TPB length and the active reaction sites, the cathode planar stack can form a suitable structure for conduction path. This interesting morphological feature for Nd–nickelate cathode is not reported previously and might be an important reason of its well-functioning beside its respectable electronic conduction.
26 vol%. Infiltration of the Nd–nickelate recipe four times led to a decrease of about 13% in open porosity from 50 vol% to 37 vol%. Despite its notable dispersed and homogeneous microstructure, it is remarkable that this small amount of the infiltrated phase could provide sufficient electronic conduction. Fig. 1 shows the interface between the electrolyte and the infiltrated cathode in the cell studied, presenting a suitable connectivity and thus electronic conductivity which together with expected high catalytic activity (due to the high surface area of the particles) can lead to a high performing cathode. Interestingly Nd–nickelate cathode appears in the form of nano-sized fine particles (50–100 nm) forming the edge of planar Nd–nickelate cathode which themselves are stacked together. While fine particles improve the TPB length and the active reaction sites, the cathode planar stack can form a suitable structure for conduction path. This interesting morphological feature for Nd–nickelate cathode is not reported previously and might be an important reason of its well-functioning beside its respectable electronic conduction.
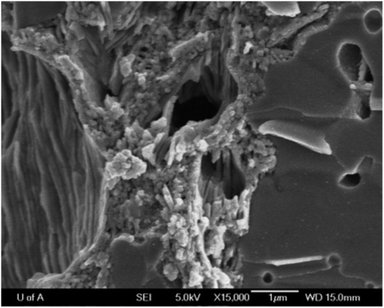 | ||
| Fig. 1 SEM images showing the interface between the YSZ electrolyte and porous YSZ infiltrated with the Nd–nickelate recipe. | ||
3.2. Effect of calcination temperature
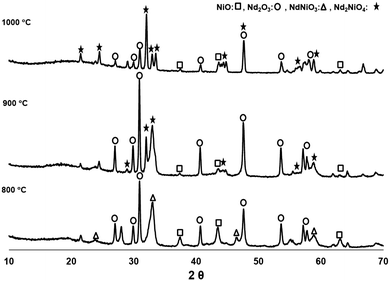
Different calcination temperatures were studied in order to identify the best conditions which will lead to the formation of the NNO single phase. Analysis of the phases calcined at temperatures between 800 °C and 1000 °C for a period of 3 hours are summarized in Table 1 and Fig. 2. From the analysis we can conclude that the NdNiO3 phase is first being formed at a calcination temperature of 800 °C. Further heating up to 900 and 1000 °C leads to the desired Nd2NiO4 phase. However, even at a calcination temperature of 1000 °C, there is still some unreacted NiO and Nd2O3, but we have demonstrated that they do not significantly affect the electrical performance of the cell, as these oxides exhibit reasonable electrical conductivity at the cell operating temperatures. In addition, the analogue perovskite LaNiO3 (doped or undoped with Fe) has been reported to act as a good cathode for SOFCs due to its notable electrical properties.33 Although cathode composition was not fully optimized, two single cells were fabricated and tested (cells A and B) following this procedure.| Calcination temperature (°C) | NiO (%) | Nd2O3 (%) | NdNiO3 (%) | Nd2NiO4 (%) |
|---|---|---|---|---|
| 800 | 16.5 | 49.5 | 34.0 | — |
| 900 | 7.0 | 65.0 | — | 28.0 |
| 1000 | 10.0 | 26.0 | — | 64.0 |
However, a more detailed study (longer calcination times or even higher calcination temperatures) is needed in order to minimize and/or avoid the individual nickel and neodymium oxides, as we suspect this could further enhance the performance of the cathodes. In addition, to study the compatibility of the NNO infiltrated with YSZ, XRD patterns were also directly collected over the surface of infiltrated tubes calcined at temperatures from 800 to 950 °C for two hours. It is also notable that no secondary phases such as the Nd2Zr2O7 insulating phase were detected under these conditions.
3.3. Electrochemical performance of the NiO–YSZ/YSZ/NNO–YSZ tubular cell
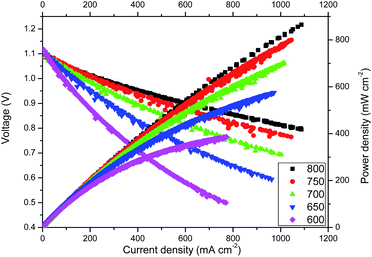
Highly remarkable performance was achieved for cell A, as observed from the voltage–current density-power density curves shown in Fig. 3. At 800 °C, power densities of about 0.76 W cm−2 were recorded at a voltage as high as 0.8 V. Note that due to limitations of the current load instrument we could not measure above currents of 1.1 A. However, based on linear extrapolation, maximum power densities of about 1.3 W cm−2 are expected at 800 °C. In addition, at IT temperatures (600 °C), the maximum power density is still significant: 0.4 W cm−2. These results are to our knowledge the highest power densities reported using microtubular YSZ-based cells.34 Similar microtubular fuel cell performances have been reported using ceria-based electrolytes,35 but it is well-known that despite its lower ionic conductivity compared with doped ceria, YSZ cells are much more reliable due, in part, to better chemical stability and durability.1As the cathode of cell A presents a mixture of phases, an analogue cell (cell B) was also tested after previous in situ annealing at 950 °C for 12 hours. This annealing was performed in an effort to produce a pure Nd2NiO4 phase at the cathode. However, the performance of the cell after annealing was poorer than the first cell, with maximum power densities of about 0.6 W cm−2 at 800 °C obtained. As a consequence, no further studies were performed using cell B, and further electrochemical results will refer to cell A.
3.4. AC impedance analysis of the cells
AC impedance studies were carried out prior to and after each j–V curve as a function of temperature, and also after chronopotentiostatic studies. Nyquist plots recorded at OCV before SOFC current load are shown in Fig. 4. AC impedance analysis of SOFC cells by impedance models is rather complex, where up to six different processes are taking place at each electrode.36 As an example, for similar microtubular SOFCs using a different cathode (LSM/YSZ), three processes were distinguished: gas diffusion at the anode (low frequency), and activation polarization at both the cathode (medium frequency) and anode (high frequency).29 Usually, gas diffusion at the cathode is also observed.36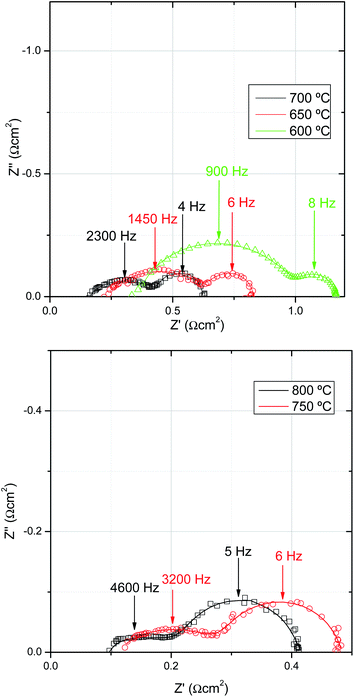 | ||
| Fig. 4 Nyquist plots for cell A collected under OCV conditions at (a) 600 °C, 650 °C, 700 °C and (b) 750 °C and 800 °C. | ||
Based on previous literature, the model proposed in this work contemplates five different major contributions to the whole cell impedance, consisting of an ohmic resistance (Re), two resistance-constant phase elements (R1CPE1) and (R2CPE2), and two finite length Warburg diffusion elements (W3 and W4). These elements account, respectively, for the electrolyte and lateral conduction through electrodes (Re), cathode charge transfer (R1CPE1), anode charge transfer (R2CPE2), and gas diffusion through the cathode (W3) and anode (W4). Although this model was previously proposed and validated for similar mT Ni–YSZ/YSZ/LSM–YSZ cells,37 the present assignation is still tentative due to the complexity of the system. As expected, both ohmic and electrode polarization are thermally activated. First a small contribution (R1CPE1) appears at frequencies around 20–25 kHz and the capacitance values are in the range of ∼10−4 F cm−2 (almost unaltered with temperature), associated with oxygen ions transferring through the electrolyte/cathode interface, as previously reported by Mauvy et al.9 The second contribution (R2CPE2) appears at around 1–5 kHz and based on previous studies was tentatively associated with anode charge transfer. The third contribution, also relatively small (W3), was attributed to gas diffusion within the porous cathode. The last contribution presents summit frequency values of around 6 Hz that seems to be temperature independent. As we are using an anode porous support, it is reasonable to assign this contribution to gas diffusion at the anode, in concordance with previous results.29
In addition, EIS spectra were also recorded under current load (200 mA) at 600 °C and the only clear conclusion in which we can be reasonably confident is that under those conditions all the polarization components decreased. However, due to the difficulty of introducing a reference electrode and also due to the limitation of the model, it was not possible to present detailed information about cathode and anode overpotentials. Detailed studies as a function of the partial pressures at both the anode and cathode are needed in order to fully understand the different processes taking place in the cell.
3.5. Short-term durability studies
A chronopotentiometric study was performed at 600 °C and 0.7 V for a total period of 24 hours in order to study the stability of cell A (as shown in Fig. 5a). The initial current density increase was related to activation polarization at the oxygen electrode. After 24 hours, no drop of current density was observed assuring that there was no degradation. This is confirmed by the j–V curve measured after the 24 h chronopotentiometric experiment. As observed in Fig. 5b, there is no apparent degradation in terms of current density. We have observed certain noise during the measurements, but this effect was associated with small electrical losses due to a poor contact between the Pt wire current collector and the sample (possibly due to Pt sintering).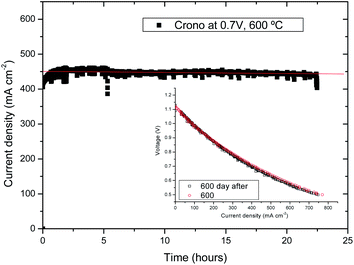 | ||
| Fig. 5 (a) Chronopotentiometry at 0.7 V and 600 °C for cell A; (inset) j–V curves before and after the chronopotentiometric study. | ||
3.6. Preliminary high temperature electrolysis studies
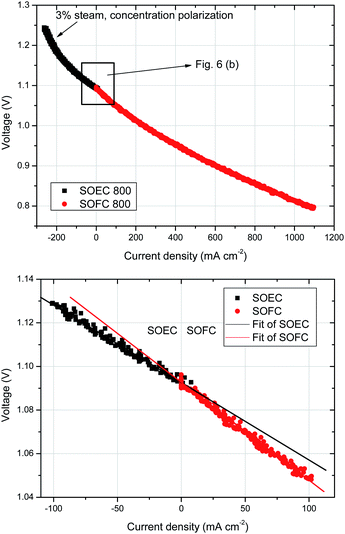
Preliminary SOEC studies were performed (cell A) using 3% steam in the fuel electrode chamber (Fig. 6a). As expected, concentration polarization was rapidly observed at current densities beyond 100 mA cm−2, due to the low steam content. However, when we analyse the slope of the j–V curves for both SOFC and SOEC at low current densities (Fig. 6b), we observe a slight enhancement of performance in SOEC mode in comparison with the same conditions in SOFC mode. Similar findings were previously reported for the NNO phase10 and LSCN (La1.7Sr0.3Co0.5Ni0.5O4.08).38 In electrolysis mode, there is an increase of pO2 at the oxygen electrode/electrolyte interface due to oxygen evolution. The hyperstoichiometry of some oxygen electrode materials such as the Ruddlesden-Popper phases is believed to be favourable for effective oxygen evolution, as performance of these electrodes is enhanced in SOEC mode.3.7. Post-mortem structural and microstructural analysis
XRD analysis was performed directly over the cathodes of cells A and B after the electrochemical studies. Cell A showed the presence of YSZ as the major phase besides, some Nd2NiO4 and the unreacted NiO phase, in a similar ratio as before the electrochemical tests (Fig. 7). In addition, Nd2O3 (cubic) and NdNiO3 have disappeared and the Ruddlesden-Popper Nd2NiO4 phase was formed due to further heating at 800 °C, while performing the electrochemical studies. We believe that the NdNiO3 to Nd2NiO4 transformation took place during the initial stage of the electrochemical experiments at 800 °C. XRD of the cell B cathode, which was exposed to 950 °C for 12 hours during the experiments, revealed the formation of the undesired Nd2Zr2O7 phase, resulting in the lower performance. It is worth noting that no Nd2NiO4 phase was detected following heat treatment at 950 °C, possibly due to its complete reaction with YSZ to form the non-conducting Nd2Zr2O7 phase. Pt peaks are also present in the pattern due to the current collector.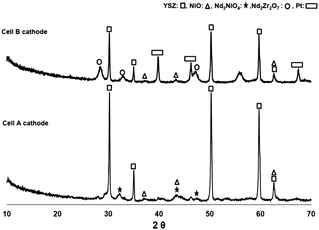 | ||
| Fig. 7 XRD pattern of Cell A and Cell B cathodes following heat treatment at 800 and 950 °C, respectively. Pt peaks are due to the current collector. | ||
The difference between the XRD patterns of the Nd–nickelate nitrate salt recipe (Fig. 2) and that of the cathode (Fig. 7) are associated with the presence of YSZ in the cathode. While formation of the Nd2NiO4 phase is enhanced at temperatures above 800 °C in the Nd–nickelate recipe (due to improved reaction of NiO and Nd2O3), it appears that the Nd–nickelate reacts with YSZ from the cathode and forms the undesired Nd2Zr2O7 phase. As previously shown in Section 3.2, annealing at 950 °C for shorter times (2 hours) does not lead to Nd2NiO4 decomposition. However, longer annealing times at 950 °C (12 hours) confirmed that Nd2NiO4 reacts with YSZ to form Nd2Zr2O7. Therefore, it seems that the ideal temperature for heat treatment of the infiltrated cathode should be between 800–850 °C using longer annealing times.
Post-mortem SEM observations are also consistent with XRD analysis. In Fig. 8 we can observe two polished transverse-cross sections of cells A and B. Both images were taken at low kV using an InLens detector in order to increase the contrast of the conductive phases. Anodes of both samples present a homogenous distribution of Ni particles. If we observe the cathode, cell A (Fig. 8a) presents a homogeneous distribution of conductive particles (due to the Nd2NiO4 and the Nd2O3 phases). However, conductive species can only be observed on top of the cathode for cell B (Fig. 8b) as there are no conductive phases at the cathode/electrolyte interface, due to the formation of the insulating Nd2Zr2O7 phase, previously detected by XRD analysis. Finally, Fig. 8c shows the microstructure at the NNO/YSZ cathode of cell A after operation. The fine particles of Nd–nickelate still show great connectivity and no apparent grain growth, in concordance with the short-term electrochemical results. Further experiments are also needed in order to understand the influence of the minority cathode Nd2O3 and NiO phases on the electrochemical behaviour of the cell.
4. Conclusions
Cathodes of porous YSZ supports infiltrated with NNO salt precursors are offered as an alternative solution for IT-SOFC cathodes. Maximum power densities of 0.4 W cm−2 at 600 °C were achieved, and no degradation was observed for up to 24 hours under current load, using the cell NiO–YSZ/YSZ/Nd2NiO4–Nd2O3–YSZ. As a HT-SOFC, a power density of 0.76 W cm−2 at 800 °C and 0.8 V was also realized. AC impedance analysis shows low polarization resistances for both anode and cathode, consistent with j–V studies, although a detailed analysis as a function of the gas partial pressures at the electrodes is needed in order to separate the different processes. The ideal temperature for heat treatment of the infiltrated cathode seems to be between 800 °C and 850 °C, since at 950 °C non-conducting Nd2Zr2O7 forms due to reaction of Nd2NiO4 and YSZ. This is confirmed by XRD and SEM images showing the formation of a porous non-conducting phase next to the electrolyte which interrupts ion and electron transfer. We believe that cell performance can be further increased upon optimization of the calcination procedure. Preliminary SOEC results showed slightly better performance in comparison with SOFC operation.Acknowledgements
The authors would like to acknowledge grants MAT2012-30763 financed by the Spanish Government (Ministerio de Ciencia e Innovación) and Feder program of the European Community, and also grant GA-LC-035/2012, financed by the Aragón Government and La Caixa Foundation for funding the project. The use of Servicio General de Apoyo a la Investigación-SAI, Universidad de Zaragoza is also acknowledged. The research carried out in Canada was supported through funding to the NSERC Solid Oxide Fuel Cell Canada Strategic Research Network from the Natural Sciences and Engineering Research Council (NSERC) and other sponsors listed at http://www.sofccanada.com. Finally, we acknowledge support of the publication fee by the CSIC Open Access Publication Support Initiative through its Unit of Information Resources for Research (URICI).Notes and references
-
S. C. Singhal and K. Kendall, High Temperature SOFCs: Fundamentals, Design and Applications, Elsevier, Oxford, UK, 2003 Search PubMed
.
- S. McIntosh and R. J. Gorte, Chem. Rev., 2004, 104, 4845 CrossRef CAS
.
- M. A. Laguna-Bercero, J. Power Sources, 2012, 203, 4 CrossRef CAS PubMed
.
- Z. Shao, W. Zhou and Z. Zhu, Prog. Mater. Sci., 2012, 57, 804 CrossRef CAS PubMed
.
- A. Aguadero, L. Fawcett, S. Taub, R. Woolley, K.-T. Wu, N. Xu, J. A. Kilner and S. J. Skinner, J. Mater. Sci., 2012, 47, 3925 CrossRef CAS
.
- A. Orera and P. R. Slater, Chem. Mater., 2010, 22, 675 CrossRef CAS
.
- A. Tarancón, M. Burriel, J. Santiso, S. J. Skinner and J. A. Kilner, J. Mater. Chem., 2010, 20, 3799 RSC
.
- S. J. Skinner and J. A. Kilner, Solid State Ionics, 2000, 135, 709 CrossRef CAS
.
- F. Mauvy, C. Lalanne, J.-M. Bassat, J.-C. Grenier, H. Zhao, L. Huo and P. Stevens, J. Electrochem. Soc., 2006, 153, A1547 CrossRef CAS PubMed
.
- F. Chauveau, J. Mougin, J. M. Bassat, F. Mauvy and J. C. Grenier, J. Power Sources, 2010, 195, 744 CrossRef CAS PubMed
.
- E. Boehm, J.-M. Bassat, P. Dordor, F. Mauvy, J.-C. Grenier and P. Stevens, Solid State Ionics, 2005, 176, 2717 CrossRef CAS PubMed
.
- R. Sayers, J. Liu, B. Rustumji and S. J. Skinner, Fuel Cells, 2008, 8, 338 CrossRef CAS
.
- G. Amow, P. S. Whitfield, I. J. Davidson, R. P. Hammond, C. N. Munnings and S. J. Skinner, Ceram. Int., 2004, 30, 1635 CrossRef CAS PubMed
.
- A. Montenegro-Hernández, J. Vega-Castillo, L. Mogni and A. Caneiro, Int. J. Hydrogen Energy, 2011, 36, 15704 CrossRef PubMed
.
- T. Z. Sholklapper, C. P. Jacobson, S. J. Visco and L. C. De Jonghe, Fuel Cells, 2008, 8, 303 CrossRef CAS
.
- S. P. Jiang, Mater. Sci. Eng., A, 2006, 418, 199 CrossRef PubMed
.
- J. M. Vohs and R. J. Gorte, Adv. Mater., 2009, 21, 943 CrossRef CAS
.
- S. P. Jiang, Int. J. Hydrogen Energy, 2012, 37, 449 CrossRef CAS PubMed
.
- Z. Liu, B. Liu, D. Ding, M. Liu, F. Chen and C. Xia, J. Power Sources, 2013, 237, 243 CrossRef CAS PubMed
.
- Y. Huang, J. M. Vohs and R. J. Gorte, J. Electrochem. Soc., 2005, 152, A1347 CrossRef CAS PubMed
.
- A. Torabi, A. R. Hanifi, T. H. Etsell and P. Sarkar, J. Electrochem. Soc., 2012, 159, B201 CrossRef CAS PubMed
.
- T. Z. Sholklapper, V. Radmilovic, C. P. Jacobson, S. J. Visco and L. C. De Jonghe, Electrochem. Solid-State Lett., 2007, 10, B74 CrossRef CAS PubMed
.
- T. Z. Sholklapper, C. Lu, C. P. Jacobson, S. J. Visco and L. C. De Jonghe, Electrochem. Solid-State Lett., 2006, 9, A376 CrossRef CAS PubMed
.
- A. R. Hanifi, A. Torabi, M. Zazulak, T. H. Etsell, L. Yamarte, P. Sarkar and M. Tucker, ECS Trans., 2011, 35, 409 CAS
.
- S. Choi, S. Yoo, J.-Y. Shin and G. Kim, J. Electrochem. Soc., 2011, 158, B995 CrossRef CAS PubMed
.
- K. S. Howe, G. J. Thompson and K. Kendall, J. Power Sources, 2011, 196, 1677 CrossRef CAS PubMed
.
- V. Lawlor, S. Griesser, G. Buchinger, A. G. Olabi, S. Cordiner and D. Meissner, J. Power Sources, 2009, 193, 387 CrossRef CAS PubMed
.
- V. Lawlor, J. Power Sources, 2013, 240, 421 CrossRef CAS PubMed
.
- R. Campana, R. I. Merino, A. Larrea, I. Villarreal and V. M. Orera, J. Power Sources, 2009, 192, 120 CrossRef CAS PubMed
.
- M. A. Laguna-Bercero, R. Campana, A. Larrea, J. A. Kilner and V. M. Orera, Fuel Cells, 2011, 11, 116 CrossRef CAS
.
- M. A. Laguna-Bercero, R. Campana, A. Larrea, J. A. Kilner and V. M. Orera, J. Electrochem. Soc., 2010, 6, B852 CrossRef PubMed
.
- M. A. Laguna-Bercero, A. Férriz, A. Larrea, L. Correas and V. M. Orera, Fuel Cells, 2013, 13, 1116 CrossRef CAS
.
- R. Chiba, F. Yoshimura and Y. Sakurai, Solid State Ionics, 1999, 124, 281 CrossRef CAS
.
- K. S. Howe, G. J. Thompson and K. Kendall, J. Power Sources, 2011, 196, 1677 CrossRef CAS PubMed
.
-
T. S. Zhao, Micro Fuel Cells: Principles and Applications, Elsevier, Academic Press, Burlington, London, Amsterdam, 2009 Search PubMed
.
- Q.-A. Huang, R. Hui, B. Wang and J. Zhang, Electrochim. Acta, 2007, 8, 144 Search PubMed
.
- H. Monzón, M. A. Laguna-Bercero, A. Larrea, B. I. Arias, A. Várez and B. Levenfeld, Int. J. Hydrogen Energy, 2014, 39, 5470 CrossRef PubMed
.
- M. A. Laguna-Bercero, N. Kinadjan, R. Sayers, H. El Shinawi, C. Greaves and S. J. Skinner, Fuel Cells, 2011, 11, 102 CrossRef CAS
.
| This journal is © The Royal Society of Chemistry 2014 |

