 Open Access Article
Creative Commons Attribution 3.0 Unported Licence
Effects of cationic substitution on structural defects in layered cathode materials LiNiO2
Hungru
Chen
*,
James A.
Dawson
and
John H.
Harding
Department of Materials Science and Engineering, University of Sheffield, S1 3JD, UK. E-mail: chen.hungru@nims.go.jp
First published on 8th April 2014
Abstract
The electrochemical properties of layered rock salt cathode materials are strongly influenced by defects. The three most common defects in LiNiO2-based compounds, namely extra Ni, Li–Ni anti-site and oxygen vacancy defects have been investigated. The calculated defect formation energies are very low in LiNiO2, consistent with the difficulty in synthesizing stoichiometric defect-free LiNiO2. A systematic study is conducted to examine the effect of Co, Mn and Al substitution on defect formation. It is shown that the presence of Ni2+ in the Li layer can be rationalized using ideas of superexchange interactions. In addition, a correlation between oxygen vacancy formation energy and oxygen charge is noted. This explains the better thermal stability obtained by early transition metal or Al substitutions.
Introduction
Layered rock salt structure materials with the general formula LiMO2 (where M is a transition metal) have been studied intensively due to their applicability as cathode materials in lithium ion batteries. LiCoO2 is the prototype commercially used cathode. However, cobalt is toxic and expensive and therefore the search for replacements for cobalt-based cathodes has lasted for decades. LiNiO2 is one of the potential cathode materials for lithium ion batteries. Although this compound has been studied for many years, the electronic, magnetic and local structures are still highly controversial.1,2Experimentally it is not yet possible to synthesize perfect, stoichiometric LiNiO2. A certain fraction of extra nickel ions occupy the lithium sites making the true formula of the material [Li1−xNix]NiO2 (ref. 3) (this is referred to hereafter as extra Ni defects on the Li site). A recent theoretical study on LiNiO2 also predicts an unavoidable high concentration of Ni present in the Li layers at high temperature.4 Besides, 11% of Li–Ni interlayer mixing (cation exchange between Li and Ni in the expected layered structure) is reported to occur in the LiNiO2-based material LiNi1/2Mn1/2O2 and 6% in LiNi1/3Mn1/3Co1/3O2.5,6 The presence of Ni in the Li layers has a detrimental effect on the electrochemical performance of the material as a cathode. First, it disrupts the lithium diffusion by blocking the diffusion pathways.7 Second, it has been suggested that the presence of nickel in the lithium layer is responsible for first-cycle irreversibility.8–10 During the first charge, the Ni2+ ions at Li sites are oxidized to smaller Ni3+ ions. This causes a local shrinkage around those nickel ions and therefore it is difficult to insert lithium ions back into the positions around them.
Oxygen loss is another issue in layered cathode materials. A recent study on LiNi0.8Mn0.1Co0.1O2−δ demonstrated that up to ∼12% oxygen loss occurs depending on the synthesis conditions and that there is a strong correlation between oxygen content and electrochemical performance.11 Delithiated Li1−xNiO2 is not thermally stable. It undergoes a phase transition accompanied by oxygen evolution. It has been shown that the extent of oxygen evolution increases as x increases.12 This irreversible structural change is concomitant with oxygen loss and maybe responsible for the observed capacity fading.13,14
In order to improve the electrochemical performance of LiNiO2, the strategy of partial substitution of Ni by other metal cations has been deployed. It is known that Co substitution gives better 2-D layered character. For LiNi1−xCoxO2 with x > 0.3, nickel is no longer present in the lithium layer.15 As a result, the irreversibility seen at the first-cycle mentioned above disappears. By contrast, the interlayer mixing increases with Mn doping.16 Nevertheless, LixNi0.5Mn0.5O2 exhibits excellent structural stability against oxygen loss17 at low Li content and therefore better safety. Al doping improves the thermal stability although Ni is still found in the Li layer.18,19 Cycling tests show that 10% Al suppresses all the phase transitions observed for the LixNiO2 system.19
Although the properties produced by partial cationic substitution are well studied, the reasons why these foreign dopants produce them are not clear. In this study, first-principles calculations are performed to investigate the structural defects of Li–Ni anti-site, extra Ni and oxygen vacancy in LiNiO2 and the effect of Ni substitution by Co (LiNi0.5Co0.5O2), Al (LiNi0.5Al0.5O2) and Mn (LiNi0.5Mn0.5O2). The same structural defects in NaNiO2 and LiCoO2 are also calculated for comparison.
Defect formation energies
In this study, we consider the presence of extra Ni in the Li layers, the Li–Ni interlayer mixing and the oxygen loss as point defects in the supposedly perfect layered LiMO2. The extra Ni defect can be considered as occurring through the following defect reactionSimilarly the interlayer mixing defect occurs through the reaction
In this work we define defect formation energies as the formation enthalpies of the above defect reactions at 0 K. Two assumptions are made here. First, in solid phases the volume term can be neglected and therefore the enthalpy corresponds to the internal energy. Second, defects are assumed to distribute evenly in the crystal. In the case of extra Ni defects in LiNiO2, the defect formation energy per defect is then given as
Similarly the defect formation energy of interlayer mixing is
| E(interlayer mixing) = −E(perfect) + E(defective) |
The defect formation energy of oxygen vacancy is
For LiNiO2, the concentrations of Ni present in the Li layers and oxygen vacancies are reported to be a few percent and are far beyond the dilute limit. However by an appropriate choice of the supercell size, the correct defect concentration can be simulated by substitution of the appropriate number of defects in the cell.
Computational approach
In this study, first-principles calculations are performed to investigate the structural defects of interlayer mixing, extra Ni and oxygen vacancy in layered LiNiO2 and the effect of Ni substitution by Co (LiNi0.5Co0.5O2), Al (LiNi0.5Al0.5O2) and Mn (LiNi0.5Mn0.5O2). The structural defects in layered NaNiO2 and LiCoO2 are also calculated for comparison.All calculations are based on Density Functional Theory (DFT) in combination with the projector augmented wave (PAW) method.20 The generalized gradient approximation (GGA) is used with the Perdew–Burke–Ernzerhof functional21 and a Hubbard model U correction22 is incorporated for the d electrons to give a better description of this strongly correlated system. The U parameters used for Ni, Co and Mn are 6.5, 4.9 and 4.5 eV, respectively. These parameters are adapted from a self-consistent calculation.23 The plane wave energy-cutoff is set to 500 eV. For all cells, the k-point spacing is less than 0.05 Å−1 in the Brillouin zone. Structural optimizations were performed until the residual force acting on each ion was less than 0.01 eV A−1. All calculations were carried out using the Vienna ab initio simulation package (VASP).24
For the calculation of perfect layered LiNiO2, a possible ground state cell with space group symmetry P21/c is used as the starting structure.2 In this P21/c cell the Jahn–Teller distortions of Ni3+ in the NiO2 slab are in a zigzag ordering. For calculations of layered LiNi0.5Co0.5O2, LiNi0.5Al0.5O2 and LiNi0.5Mn0.5O2 the two simplest in-plane cation orderings, linear and zigzag orderings, are considered as shown in Fig. 1. Supercells with 32 formula units containing 128 atoms are used in all defect calculations. The interlayer mixing defects and extra Ni defects in such a supercell correspond to a concentration of 3.125%, which is well within the experimentally reported range of defect concentration in LiNiO2. Therefore the size of the cell is adequate for simulating the observed defects in LiNiO2 and there is no need for extrapolation to the infinite limit.
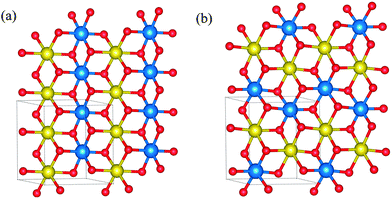 | ||
| Fig. 1 (a) Linear and (b) zigzag ordering of cations. Red denotes oxygen, blue and yellow denote the two different cations. Lithium is omitted for clarity. | ||
The interlayer mixing defect in layered AMO2 (A = Li, Na) is constructed by swapping one Ni (Co in the LiCoO2 case) in the MO2 slab with the nearest A ion. The extra Ni defect is constructed by replacing one A ion by Ni in the supercell. The oxygen vacancy defect is constructed by removing one oxygen atom from the supercell.
Results and discussion
Properties of undoped compounds
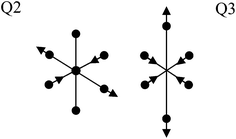
Before proceeding to the defect structure calculations, the crystal and electronic structures of perfect LiNi0.5Co0.5O2, LiNi0.5Al0.5O2 and LiNi0.5Mn0.5O2 are first determined. In LiNi0.5Co0.5O2 and LiNi0.5Al0.5O2 the linear ordering of cations with space group symmetry P2/m is found to be more energetically favorable than the zigzag ordering and is therefore used for subsequent defect calculations. In LiNi0.5Mn0.5O2, the zigzag ordering of Ni and Mn with space group symmetry P2/c is energetically more favorable, in agreement with a previous theoretical study.25Fig. 2 shows the calculated density of states for each material. The insulating behaviour of these compounds is well reproduced with band gaps of about 0.7 eV, 0.9 eV and 1.1 eV for LiNi0.5Co0.5O2, LiNi0.5Al0.5O2 and LiNi0.5Mn0.5O2, respectively. The local density of states (DOS) of Ni in LiNi0.5Co0.5O2 shows one empty spin-up and two empty spin-down states which indicates that the electronic configuration of Ni is t62ge1g (S = 1/2), which is low-spin Ni3+, in accordance with the calculated magnetic moment 1.12 μB. A Jahn–Teller distortion occurs as expected for low-spin Ni3+ as shown from the Ni–O bond lengths in Table 1. Cobalt ions are therefore anticipated to be Co3+ for the sake of charge neutrality. Indeed the empty spin-up and empty spin-down states from the local density of states of cobalt indicate that its electronic configuration is t62ge0g (S = 0) implying low-spin Co3+, along with its calculated zero magnetic moment. Likewise, nickel ions are determined to be low spin Ni3+ in LiNi0.5Al0.5O2 with a Jahn–Teller distortion. Nevertheless, from the Ni3+–O bond lengths in Table 1, it is clear that Ni3+ displays two different modes of Jahn–Teller distortion, Q2 and Q3 in LiNi0.5Co0.5O2 and LiNi0.5Al0.5O2 respectively, as shown in Fig. 3. The Q3 mode of Jahn–Teller distortion is the one observed in LiNiO2.26 In LiNi0.5Co0.5O2, the low-spin Co3+ ions are very stable in the isotropic octahedral environment with 6 identical Co3+–O2− bond lengths. The structural constraint imposed by the presence of rigid Co3+ octahedra makes the more distorted Q3 mode less favourable and results in the Q2 mode for distorted Ni3+. This result is in agreement with an EXAFS study that in LiNi1−yCoyO2 the Jahn–Teller distortion of NiO6 octohedra is suppressed with increasing y.27 In LiNi0.5Mn0.5O2, two empty spin-down eg states seen in the local density of states of nickel and fully-occupied spin-down t2g states seen in the local density of states of manganese indicate that their electronic configurations are t62ge2g and t32ge0g corresponding to Ni2+ and Mn4+, in agreement with previously reported results.28
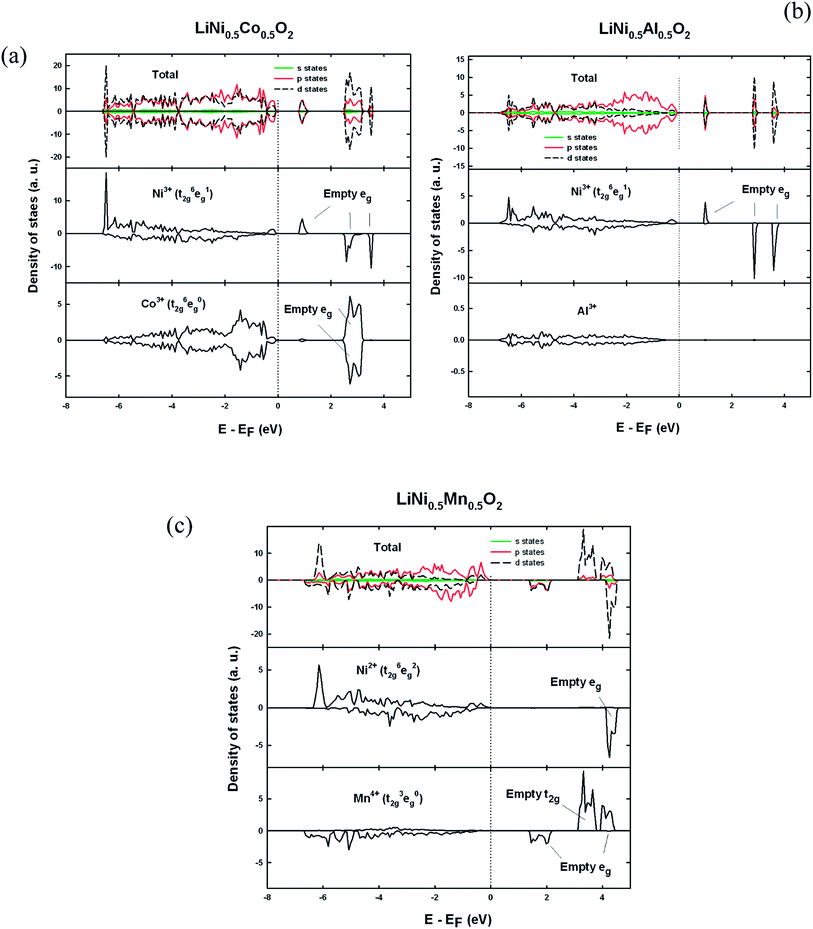 | ||
| Fig. 2 Total density of states and local density of states on metal ions for (a) LiNi0.5Co0.5O2, (b) LiNi0.5Al0.5O2 and (c) LiNi0.5Mn0.5O2. | ||
| LiNi0.5Co0.5O2 | LiNi0.5Al0.5O2 | LiNi0.5Mn0.5O2 | |||
|---|---|---|---|---|---|
| Bond length (Å) | Bond length (Å) | Bond length (Å) | |||
| Ni3+–O | 1.88 × 2 | Ni3+–O | 1.91 × 2 | Ni2+–O | 2.06 × 2 |
| 1.95 × 2 | 1.92 × 2 | 2.08 × 2 | |||
| 2.08 × 2 | 2.11 × 2 | 2.09 × 2 | |||
| 〈Ni3+–O〉 | 1.97 | 〈Ni3+–O〉 | 1.97 | 〈Ni2+–O〉 | 2.08 |
| Co3+–O | 1.94 × 6 | Al3+–O | 1.90 × 2 | Mn4+–O | 1.92 × 2 |
| 1.93 × 2 | 1.95 × 2 | ||||
| 1.96 × 2 | 1.98 × 2 | ||||
| 〈Co3+–O〉 | 1.94 | 〈Al3+–O〉 | 1.93 | 〈Mn4+–O〉 | 1.95 |
Influence of defect formation on cation charge state
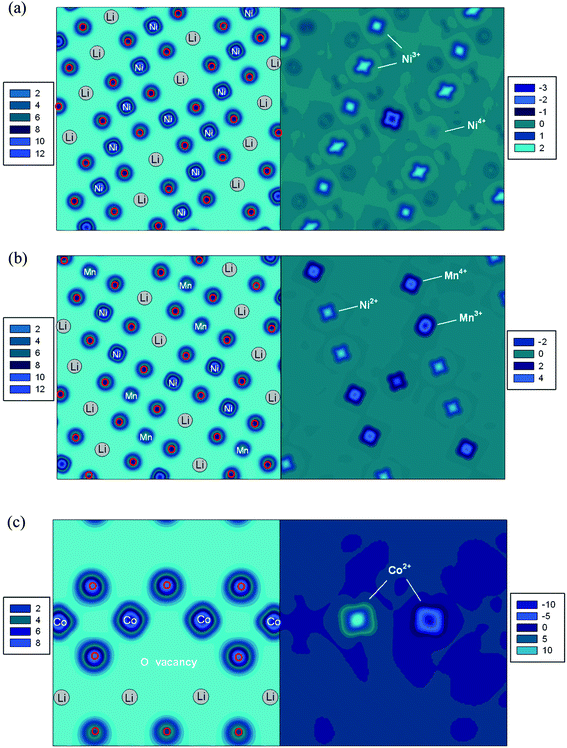
In all LiMO2 cells with extra Ni and interlayer mixing defects, the calculated magnetic moment of 1.7 μB (S = 1) for the Ni present in the Li layer along with its average Ni–O bond length 2.07 Å together imply that Nickel is present as Ni2+. Therefore in the LiNiO2, LiNi0.5Co0.5O2 and LiNi0.5Al0.5O2 cells with the interlayer mixing defect, in order to retain charge neutrality one Ni in the NiO2 slab is oxidised from Ni3+ to Ni4+ with a calculated magnetic moment 0.19 μB (S = 0), as seen in the spin density contour map in Fig. 4(a), and the average Ni–O bond length of 1.89 Å. In the LiNi0.5Mn0.5O2 cell, the interlayer mixing defect does not cause any change of charge state as nickel ions are already Ni2+.In cells with the extra Ni defect, since one Li+ is replaced by Ni2+, one metal ion in the MO2 layer must be reduced to maintain charge neutrality. In the LiNiO2, NaNiO2, LiNi0.5Co0.5O2 and LiNi0.5Al0.5O2 cells, it is the Ni in the MO2 layer that gets reduced from Ni3+ to Ni2+ with a calculated magnetic moment of 1.7 μB (S = 0) and an average Ni–O bond length of 2.07 Å. The change of preferred charge state on Ni rather than Co in LiNi0.5Co0.5O2 is probably due to the relatively stable electronic configuration of Co3+ (t62ge0g). In LiNi0.5Mn0.5O2, the charge state of Ni2+ cannot be reduced further and therefore the charge compensation accompanied by the extra Ni defect takes place on manganese with Mn4+ → Mn3+. Fig. 4(b) shows the case of the extra-Ni defect in LiNi0.5Mn0.5O2. The eg orbital character on Ni2+ (t62ge2g) can be seen from the shape of spin density pointing towards oxygen ions. Similarly, the spin density on Mn4+ (t32ge0g) pointing away from the oxygen represents the t2g orbital character. The Mn ion showing the different shape of spin density is the one that is reduced from Mn4+ to Mn3+.
For cells with the oxygen vacancy defect, two metal ions in the MO2 layer next to the oxygen vacancy site are reduced to keep the charge neutrality. Fig. 4(c) clearly shows that two Co3+ ions are reduced to Co2+ upon the removal of one oxygen ion.
Stability of defects and the effect of cation substitution
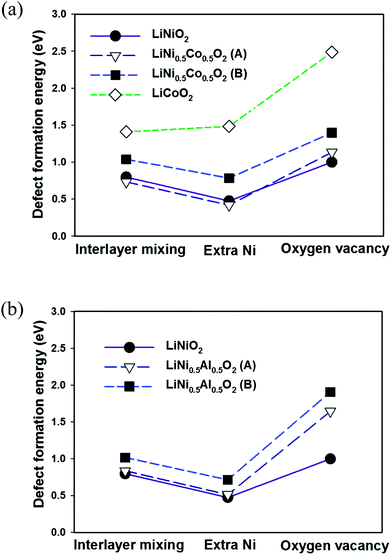
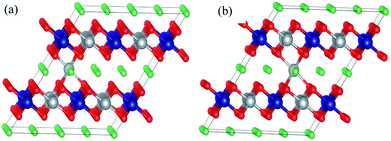
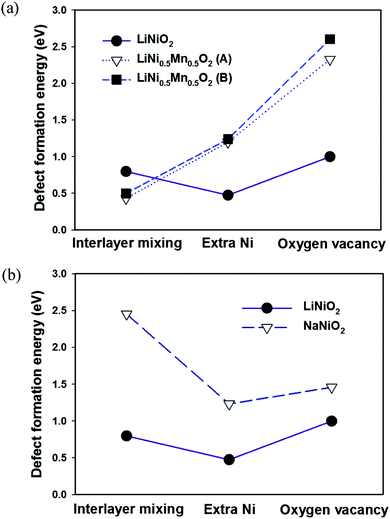
The calculated defect formation energies in LiNiO2 are shown in Fig. 5. The calculated formation energies of the three defects in LiNiO2 are all small, ranging from approximately 0.3 to 1.0 eV. This is consistent with the difficulty in synthesizing stoichiometric defect-free LiNiO2. It is possible to rationalize these results using the idea of superexchange interactions.29–31 Both Ni2+(t62ge2g) and Ni3+(t62ge1g) have fully filled t2g states but partially filled eg states. Consequently the 180° Ni–O–Ni superexchange is much stronger than the 90° Ni–O–Ni superexchange plus direct exchange. This means there is a larger energy gain through orbital interactions when Ni–O–N is in the 180° configuration than the 90° configuration. In fact it has been shown that there is a tendency for Ni ions to locate as second-nearest neighbors (180° Ni–O–Ni configuration) in the cation sublattice of the rocksalt structure due to the energy gain from the 180° superexchange interaction.32 Therefore the presence of Ni ions in the Li layers of LiNiO2 can be viewed as being stabilized by the 180° Ni–O–Ni superexchange interaction, giving rise to low formation energies for both interlayer mixing and the extra Ni defects. However, the extra Ni defect is the most favorable and therefore is the predominant defect species in LiNiO2.In LiNi0.5Co0.5O2 and LiNi0.5Al0.5O2, due to the linear cation ordering in the transition metal plane, there are two inequivalent Li sites on which to place the Ni in the interlayer mixing and the extra Ni defects, as shown in Fig. 6. These are referred to as configurations A and B. In LiNi0.5Mn0.5O2, the zigzag ordering of Ni and Mn also results in two inequivalent Li sites referred to as A and B. Similarly in the cells of LiNi0.5Co0.5O2, LiNi0.5Al0.5O2 and LiNi0.5Mn0.5O2, there are two inequivalent oxygen ions, one bonding with two Ni and one bonding with one Ni, in the cell, which can be removed to create the oxygen vacancy. We refer to the removal of the oxygen bonded to two Ni as configuration A and the removal of the oxygen bonded to only one Ni as configuration B.
The effect of Co substitution can be seen in Fig. 5(a). It is first noted that the defect formation energies of the interlayer mixing and the extra Ni defects in LiNi0.5Co0.5O2 with configuration A are lower than in LiNiO2. This is unexpected since it is known experimentally that Co substitution in LiNiO2 suppresses the presence of Ni in the Li layer. Nevertheless the formation energies of the interlayer mixing and extra Ni defects are higher in configuration B than configuration A by about 300 meV and 360 meV respectively. The result can also be rationalized by considering superexchange interactions. As seen in Fig. 6(a), in configuration A, the Ni in the Li layer forms six 180° Ni–O–Ni chains. In configuration B, the six 2nd-nearest-neighbours in the cation sublattice, of the Ni in the Li layer are Co3+, forming 180° Ni–O–Co chains which do not give rise to the 180° superexchange interaction due to the empty eg orbitals of Co3+ (t62ge0g). This again suggests that the presence of Ni2+ in the Li layer is stabilized by the 180° Ni–O–Ni superexchange interaction. The higher number of the 180° Ni–O–Ni chains gives rise to the lower energy. In the real LiNi0.5Co0.5O2 compound, the Co3+ ions distribute randomly in the MO2 slab and the main effect of cobalt substitution would be to screen the 180° Ni–O–Ni superexchange interaction. This is different from a previous proposed size effect,15 and destabilizes the presence of Ni in the Li layer.
The defect formation energies in LiCoO2 are also shown in Fig. 5(a). The defect energies of the interlayer mixing defect and the extra Co defect are considerably higher than the Ni containing compounds. This agrees with the experimentally observed perfect layering of LiCoO2. Given the closed-shell d6(t62ge0g) electronic configuration of Co3+ in the CoO2 layer, there is no interaction between Co ions that can stabilize the presence of Co in the Li layer.
Since there are no d electrons in the Al3+ ion, there can be no superexchange interaction between Al3+ and Ni2+. The effect of Al substitution on defect formation energies is therefore expected to be similar to that of Co substitution since Al substitution should also effectively screen the Ni–O–Ni superexchange interaction. Indeed by adopting the linear cation ordering in the LiNi0.5Al0.5O2 cell (Fig. 1(a)), as shown in Fig. 5(b) the calculated formation energies of the interlayer mixing and the extra Ni defects are very similar to those in LiNi0.5Co0.5O2. Defects of configuration A are also more favourable than configuration B due to the stabilisation by the exchange interaction. However, unlike in LiNi1−xCoxO2 with x > 0.3, neither the interlayer mixing defect nor extra Ni defects are observed.15 Experimentally 5% of extra-nickel ions are still found in the lithium layer in LiNi1−xAlxO2 with 0.1 < x < 0.5.19 This is because Al tends to segregate to interfaces33 and hence a core–shell structure can be formed34 in LiNi0.5Al0.5O2. Consequently, the extra-Ni and Li–Ni anti-site defects can still occur in Ni-rich domains in LiNi0.5Al0.5O2 as in LiNiO2, where the presence of Ni in the Li layer can be stabilized by the 180° Ni–O–Ni exchange interaction.
As shown by Fig. 7(a) there is no significant difference in configurations A and B for the formation energy of the interlayer mixing and the extra Ni defects in LiNi0.5Mn0.5O2. The formation energy of the interlayer mixing is markedly lower than that of the extra-Ni defect. This is consistent with the experimentally observed high concentration of interlayered mixing defects in LiNi0.5Mn0.5O2. Also the formation energy of the interlayer mixing defect is lower by about 0.3 eV than that of LiNiO2. Unlike in LiNi0.5Co0.5O2 and LiNi0.5Al0.5O2 where the 180° Ni–O–Co and 180° Ni–O–Al interactions are absent, in LiNi0.5Mn0.5O2 the electronic configuration of Mn4+ (t32ge0g) could give rise to moderate 180° Ni2+–O2−–Mn4+ interactions.31 Consequently, although the number of 180° Ni–O–Ni interactions is reduced due to Mn substitution, the presence of Ni2+ can be stabilized not only by the 180° Ni–O–Ni interaction but also by the 180° Ni2+–O2−–Mn4+ interaction. Moreover, since the ionic radius of Ni2+ is similar to Li+, these ions can exchange sites readily without significant rearrangement of the surrounding atomic positions. No charge compensation is necessary to create the interlayer mixing defect in LiNi0.5Mn0.5O2. In contrast to the interlayer mixing defect, the defect formation energy for the extra Ni defect is much higher in LiNi0.5Mn0.5O2 compared to LiNiO2. The probable reason for this is that the reduction of Mn4+ to Mn3+, which is the charge compensation accompanying the extra-Ni defect, is considerably less favorable than the reduction of Ni3+ to Ni2+ due to the stable electronic configuration of Mn4+ (t32ge0g).
In NaNiO2, there is a structural constraint arising from the large ionic size of Na+. It is shown in Table 2 that the LiO6 octahedron must undergo significant distortion for the zigzag ordering of the Ni3+ Jahn–Teller distortions or charge disproportionation Ni3+ → Ni2+ + Ni4+ in the NiO2 layer to happen. However, the larger Na+ ion fills up the interlayer space and so forbids the zigzag ordering of the Ni3+ Jahn–Teller distortions or charge disproportionation Ni3+ → Ni2+ + Ni4+ in the NiO2 layer. Hence the Ni3+ Jahn–Teller distortions in NaNiO2 are forced to align collinearly as observed experimentally, which results in undistorted NaO6 octahedra. This gives a good 2-D layered character and is less susceptible to defects as shown by the high defect formation energies for NaNiO2 compared to LiNiO2 in Fig. 7(b). Because of the dramatic difference in ionic radii between Na and first-row transition metal ions, the size effect dominates the interactions between cations and consequently all NaMO2 form perfect layered structures.
| Structure | Li–O bond lengths (Å) |
|---|---|
| C2/m (collinear ordering of the Ni3+ Jahn–Teller distortions) | 2.11 × 4 |
| 2.13 × 2 | |
| P21/c (zigzag ordering of the Ni3+ Jahn–Teller distortions) | 2.04 × 2 |
| 2.10 × 2 | |
| 2.24 × 2 | |
| P2/c (charge disproportionation Ni3+ → Ni2+ + Ni4+) | 2.03 × 2 |
| 2.08 × 2 | |
| 2.19 × 2 |
Oxygen vacancy
Fig. 8 shows the calculated defect formation energies of the oxygen vacancy plotted against the oxygen charge calculated using the Bader analysis.35,36 The formal charge on oxygen is −2 in highly ionic compounds. However, in transition metal oxides, there is a considerable overlap between the oxygen 2p and metal 3d orbitals, particularly for late transition metals or metals with high charge states. This is reflected in the calculated oxygen charge as shown in Fig. 8, from left to right (LiAlO2 → LiNiO2 and LiCoO2 → Li0.5CoO2) the decrease of calculated oxygen charge is a consequence of the increase in overlap between oxygen 2p and metal ion 3d orbitals or equivalently greater metal–oxygen covalency. A correlation can be clearly seen between the formation energy of the oxygen vacancy defect and the calculated oxygen charge. Also, as shown in Fig. 5 and 7, in LiNi0.5Co0.5O2, LiNi0.5Al0.5O2 and LiNi0.5Mn0.5O2, the defect formation energy for removing the oxygen bonded to two Ni (configuration A) is lower than the oxygen bonded to one Ni (configuration B). The oxygen bonded to two Ni has a lower charge. The smaller the oxygen charge is, the easier it seems to be to remove the oxygen. It has previously been suggested that the strength of the metal–oxygen bond depends on the effective charge on oxygen.37 In addition when the charge on oxygen ions is low, there would be a tendency for them to form peroxide at the surface as suggested by Goodenough et al.38 and then dissociate through the following reaction:| 2(O2)2− = 2O2− + O2 |
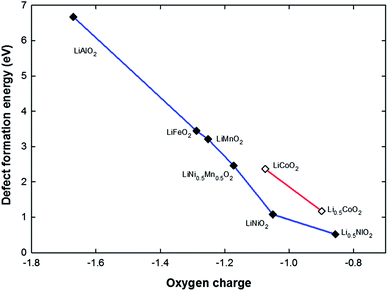 | ||
| Fig. 8 The correlation between oxygen charge and defect formation energy for an oxygen vacancy for a series of structures. | ||
This is consistent with experimental results that the temperature for oxygen evolution on heating (i.e. the thermal stability) decreases as x decreases in layered LixMO2.39–41 It seems that low oxygen charge/high metal–oxygen covalency causes the chemical instability of an oxide compound against oxygen loss. A recent study has also proposed that a greater metal–oxygen covalency promotes the surface oxygen evolution reaction which involves the creation of surface oxygen vacancies.42
On comparing LiNiO2 with LiCoO2 there is no noticeable difference in the oxygen charge, but the defect formation energy of the oxygen vacancy in LiCoO2 is significantly higher than in LiNiO2 (by ∼1.2 eV). This is probably due to the relatively stable electronic configuration of low-spin Co3+ t62ge0g. Therefore by creating an oxygen vacancy, it costs more energy to reduce Co3+ to Co2+ than to reduce Ni3+ to Ni2+ in LiNiO2. Although the defect formation energy of an oxygen vacancy in LiCoO2 is markedly higher than in LiNiO2, it drops drastically by ∼1.5 eV in Li0.5CoO2 upon the removal of half the lithium ions. This can again be explained by the decrease of oxygen charge that is associated with the creation of Co4+ ions.
Given this correlation between oxygen charge and the defect formation energy of the oxygen vacancy, doping with a more electro-positive cation should mitigate the oxygen loss in layered LixMO2 compounds and result in better thermal stability. Indeed doping with Mn4+ decreases the oxygen loss43 and so does Al or Mg doping,18,44,45 or Ti4+ substitution for Mn4+ in Li[Li0.33Mn0.67−xTix]O2.46
Conclusions
All the calculated formation energies for the various LiMO2 compounds are consistent with experimental results. It is demonstrated that the defect formation energies in LiNiO2 are low, in agreement with the experimental difficulty of synthesizing stoichiometric defect-free LiNiO2. The presence of Ni in the Li layer can be rationalized in terms of the 180° Ni–O–Ni superexchange interaction. Substituting Ni with Co in the MO2 layer screens the 180° Ni–O–Ni configurations and thus effectively reduces the concentration of Ni in Li layers. A correlation between the defect formation energy of the oxygen vacancy and oxygen charge (as measured from a Bader analysis) is reported. It appears that the smaller the oxygen charge/higher metal–oxygen covalency, the lower the oxygen vacancy formation energy. This can explain the thermal instability of LixCoO2 and LixNiO2 at low x, as well as the improved electrochemical behavior in Al, Mg or early transition metal doped LiMO2. In the quest for designing better cathode materials, the use of high electropositive cations is highly desirable.Acknowledgements
We thank EPSRC for funding under Grant number – EP/G005001/1. Via our membership of the UK's HPC Materials Chemistry Consortium, which is funded by EPSRC (EP/F067496), this work made use of the facilities of HECToR, the UK's national high-performance computing service, which is provided by UoEHPCx Ltd at the University of Edinburgh, Cray Inc and NAG Ltd, and funded by the Office of Science and Technology through EPSRC's High End Computing Programme.References
- J. H. Chung, T. Proffen, S. Shamoto, A. M. Ghorayeb, L. Croguennec, W. Tian, B. C. Sales, R. Jin, D. Mandrus and T. Egami, Phys. Rev. B: Condens. Matter Mater. Phys., 2005, 71(6), 064410 CrossRef.
- H. Chen, C. L. Freeman and J. H. Harding, Phys. Rev. B: Condens. Matter Mater. Phys., 2011, 84(8), 085108 CrossRef.
- R. Kanno, H. Kubo, Y. Kawamoto, T. Kamiyama, F. Izumi, Y. Takeda and M. Takano, J. Solid State Chem., 1994, 110(2), 216–225 CrossRef CAS.
- Y. Koyama, H. Arai, I. Tanaka, Y. Uchimoto and Z. Ogumi, Chem. Mater., 2012, 24, 3886 CrossRef CAS.
- S. Venkatraman and A. Manthiram, Chem. Mater., 2003, 15(26), 5003–5009 CrossRef CAS.
- J.-M. Kim and H.-T. Chung, Electrochim. Acta, 2004, 49(6), 937–944 CrossRef CAS PubMed.
- H. Arai, S. Okada, H. Ohtsuka, M. Ichimura and J. Yamaki, Solid State Ionics, 1995, 80(3–4), 261–269 CrossRef CAS.
- J. P. Peres, C. Delmas, A. Rougier, M. Broussely, F. Perton, P. Biensan and P. Willmann, J. Phys. Chem. Solids, 1996, 57, 1057–1060 CrossRef CAS.
- S. Zheng, R. Huang, Y. Makimura, Y. Ukyo, C. A. J. Fisher, T. Hirayama and Y. Ikuhara, J. Electrochem. Soc., 2011, 158(4), A357–A362 CrossRef CAS PubMed.
- C. Delmas, J. P. Pérès, A. Rougier, A. Demourgues, F. Weill, A. Chadwick, M. Broussely, F. Perton, P. Biensan and P. Willmann, J. Power Sources, 1997, 68(1), 120–125 CrossRef CAS.
- M. S. Idris and A. R. West, J. Electrochem. Soc., 2012, 159(4), A396–A401 CrossRef CAS PubMed.
- K.-K. Lee, W.-S. Yoon, K.-B. Kim, K.-Y. Lee and S.-T. Hong, J. Power Sources, 2001, 97–98, 321–325 CrossRef CAS.
- S. Muto, Y. Sasano, K. Tatsumi, T. Sasaki, K. Horibuchi, Y. Takeuchi and Y. Ukyo, J. Electrochem. Soc., 2009, 156(5), A371–A377 CrossRef CAS PubMed.
- L. Wu, K.-W. Nam, X. Wang, Y. Zhou, J.-C. Zheng, X.-Q. Yang and Y. Zhu, Chem. Mater., 2011, 23(17), 3953–3960 CrossRef CAS.
- A. Rougier, I. Saadoune, P. Gravereau, P. Willmann and C. Delmasa, Solid State Ionics, 1996, 90(1–4), 83–90 CrossRef CAS.
- E. Rossen, C. D. W. Jones and J. R. Dahn, Solid State Ionics, 1992, 57(3–4), 311–318 CrossRef CAS.
- N. Yabuuchi, Y.-T. Kim, H. H. Li and Y. Shao-Horn, Chem. Mater., 2008, 20(15), 4936–4951 CrossRef CAS.
- M. Guilmard, L. Croguennec, D. Denux and C. Delmas, Chem. Mater., 2003, 15(23), 4476–4483 CrossRef CAS.
- M. Guilmard, A. Rougier, M. Grüne, L. Croguennec and C. Delmas, J. Power Sources, 2003, 115(2), 305–314 CrossRef CAS.
- G. Kresse and D. Joubert, Phys. Rev. B: Condens. Matter Mater. Phys., 1999, 59(3), 1758 CrossRef CAS.
- J. P. Perdew, K. Burke and M. Ernzerhof, Phys. Rev. Lett., 1996, 77(18), 3865 CrossRef CAS.
- S. L. Dudarev, G. A. Botton, S. Y. Savrasov, C. J. Humphreys and A. P. Sutton, Phys. Rev. B: Condens. Matter Mater. Phys., 1998, 57(3), 1505–1509 CrossRef CAS.
- F. Zhou, M. Cococcioni, C. A. Marianetti, D. Morgan and G. Ceder, Phys. Rev. B: Condens. Matter Mater. Phys., 2004, 70(23), 235121 CrossRef.
- G. Kresse and J. Furthmüller, Phys. Rev. B: Condens. Matter Mater. Phys., 1996, 54(16), 11169–11186 CrossRef CAS.
- Y. Won-Sub, I. Steven, P. G. Clare, C. Dany, G. John, R. John and C. Gerbrand, Electrochem. Solid-State Lett., 2004, 7(7), A167–A171 CrossRef PubMed.
- A. Rougier, C. Delmas and A. V. Chadwick, Solid State Commun., 1995, 94(2), 123–127 CrossRef CAS.
- I. Nakai, K. Takahashi, Y. Shiraishi, T. Nakagome and F. Nishikawa, J. Solid State Chem., 1998, 140(1), 145–148 CrossRef CAS.
- J. Reed and G. Ceder, Electrochem. Solid-State Lett., 2002, 5(7), A145–A148 CrossRef CAS PubMed.
- J. B. Goodenough, Phys. Rev., 1960, 117(6), 1442–1451 CrossRef CAS.
- J. Kanamori, J. Phys. Chem. Solids, 1959, 10(2–3), 87–98 CrossRef CAS.
- J. B. Goodenough, Magnetism and the Chemical Bond, INTERSCIENCE (WILEY), 1963 Search PubMed.
- Y. Kumagai, A. Seko, F. Oba and I. Tanaka, Phys. Rev. B: Condens. Matter Mater. Phys., 2012, 85(1), 012401 CrossRef.
- L. Croguennec, Y. Shao-Horn, A. Gloter, C. Colliex, M. Guilmard, F. Fauth and C. Delmas, Chem. Mater., 2009, 21(6), 1051–1059 CrossRef CAS.
- X. Xu, K. Takada, K. Watanabe, I. Sakaguchi, K. Akatsuka, B. T. Hang, T. Ohnishi and T. Sasaki, Chem. Mater., 2011, 23(17), 3798–3804 CrossRef CAS.
- R. F. W. Bader, Atoms in Molecules: A Quantum Theory, Oxford University Press, 1990 Search PubMed.
- W. Tang, E. Sanville and G. Henkelman, J. Phys.: Condens. Matter, 2009, 21, 084204 CrossRef CAS PubMed.
- K. Tatsumi, Y. Sasano, S. Muto, T. Yoshida, T. Sasaki, K. Horibuchi, Y. Takeuchi and Y. Ukyo, Phys. Rev. B: Condens. Matter Mater. Phys., 2008, 78(4), 045108 CrossRef.
- J. B. Goodenough and Y. Kim, Chem. Mater., 2009, 22(3), 587–603 CrossRef.
- J. R. Dahn, E. W. Fuller, M. Obrovac and U. von Sacken, Solid State Ionics, 1994, 69(3–4), 265–270 CrossRef CAS.
- H. Konishi, T. Yuasa and M. Yoshikawa, J. Power Sources, 2011, 196(16), 6884–6888 CrossRef CAS PubMed.
- Y. Furushima, C. Yanagisawa, T. Nakagawa, Y. Aoki and N. Muraki, J. Power Sources, 2011, 196(4), 2260–2263 CrossRef CAS PubMed.
- J. Suntivich, K. J. May, H. A. Gasteiger, J. B. Goodenough and Y. Shao-Horn, Science, 2011, 334(6061), 1383–1385 CrossRef CAS PubMed.
- T. A. Arunkumar, E. Alvarez and A. Manthiram, J. Mater. Chem., 2008, 18(2), 190–198 RSC.
- A. D'Epifanio, F. Croce, F. Ronci, V. Rossi Albertini, E. Traversa and B. Scrosati, Chem. Mater., 2004, 16(18), 3559–3564 CrossRef CAS.
- H. Kondo, Y. Takeuchi, T. Sasaki, S. Kawauchi, Y. Itou, O. Hiruta, C. Okuda, M. Yonemura, T. Kamiyama and Y. Ukyo, J. Power Sources, 2007, 174(2), 1131–1136 CrossRef CAS PubMed.
- Z. Q. Deng and A. Manthiram, J. Phys. Chem. C, 2011, 115(14), 7097–7103 CAS.
| This journal is © The Royal Society of Chemistry 2014 |


