 Open Access Article
 This Open Access Article is licensed under a
 Creative Commons Attribution 3.0 Unported Licence
Preparation of radiation-grafted powders for use as anion exchange ionomers in alkaline polymer electrolyte fuel cells†
Simon D.
Poynton
a,
Robert C. T.
Slade
a,
Travis J.
Omasta
c,
William E.
Mustain
c,
Ricardo
Escudero-Cid
ab,
Pilar
Ocón
b and
John R.
Varcoe
*a
aDepartment of Chemistry, University of Surrey, Guildford, GU2 7XH, UK. E-mail: j.varcoe@surrey.ac.uk; Fax: +44 (0)1483 683010; Tel: +44 (0)1483 686838
bDepartamento de Quimica Fisica Aplicada, Universidad Autonoma de Madrid, Madrid, Spain
cDepartment of Chemical and Biomolecular Engineering, University of Connecticut, Storrs, USA
First published on 21st February 2014
Abstract
A novel alkaline exchange ionomer (AEI) was prepared from the radiation-grafting of vinylbenzyl chloride (VBC) onto poly(ethylene-co-tetrafluoroethylene) [ETFE] powders with powder particle sizes of less than 100 μm diameter. Quaternisation of the VBC grafted ETFE powders with trimethylamine resulted in AEIs that were chemically the same as the ETFE-based radiation-grafted alkaline anion exchange membranes (AAEM) that had been previously developed for use in low temperature alkaline polymer electrolyte fuel cells (APEFC). The integration of the AEI powders into the catalyst layers (CL) of both electrodes resulted in a H2/O2 fuel cell peak power density of 240 mW cm−2 at 50 °C (compared to 180 mW cm−2 with a benchmark membrane electrode assembly containing identical components apart from the use of a previous generation AEI). This result is promising considering the wholly un-optimised nature of the AEI inclusion into the catalyst layers.
Introduction
Alkaline polymer electrolyte fuel cells (APEFC) have received a considerable amount of attention in recent years as analogous alternatives to the more heavily investigated proton exchange membrane fuel cells (PEMFC).1–3 The higher pH of APEFCs facilitates the use of a range of non-precious metal catalysts (reducing the requirement for the expensive platinum catalysts that are typical in PEMFCs), especially at the cathode for the oxygen reduction reaction.4–6 Alkaline anion exchange membranes (AAEM) can also exhibit lower fuel permeabilities, compared to proton exchange membranes (PEM), when used in direct alcohol fuel cells.7 Additionally, the susceptibility to CO2-derived performance losses is perceived to be reduced with APEFCs compared to traditional aqueous electrolyte (KOH) alkaline fuel cells:8–11 this is thought to be especially the case when APEFCs are developed that can operate at 80 °C over long periods of time.The synthesis of anion exchange polymer electrolyte materials via radiation-grafting (RG, using either an electron beam (EB), UV, or γ-ray radiation) of pre-formed precursor polymer materials (available in industrial bulk quantities) have been widely reported. Irradiation leads to the formation of radicals or peroxy groups (when irradiated under inert atmosphere or air, respectively) that can be distributed throughout the thickness of the base polymer material (UV grafting tends to bias towards surface only functionalisation).12 RG generally uses vinyl-based monomers (such as vinylbenzyl chloride, VBC) and can involve a subsequent post-grafting functionalisation step (such as reaction of the CH2Cl groups of the VBC grafts with tertiary amine to form quaternary ammonium head groups that are capable of conducting anions, see Scheme 1).13–19
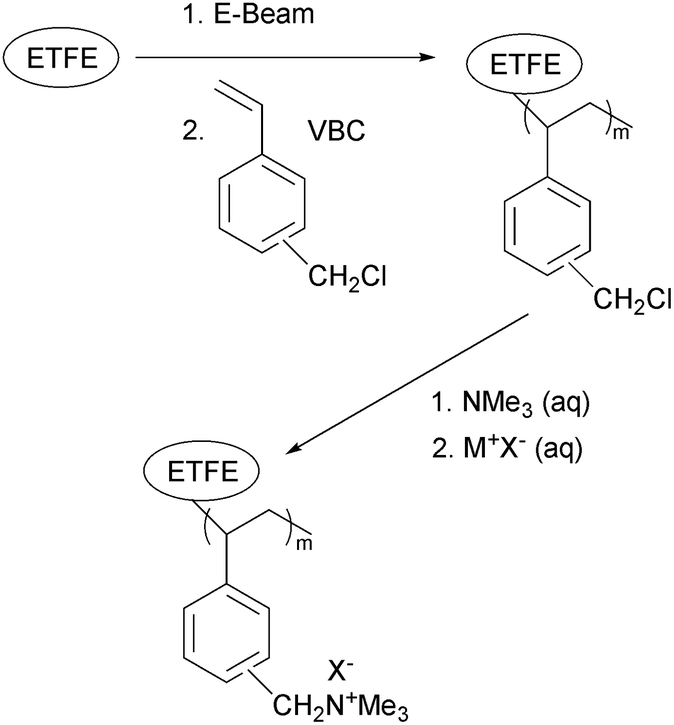 | ||
| Scheme 1 The preparation of AEIs and AAEMs via radiation-grafting of vinylbenzyl chloride onto precursor poly(ethylene-co-tetrafluoroethylene) [ETFE] and subsequent quaternisation with trimethylamine. | ||
The process of RG is not limited to the modification of thin films (a common process reported in the prior literature). Polymer powders have also been subjected to RG and chemical functionalisation (including for fabrication of fuel cell materials). A common approach is subjection of poly(vinylidene fluoride) (PVDF) powders to 60Co γ-radiation followed by grafting using monomers such as: styrene,20N,N-dimethylacrylamide,21 glycidyl methacrylate,22 a combination of acrylic acid and methacrylic acid,23 or a dimethylaminoethyl methacrylate-styrene mixture (to introduce amphoteric properties).24 Subsequently, these RG powders are typically manufactured into thin films either via a melt process or by dissolution in solvents (such as NMP) followed by a subsequent casting step. Thin film PEMs (for PEMFC application) have also been prepared from PTFE powders: the PTFE was initially subjected to EB radiation (up to 600 kGy under N2) to induce cross-linking and was then followed by a further step involving a second exposure to EB, grafting with styrene, and functionalisation with chlorosulfonic acid (to introduce sulfonic acid groups).25 The irradiation of ultra-high molecular weight polyethylene powder using 60Co has also been reported with subsequent grafting of either styrene26–28 or vinylbenzyl chloride (VBC).29 These non-fluorinated grafted powders were also manufactured into thin films (via a melt process) and post-graft functionalised with either chlorosulfonic acid or trimethylamine to yield PEMs and anion-exchange membranes (AEM) respectively.
In the known cases (detailed above) that involved RG of powders specifically for fuel cell application, the functionalised powders were all processed into thin films to be used as the ion exchange membranes. The use in fuel cells of the functionalised powders directly in the “particulate” form has not been reported: e.g. to formulate into a conductive ionomer coating within the electrocatalyst layer to extending the three phase boundary between reactant gases, electrocatalyst and electrolyte. Ionomers with an inherent functionality (e.g. DuPont Nafion® dispersions for PEMFCs or Tokuyama A3/A4-S™ anion-exchange ionomer (AEI) solutions for APEFCs), are typically supplied either dissolved or dispersed in a solvent.9,30,31 Additionally for APEFCs, a polymer such as poly(vinylbenzyl chloride) can be deposited in the catalyst layer (CL) and subsequently functionalised [e.g. by treatment with N,N,N′,N′-tetramethylhexane-1,6-diamine32 or trimethylamine (TMA)33] to form an AEI in situ.
Here we investigate the application of RG poly(ethylene-co-tetrafluoroethylene) [ETFE, –(CH2CH2)n(CF2CF2)m–] powders as an AEI concept for use in APEFCs. This process is amenable to bulk production of AEIs for supply to research collaborators and industrial concerns. As the incorporation of the AEI powders was far from optimised (see below), high power performances were not anticipated. However, surprisingly good performances were observed (verified in an independent laboratory†), which highlights the future potential with the use of RG powders in the development of high performance AEIs (especially if an optimised dispersion or solution can be formulated).
Experimental
Materials
ETFE powders (Z8820X, particle size specification 20–30 μm) were supplied by AGC Chemicals Europe (UK). Vinylbenzyl chloride monomer (VBC, mixture of 3- and 4-isomers, used without removal of inhibitors) was purchased from Dow Chemical (Germany). Surfadone LP-100 was obtained from ISPcorp (USA). Propan-2-ol and toluene were of reagent grade and supplied from Sigma-Aldrich (UK) while trimethylamine (TMA, 50%mass in water) was supplied from Acros Organics (UK). Pt/C electrocatalyst (Johnson Matthey HiSPEC 3000, 20%mass Pt on Vulcan carbon black) was purchased from Alfa Aesar (UK). The carbon paper electrodes used for fuel cell testing contained a micro-porous layer (MPL) on one side of a wet proofed (20%mass PTFE) carbon paper gas diffusion layer (GDL) and were purchased from Hesen (China): the MPL consisting of 1 mg cm−2 carbon powder with 20%mass PTFE as binder. All chemicals were used as received and deionised water was used throughout (resistivity = 18.2 MΩ cm).Synthesis of ETFE-g-poly(vinylbenzyl chloride) [ETFE-g-poly(VBC)]
The ETFE powders were irradiated in air to a total dose of 70 kGy (using a 4.5 MeV Dynamatron continuous d.c. electron-beam unit at Synergy Health, South Marston, UK), submerged in a pre-mixed solution of VBC, propan-2-ol, and Surfadone LP-100 (1.00![[thin space (1/6-em)]](https://www.rsc.org/images/entities/char_2009.gif) :3.95:0.05 volume ratio), purged with N2 for 2 h, and then sealed and heated for 72 h at 60 °C. The resultant ETFE-g-poly(VBC) grafted powder was then recovered by filtration, washed with toluene (to remove any excess VBC and homopolymer), and dried in a vacuum oven at 50 °C.
:3.95:0.05 volume ratio), purged with N2 for 2 h, and then sealed and heated for 72 h at 60 °C. The resultant ETFE-g-poly(VBC) grafted powder was then recovered by filtration, washed with toluene (to remove any excess VBC and homopolymer), and dried in a vacuum oven at 50 °C.
Synthesis of ETFE-g-poly(vinylbenzyltrimethylammonium chloride) [ETFE-g-poly(VBTMAC)]
The ETFE-g-poly(VBC) powders were submerged in aqueous TMA solution for 5 h at ambient temperature. The product was washed five times with water before being heated in (fresh) water for 18 h at 50 °C. The resulting ETFE-g-poly(VBTMAC) powders were washed a further 5× with water, dried in a vacuum oven at 40 °C for 5 day, and stored for later use.Characterisation
The Raman spectra of the powder samples were recorded on a Perkin Elmer System 2000 NIR/FT-Raman spectrometer at a power of 1400 mW with a resolution of 4 cm−1 and 128 scans. Thermal analysis was carried out on a Universal Instruments Q500 Thermogravimetric Analyser (TGA). Samples were heated from ambient temperature to 600 °C at a heating rate of 5 °C min−1 under an inert N2 gas flow. The particle size of the dehydrated ETFE-g-poly(VBTMAC) powder was measured by lightly pressing a dry aluminium scanning electron microscope (SEM) stub (thoroughly cleaned with acetone before use) onto the powder. A gold coating of 9 nm (prepared using 6 × 1.5 nm layers) was applied to the stub to reduce charging of the non-electrically conductive particles. A Jeol JMS 7100F SEM was used to image the AEI (analysed using ImageJ software).The ETFE-g-poly(VBTMAC) powder samples were immersed in aqueous KCl (1 mol dm−3) for 1 h (the solution was exchanged twice during this period to ensure all counter anions were ion-exchanged): the samples were subsequently thoroughly washed with water (at least 10 times) to remove excess KCl (to give metal-cation-free powders). The complete removal of excess Cl− anions was verified by testing the post-wash solutions with aqueous AgNO3 as a visual indicator. Samples of the ETFE-g-poly(VBTMAC) powder (now in the Cl− only form) were then soaked in N2 purged water for 24 h at ambient temperature. After recovery by filtration, excess surface water was then removed by dabbing with tissue and the hydrated masses (Mhdy) were then quickly recorded. The samples were then dried in the vacuum oven at 40 °C for 5 day before the dry masses (Mdry) were recorded. The gravimetric water uptakes (WU) were calculated (n = 4 samples) using eqn (1):
 | (1) |
The ion exchange capacities (IEC) were determined using the dried samples (in Cl− anion form) recovered from the WU measurements (above). The samples (known dried mass) were first immersed into 20 cm3 of aqueous NaNO3 (2 mol dm−3) solution for 24 h. The solutions were subsequently acidified with aqueous HNO3 (2 cm3, 2 mol dm−3) and titrated with standardised aqueous AgNO3 (0.0200 mol dm−3) solution. A Methrohm 848 Titrino Plus autotitrator equipped with a Ag Titrode was used for the titrations. The IEC (mmol g−1) was calculated from the end point (Ep, cm3, taken as the maxima in the first differential plot of the potential vs. volume data) using eqn (2):
 | (2) |
Fuel cell testing
A Jeol JMS 7100F SEM was used to image the GDE containing 15%mass AEI (electrocatalyst side). To aid identification of the AEI, elemental analysis of both Pt and F was conducted using a Noran system seven version 3.1. Ultradry SSD X-ray detector (EDX). For improved image clarity, a second piece of GDE (from the same electrode) was coated with a 3 nm Au layer to allow higher resolution images to be obtained. All images were captured at an angle of 45° to improve definition of surface morphology.
Fuel cell assembly and beginning of life testing
An in-house RG ETFE-based AEM (80 μm fully hydrated thickness with identical benzyltrimethylammonium functionality) was used for all fuel cell tests.34 The electrodes were initially immersed in water for 10 min to hydrate the AEI. During this hydration process (and subsequent conversion of the polymer electrolyte components of the MEA to the OH− form), no electrocatalyst or AEI particles were observed to wash off the electrode surface: this shows adequate adhesion of both of these components on the GDL for fuel cell testing (with both AEI mass loadings). All AEI-containing electrodes and AEMs were then immersed in aqueous KOH (1 mol dm−3) for 1 h (with two exchanges of KOH solution to ensure complete exchange) followed by a thorough washing with water (to remove excess KOH species).The GDEs and AAEM were then secured between two graphite plates (serpentine flow channels) to 5.5 N m torque with no prior hot-pressing of the MEA (i.e. the MEA was “hot-pressed” in situ). An 850e fuel cell test station (Scribner Associates, USA) was used for the testing: the fuel cell temperature was controlled at 50 °C. The H2 and O2 gas feeds were supplied to the anode and cathode respectively at flow rates = 400 cm3 min−1 and dew point temperatures = 50 °C (indirect determination of RH = 100%) and with no back-pressurisation. Relative fuel cell performance data (comparing different ionomers) were collected under potentiometric control with 10 mV s−1 sweep rates: polarisation curves are presented for the return sweep (from high current to open circuit voltage).
Results and discussions
AEI characterisation
AEIs were prepared from precursor ETFE powder using an analogous RG method to that previously employed to fabricate AAEMs from precursor ETFE films.34 The resultant ETFE-g-poly(VBTMAC) powders were yellow in colour (the initial ETFE powder was white and opaque). The FT-Raman spectra of the base ETFE powder, ETFE-g-poly(VBC) and functional ETFE-g-poly(VBTMAC) AEI powders are presented in Fig. 1. The spectrum of the precursor ETFE powder contained the widely reported CF2 bands at 1300 and 1324 cm−1 and a CH2 scissoring band at 1446 cm−1.35 The RG of VBC onto the ETFE powder introduced new bands including aromatic derived modes at 1002 and 1614 cm−1 and the highly diagnostic CH2Cl deformation band at 1271 cm−1.18 On quaternisation with TMA, the CH2Cl band at 1271 cm−1 disappeared (as expected) with new bands appearing at 760 and 1409 cm−1 (indicative of the presence of –N+Me3 groups).35,36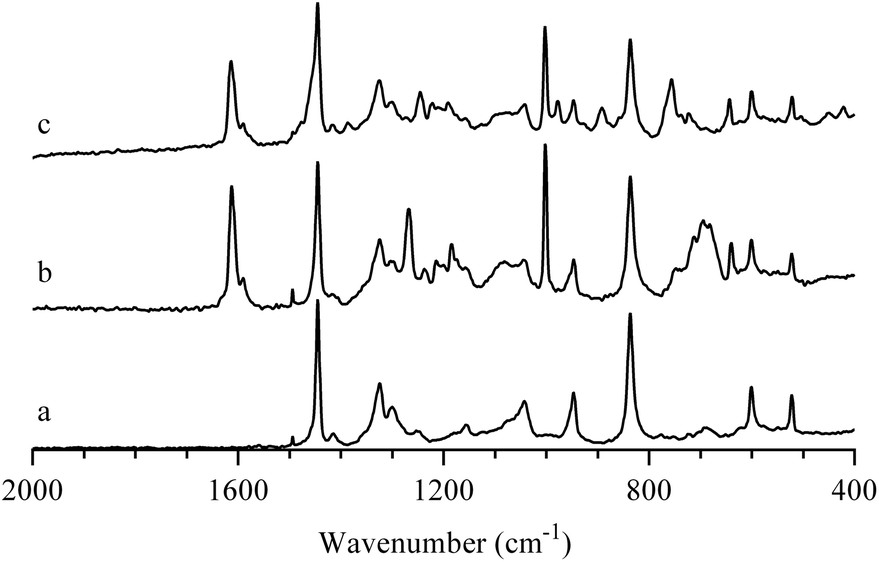 | ||
| Fig. 1 FT-Raman spectra of: (a) the precursor (non e−-beamed) ETFE powder, (b) the intermediate ETFE-g-poly(VBC) RG grafted powder, and (c) the final ETFE-g-poly(VBTMAC) AEI powder. The spectra were normalised to the peak at 1446 cm−1 for presentational purposes. The (spurious) peak at 1495 cm−1 is observed in all FT-Raman spectra (including in spectra recorded with an empty sample compartment):† this is an artefact of an aging Laser Line Filter in our instrument. | ||
The IEC of the AEI powder produced was 1.24 ± 0.06 meq g−1 (n = 4), which is only slightly lower to the IEC recorded when preparing AAEM from a 50 μm thick ETFE film (not powder) using an identical procedure [1.49 ± 0.02 meq g−1 (n = 3)]. The WU was simultaneously measured for the AEI(Cl−) samples: the measured values of 155.4 ± 1.8% were considerably larger compared to RG AAEMs prepared with similar IEC values (typical WUs in the range 30–65%).38 The higher experimental WU for the AEI powders was expected as a result of the increased surface area of the powder and, hence, the less rigorous and consistent removal of surface adsorbed water of the powder particles (compared to the thin film AAEMs). The high WU may not necessarily be detrimental to APEFC performance due to the pivotal importance of water for ion (including OH−) conduction: water is also a cathode reactant (2H2O + O2 + 4e− → 4OH−).
Thermogravimetric analyses (TGA) of the base ETFE powders, intermediate ETFE-g-poly(VBC) powders, and the final AEI powders (in both Cl− and OH− forms) are presented in Fig. 2. The precursor (non-irradiated) ETFE powder showed the expected simple thermal degradation curve, with a single decomposition step in the range 360–490 °C. The intermediate ETFE-g-poly(VBC) powder underwent multiple weight losses. The first step-like weight loss commenced at 280 °C and has previously been attributed to the decomposition of the vinylbenzyl chloride grafts.13 The final weight loss between 380 and 520 °C stems from the decomposition of the ETFE polymer backbone. The addition of the quaternary ammonium functionality in the AEI(Cl−) and AEI(OH−) powders introduces a mass loss step below 100 °C due to loss of residual water content (the powders were dried in the vacuum oven prior to measurement but were exposed to the atmosphere during TGA sample preparation). The decomposition of the quaternary ammonium group commenced at 150 °C for the Cl− form material (in good agreement with that observed previously),37 however, it was observed to initiate at a lower temperature (nearer 100 °C) for the OH− form. The next decomposition step now commences at the slightly higher temperature of 330 °C (for both counter-ions), while the final degradation step occurs above 425 °C: the degradation of the non-ETFE remnants and the ETFE component are starting to overlap.
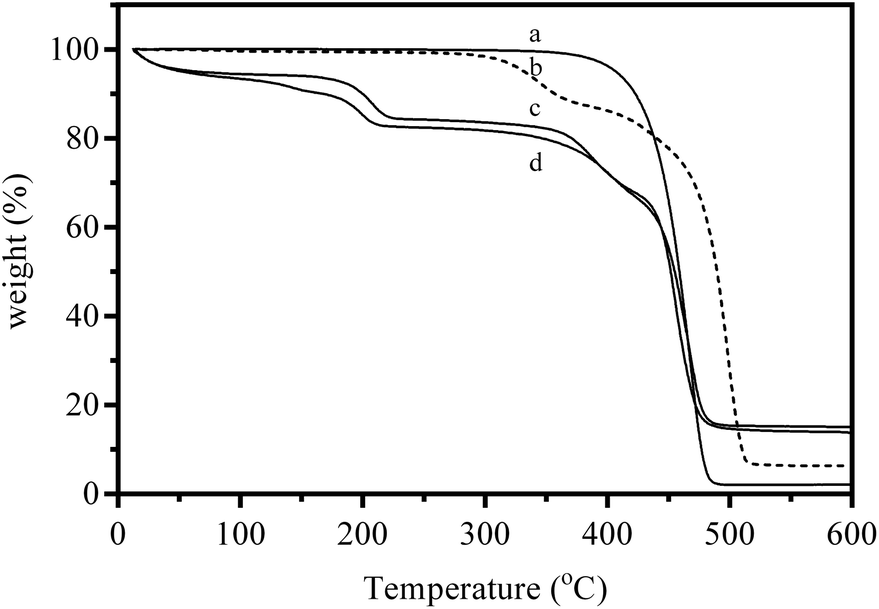 | ||
| Fig. 2 TGA traces under flowing N2 of (a) the precursor (non e−-beamed) ETFE powder, (b) the intermediate ETFE-g-poly(VBC) RG grafted powder, (c) the AEI(Cl−) powder, and (d) final AEI(OH−) powder. | ||
The difference in quaternary ammonium decomposition temperature for the two anions highlights both the greater susceptibility towards thermal degradation with this functional group in the presence of OH− ions (and the necessity to evaluate such functional groups in the counter-ion environment in which they will be used). The TGA results with the AEI powders give an indication of short-term thermal stabilities only (i.e. over the ca. 110 min of the experiment): this is not a comment on the long term in situ stabilities (more relevant to application in APEFCs).
The surface morphology of the AEI(Cl−) particles was observed using SEM. As presented in Fig. 3a, the particles were non-uniform in respect to both size and shape. A mean particle size of 24.5 ± 9.8 μm (sample population of n = 311) was measured for the dehydrated particles. A minimum and maximum particle size of 6 and 75 μm was observed in the sample of AEI studied using SEM. Visual inspection of the images of the surface of the particles reveal exteriors composed of irregular platelets with a small degree of internal porosity (Fig. 3b and c).
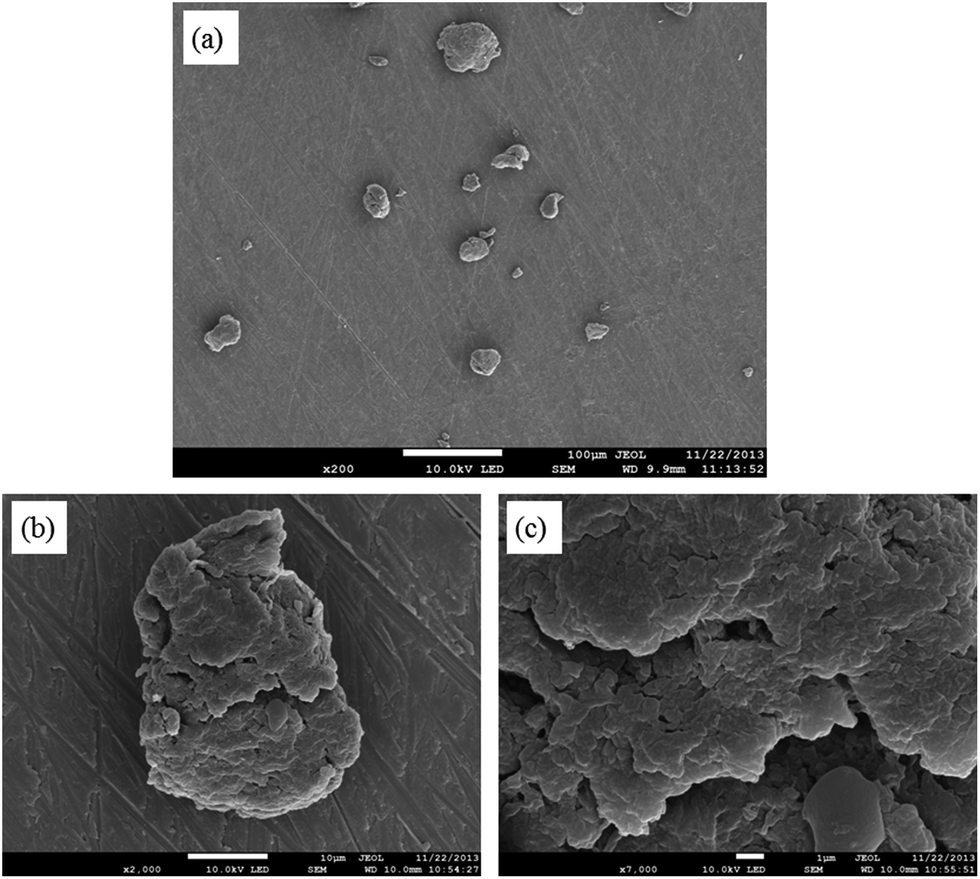 | ||
| Fig. 3 SEM images of the dehydrated AEI(Cl−) powder particles (9 nm Au coating). | ||
AEI incorporation into fuel cell electrodes
The application of the AEI(Cl−) into the catalyst layers was via formation of a sprayable “ink” containing the electrocatalyst, AEI, and solvent. SEM images of the GDE (catalyst layer) prepared with 15%mass AEI(Cl−) are presented in Fig. 4. Cracks on the surface of the GDE (that diverge in all directions) result from the drying of the solvent (propan-2-ol and water) under ambient conditions. Distinct, isolated AEI particles are randomly distributed across the surface of the GDE. A proportion of these particles are visibly lying below a layer of electrocatalyst. The size and shape of these AEI particles are similar to that seen in Fig. 3. Magnification (×2000) of one of these particles (Fig. 4b) reveals a rough morphology of small globular spheres covering the entire surface of the AEI particle. Surrounding the isolated AEI “islands” are smooth regions with no clear visual evidence of μm sized AEI particles. A “particle free” region is highlighted in Fig. 4d (magnified ×2000 in Fig. 4e). The same small globular spheres, as seen covering the AEI particle, are also observed in the AEI-free regions. Increased magnification (×50000) of both regions confirms that the morphologies of globular spheres are identical (Fig. 4c and f).
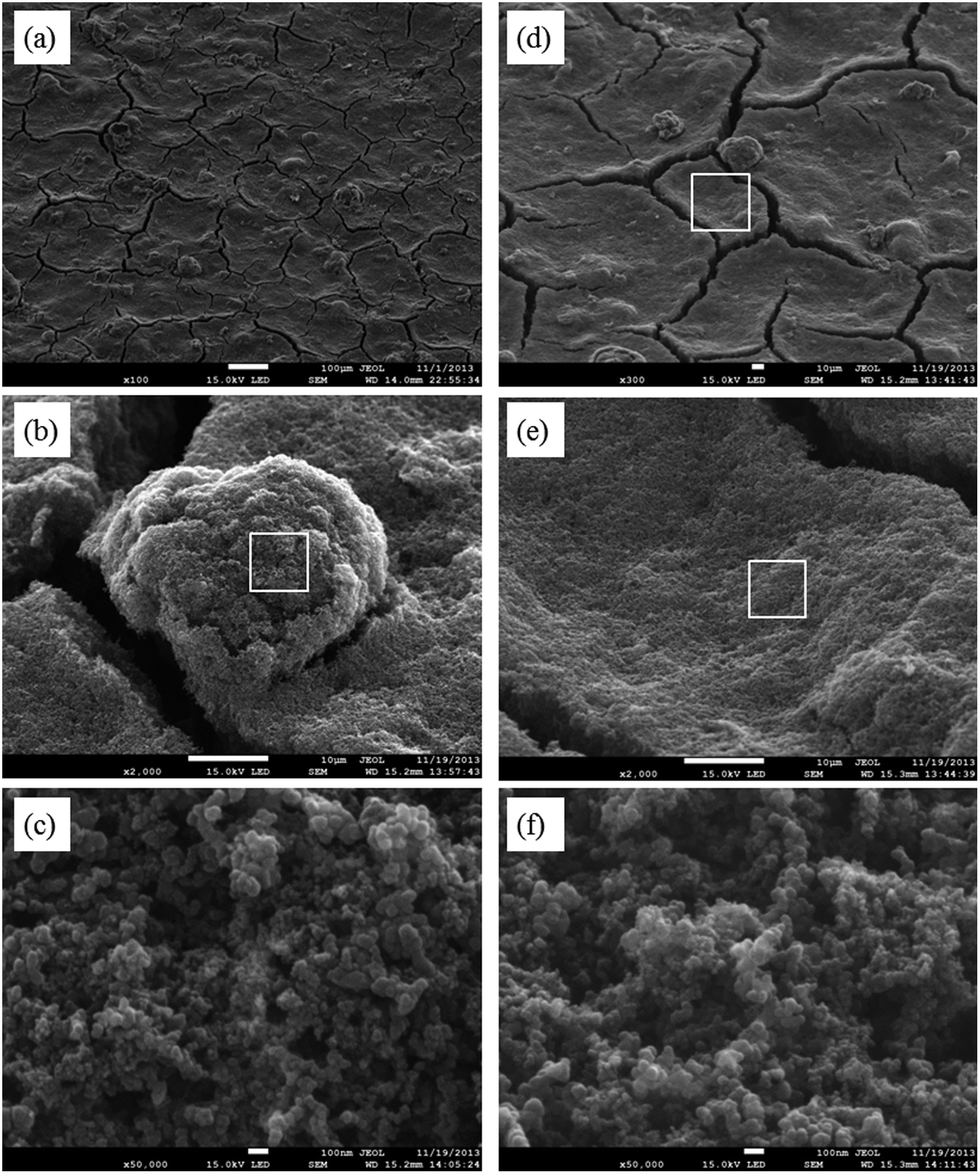 | ||
| Fig. 4 SEM images of the catalyst layer of a GDE sample with 15%mass AEI content (3 nm Au coating used for image clarification purposes). | ||
Elemental analysis was subsequently performed to confirm the distribution of AEI across the GDE and for the identification of the globules that coat the entire electrode surface. Fig. 5a and b respectively show the elemental Pt and F contents for an exemplar particle and particle-free region (associated SEM at 10000× magnification). F was only observed with the AEI particle sample zone and not for the particle-free region, while the Pt signal was strong for both sample regions. The F signal originates from the –CF2– groups within the ETFE base polymer of the AEI, while the Pt signal comes from the Pt/C electrocatalyst. Further confirmation as to the location of the F (and thus AEI) across the GDE is given by the elemental maps presented in Fig. 5c. It is clear that the F signals are only associated with the randomly distributed particles, while the Pt signal is more evenly spread across the electrode surface. Thus, the particle-free zones are generally devoid of AEI. This was not unexpected given the crude fabrication method used. The localised distribution of AEI particles across the GDE will result in a concentration of the ionic conductivity into isolated regions (within the electrocatalyst layer), while the majority of the “catalyst layer” will not exhibit significant ionic conduction. This obviously has major implications for the catalyst utilisation of the electrode, as it significantly reduces the electrochemically active surface area (of the catalyst) for both the oxygen reduction and hydrogen oxidation reactions. Therefore, in situ performances were expected to be poor.
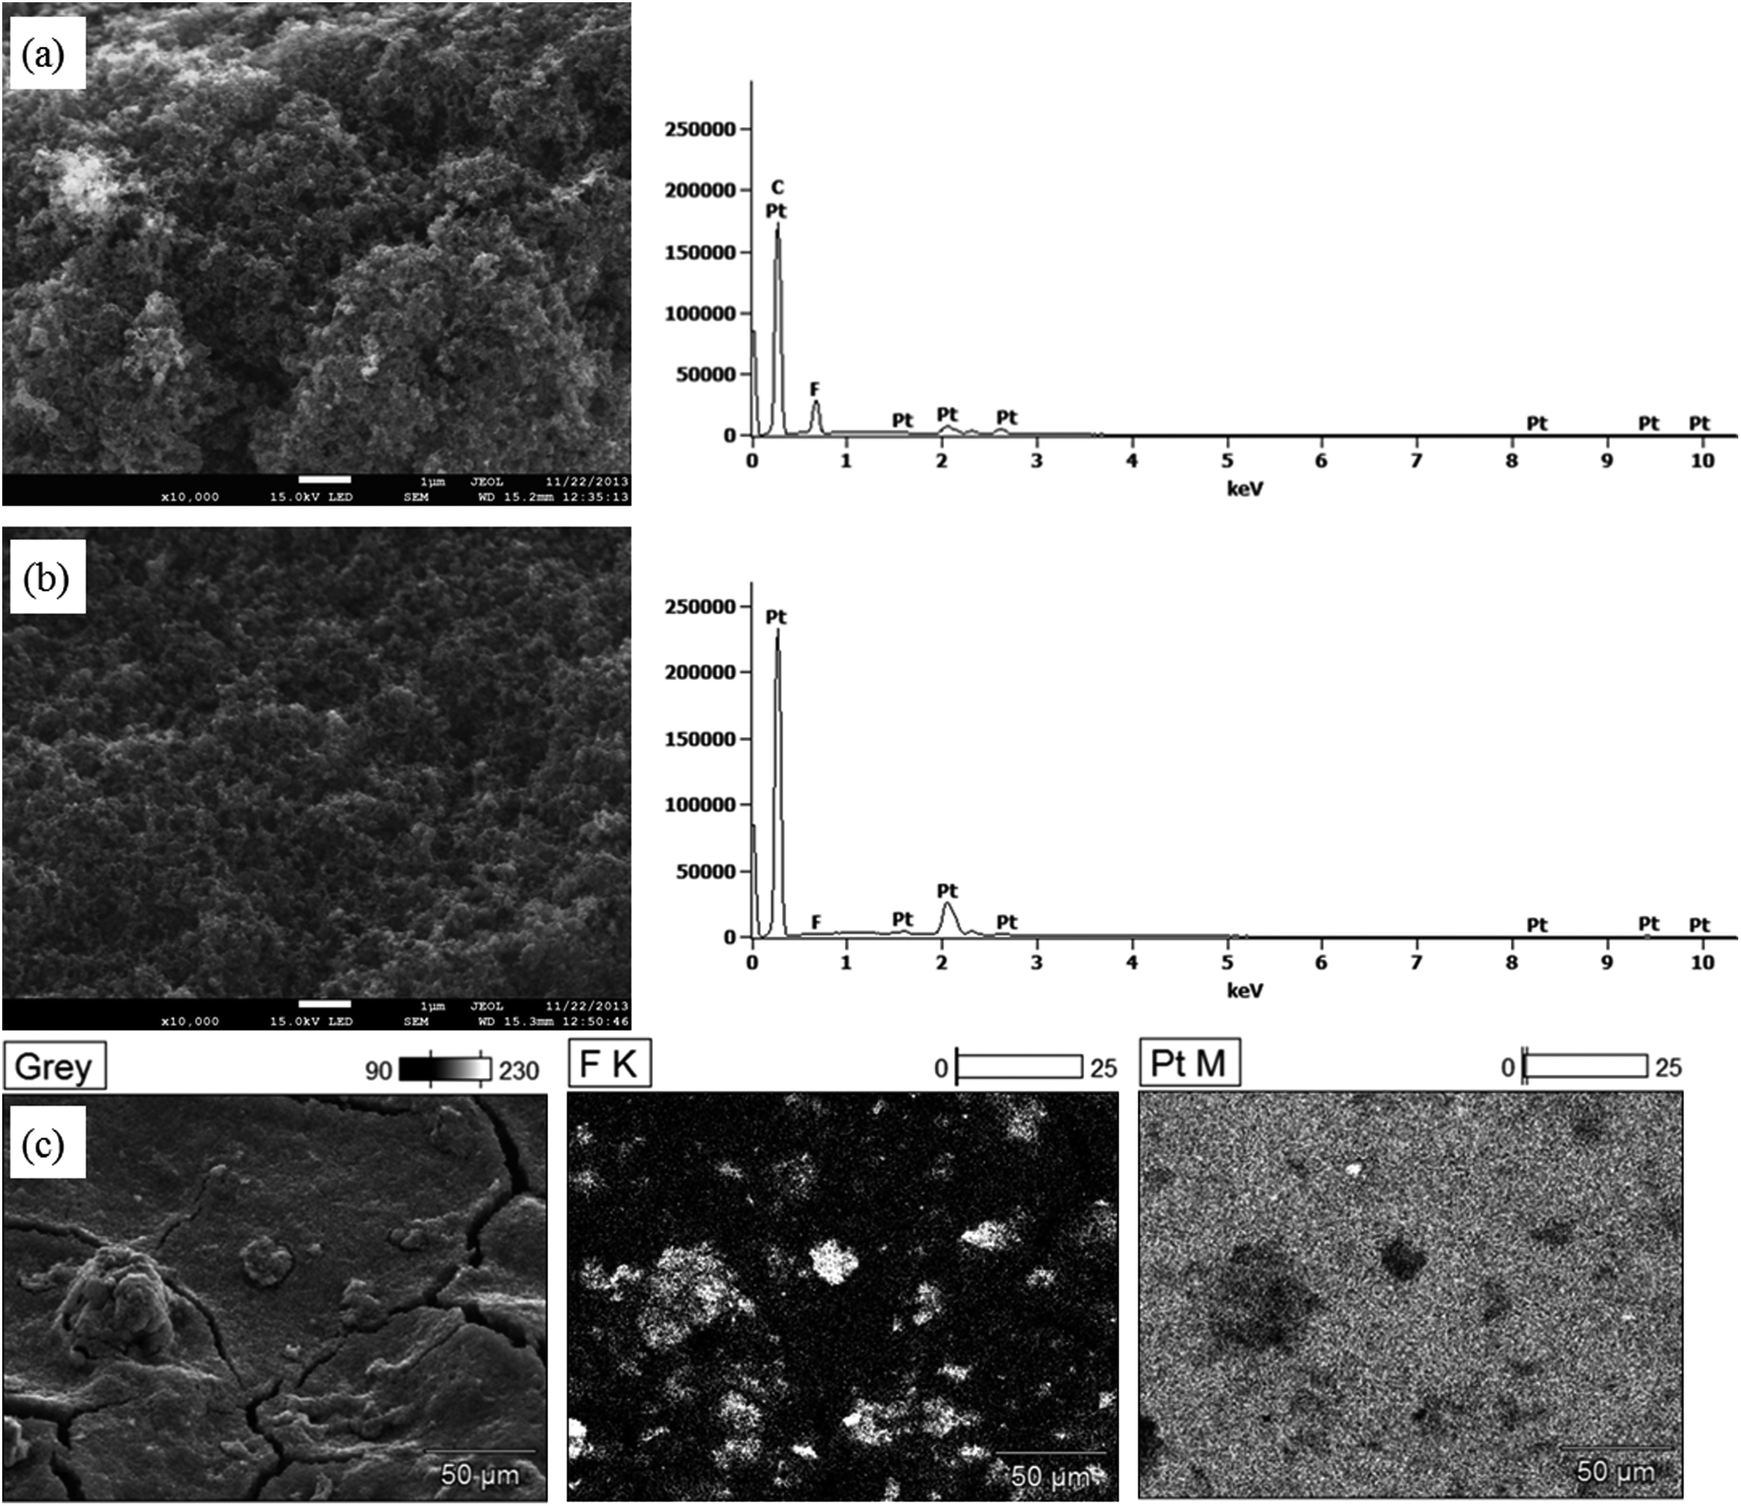 | ||
| Fig. 5 SEM and EDX data for: (a) AEI particle region of GDE (×10000), (b) non-particulate regions (×10000), and (c) EDX mapping over a larger surface area of the GDE. The catalyst layer contained 15%mass AEI powder. | ||
To verify this expectation, single cell H2/O2 APEFCs were tested at 50 °C using MEAs with either 15 or 20%mass AEI in the electrodes (symmetrical AEI contents in both the anode and cathode in each MEA). The polarisation and power density curves are presented in Fig. 6. The OCVs for the 15 and 20%mass AEI loadings were high at 1.05 and 1.07 V, respectively (typical for H2/O2 APEFCs). Both electrodes, however, suffered from a significant initial drop in potential at low current density (indicating kinetic limitations due to an uneven distribution of the AEI across the electrode surface). The lower AEI loading of 15%mass yields a larger overpotential at low current densities relative to the electrode with 20%mass AEI.
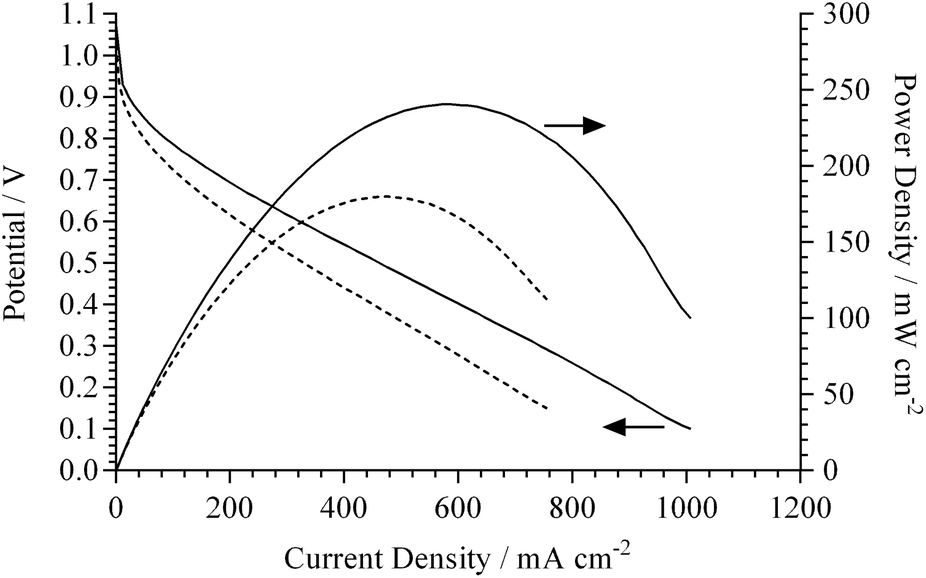 | ||
| Fig. 6 Beginning of life fuel cell performance curves at 50 °C for MEAs containing electrodes fabricated using either 15%mass (dashed line) or 20%mass (solid line) RG powder AEI(OH−). AAEM(OH−) = ETFE RG type (80 μm fully hydrated thickness). H2/O2 gases were supplied at 400 cm3 min−1 and RH ≈ 100%. Data recorded from high current density to open circuit voltage at 10 mV s−1 sweep rate. | ||
Even with the considerable catalyst utilisation limitations, the maximum geometric power densities recorded for both AEI loading levels were high (considering the use of a relatively thick 80 μm AAEM and a low temperature of 50 °C): the 15%mass AEI showed a peak power density = 180 mW cm−2 (at 475 mA cm−2), while 20%mass AEI showed a peak power density = 240 mW cm−2 (at 630 mA cm−2). A typical value for a similar MEA (tested under similar conditions) but with Surrey's previous generation ionomer (15%mass polymer loading) is 140 mW cm−2.34 In addition to the uneven AEI distribution (evident in Fig. 4), the surface morphology of the electrodes were not flat. The contact resistances within both MEAs (without prior hot-pressing to laminate the electrodes to the AAEM) were 193 and 154 mΩ cm2 (determined from current interrupt measurements recorded automatically by the Scribner fuel cell test station) for the 15%mass and 20%mass AEI, respectively.
Given that such promising performances were not anticipated, the AAEM and AEI materials were then sent for inter-laboratory testing (at the University of Connecticut). Despite different MEA fabrication and test conditions being used, higher than expected performances were again observed (see Fig. ESI2†): a peak power density of 185 mW cm−2 was obtained. It appears that access to OH− anions through the catalyst layers is less critical than any blocking of gas permeation by ionomer binder in the fabricated electrodes. The higher than expected fuel cell performances may also be due to the identical chemistry of the AEI and AAEM used (only the morphological form and IEC being different).
We acknowledge that these AEI powders cannot be realistically used in APEFCs in such a morphological (powder) form; however, the high performances obtained (in un-optimised MEAs and fuel cell conditions) indicates that this class of materials has a potential (for use as an AEI) that needs to be further developed. Efforts are now on-going that are focusing on developing a more suitable dispersion or solubilisation of the RG AEI particles (of smaller particle sizes) that would allow a more even distribution of AEI in the catalyst layers.
Conclusions
The use of novel radiation-grafted ETFE benzyltrimethylammonium powders as anion-exchange ionomers (AEI) within the electrocatalyst layer of an alkaline polymer electrolyte fuel cell is reported. The AEI powders were produced with comparable ion-exchange capacities to previously developed alkaline anion-exchange membranes (of identical chemistry). An average AEI particle size of 25 ± 10 μm led to a poor, uneven, distribution of the AEIs particles across the surface of the electrode. This led to the expectation that the resulting H2/O2 performances would be poor. However, higher than expected power performances were achieved (verified in 2 different laboratories). Considering that a large proportion of the electrocatalyst surface was not in contact with an ionic conducting phase, the high performances were surprising. This AEI concept shows promise and further research is on-going to optimise dispersion/solubilisation for more realistic application.Acknowledgements
We thank AGC Chemicals Europe (UK) for supplying the ETFE powders for this investigation and Chris Burt for his assistance in obtaining the SEM images. We thank the Engineering and Physical Science Research Council for supporting this research (grant numbers EP/H025340/1 and EP/I004882/1) and the Comunidad Autonoma de Madrid project RESTOENE (S2009/ENE-1734) for funding Ricardo Escudero-Cid's summer placement at University of Surrey. We also would also like to thank US DOE Early Career Program funding (awarded to Prof William Mustain) through Award Number DE-SC0010531.Notes and references
- G. Merle, M. Wessling and K. Nijmeijer, J. Membr. Sci., 2011, 377, 1 CrossRef CAS PubMed.
- G. Couture, A. Alaaeddine, F. D. R. Boschet and B. Ameduri, Prog. Polym. Sci., 2011, 36, 1521 CrossRef CAS PubMed.
- L. Zhang, S. R. Chae, Z. Hendren, J. S. Park and M. R. Wiesner, Chem. Eng. J., 2012, 204–206, 87 CrossRef CAS PubMed.
- S. D. Poynton, J. P. Kizewski, R. C. T. Slade and J. R. Varcoe, Solid State Ionics, 2010, 181, 219 CrossRef CAS PubMed.
- S. Lu, J. Pan, A. Huang, L. Zhuang and J. Lu, Proc. Natl. Acad. Sci. U. S. A., 2008, 105, 20611 CrossRef CAS.
- M. Piana, S. Catanorchi and H. A. Gasteiger, ECS Trans., 2008, 16, 2045 CAS.
- J. R. Varcoe, R. C. T. Slade, E. Lam How Yee, S. D. Poynton and D. J. Driscoll, J. Power Sources, 2007, 173, 194 CrossRef CAS PubMed.
- T. Kimura and Y. Yamazaki, Electrochemistry, 2011, 79, 94 CrossRef CAS PubMed.
- H. Yanagi and K. Fukuta, ECS Trans., 2008, 16, 257 CAS.
- L. Adams, S. D. Poynton, C. Tamain, R. C. T. Slade and J. R. Varcoe, ChemSusChem, 2008, 1, 79 CrossRef CAS PubMed.
- K. Fukuta, M. Inaba, Y. Matsui, M. Saito, A. Tasaka, S. Watanabe and H. Yanagi, Electrochemistry, 2011, 79, 322 CrossRef PubMed.
- J. R. Varcoe and R. C. T. Slade, Fuel Cells, 2005, 5, 187 CrossRef CAS.
- J. Fang, Y. Yang, X. Lu, M. Ye, W. Li and Y. Zhang, Int. J. Hydrogen Energy, 2012, 37, 594 CrossRef CAS PubMed.
- J. P. Kizewski, N. H. Mudri and J. R. Varcoe, Radiat. Phys. Chem., 2013, 89, 64 CrossRef CAS PubMed.
- B. S. Ko, J. Y. Sohn and J. Shin, Polymer, 2012, 53, 4652 CrossRef CAS PubMed.
- H. Liu, S. Yang, S. Wang, J. Fang, L. Jiang and G. Sun, J. Membr. Sci., 2011, 369, 277 CrossRef CAS PubMed.
- M. Mamlouk, J. A. Horsfall, C. Williams and K. Scott, Int. J. Hydrogen Energy, 2012, 37, 11912 CrossRef CAS PubMed.
- J. R. Varcoe, R. C. T. Slade, E. Lam How Yee, S. D. Poynton, D. Driscoll and D. C. Apperley, Chem. Mater., 2007, 19, 2686 CrossRef CAS.
- J. R. Varcoe and R. C. T. Slade, Electrochem. Commun., 2006, 8, 839 CrossRef CAS PubMed.
- L. Li, B. Deng, Y. Ji, Y. Yu, L. Xie, J. Li and X. Lu, J. Membr. Sci., 2010, 346, 113 CrossRef CAS PubMed.
- X. Yang, B. Zhang, Z. Liu, B. Deng, M. Yu, L. Li, H. Jiang and J. Li, J. Mater. Chem., 2011, 21, 11908 RSC.
- M. Yu, B. Zhang, B. Deng, X. Yang, K. Sheng, L. Xie, X. Lu and J. Li, J. Appl. Polym. Sci., 2010, 117, 3575 CrossRef CAS.
- B. Deng, Y. Yu, B. Zhang, X. Yang, L. Li, M. Yu and J. Li, Radiat. Phys. Chem., 2011, 80, 159 CrossRef CAS PubMed.
- J. Ma, Y. Wang, J. Peng, J. Qiu, L. Xu, J. Li and M. Zhai, J. Membr. Sci., 2012, 419–420, 1 CrossRef CAS PubMed.
- A. Oshima, T. Miura, S. Asano, S. Ichizuri, J. Li, S. Ikeda, M. Iida, C. Matsuura, Y. Tabata, Y. Katsumura and M. Washio, Res. Chem. Intermed., 2005, 31, 585 CrossRef CAS PubMed.
- T. A. Sherazi, M. D. Guiver, D. Kingston, S. Ahmad, M. A. Kashmiri and X. Xue, J. Power Sources, 2010, 195, 21 CrossRef CAS PubMed.
- T. A. Sherazi, S. Ahmad, M. A. Kashmiri, D. S. Kim and M. D. Guiver, J. Membr. Sci., 2009, 333, 59 CrossRef CAS PubMed.
- T. A. Sherazi, S. Ahmad, M. A. Kashmiri and M. D. Guiver, J. Membr. Sci., 2008, 325, 964 CrossRef CAS PubMed.
- T. A. Sherazi, J. Yong Sohn, Y. Moo Lee and M. D. Guiver, J. Membr. Sci., 2013, 441, 148 CrossRef CAS PubMed.
- H. Bunazawa and Y. Yamazaki, J. Power Sources, 2008, 182, 48 CrossRef CAS PubMed.
- Y. Zhao, H. Yu, D. Yang, J. Li, Z. Shao and B. Yi, J. Power Sources, 2013, 221, 247 CrossRef CAS PubMed.
- J. R. Varcoe, R. C. T. Slade and E. Lam How Yee, Chem. Commun., 2006, 13, 1428 RSC.
- M. Mamlouk, K. Scott, J. A. Horsfall and C. Williams, Int. J. Hydrogen Energy, 2011, 36, 7191 CrossRef CAS PubMed.
- O. I. Deavin, S. Murphy, A. Ong, S. D. Poynton, R. Zeng, H. Herman and J. R. Varcoe, Energy Environ. Sci., 2012, 5, 8584 CAS.
- P. J. Larkin, Infrared and Raman Spectroscopy, Elsevier, Oxford, 2011 Search PubMed.
- E. Pigorsch, Starch, 2009, 61, 129 CrossRef CAS.
- B. S. Ko, J. Y. Sohn, Y. C. Nho and J. Shin, Nucl. Instrum. Methods Phys. Res., Sect. B, 2011, 269, 2509 CrossRef CAS PubMed.
- O. M. M. Page, S. D. Poynton, S. Murphy, A. Ong, D. M. Hillman, C. A. Hancock, M. G. Hale, D. C. Apperley and J. R. Varcoe, RSC Adv., 2013, 3, 579 RSC.
Footnote |
| † Electronic supplementary information (ESI) available: Including the in situ fuel cell test data collected by the University of Connecticut. See DOI: 10.1039/c4ta00558a |
| This journal is © The Royal Society of Chemistry 2014 |