 Open Access Article
Ultrathin S-doped MoSe2 nanosheets for efficient hydrogen evolution†
Chen
Xu
ab,
Shengjie
Peng
a,
Chaoliang
Tan
a,
Huixiang
Ang
a,
Huiteng
Tan
ab,
Hua
Zhang
a and
Qingyu
Yan
*ab
aSchool of Materials Science and Engineering, Nanyang Technological University, Block N4.1 Nanyang Avenue, Singapore 639798. E-mail: Alexyan@ntu.edu.sg
bTUM CREATE, 1 Create way, #10-02 Create Tower, 138602, Singapore
First published on 12th February 2014
Abstract
We report the synthesis of ultrathin S-doped MoSe2 nanosheets demonstrating enhanced HER catalysis with a low onset overpotential of 90 mV and a Tafel slope of 58 mV per decade. We attribute the improved catalytic effects to the proliferation of unsaturated HER active sites in MoSe2 resulting from S-doping.
Hydrogen is a clean energy carrier and considered as a promising candidate to replace fossil fuels in the future due to its highest energy density (143 kJ g−1).1 The feasibility of a hydrogen economy highly depends on the cost and efficiency of hydrogen production. Low system efficiency (30–45%) and high capital cost are major hurdles for wider industrial application of hydrogen production through electrochemical hydrogen evolution reaction (HER).2,3
Platinum has been demonstrated to be a superior electrocatalyst in HER.4–6 However, the rare availability and high price of Pt limit its large-scale application. Thus, it is desirable but challenging to find inexpensive alternatives with high electrocatalytic activity to replace Pt. Recently, layered semiconducting metal dichalcogenides MX2, where M represents a transition metal and X represents S, Se or Te, have drawn great attention as inorganic electrocatalysts for HER due to their low-cost and electrochemical stability in acid. Intensive research has been devoted to improving their electrocatalytic performance.7–11
Three major strategies have been suggested and developed to optimize the HER catalytic effects of these transition metal dichalcogenides: (1) increasing the number of active sites of the catalyst; (2) improving the electrical conductivity of the catalyst; and (3) improving the catalytic effects of the active sites. Firstly, nanosizing layered metal dichalcogenides becomes the primary strategy to increase the number of catalytically active edge sites for HER.8,9 Layered materials tend to expose their basal planes as terminating surfaces to minimize surface free energy. However, edges of layered materials with dangling bonds are catalytically active while the basal planes are electrochemically inert in HER.11–14 Therefore, intensive efforts have been devoted to synthesizing metal dichalcogenide nanostructures with high density of active edge sites.8,9,12 It was also demonstrated that active edge sites can be greatly increased by forming defects on the basal planes of these metal dichalcogenide nanosheets.15 Secondly, carbonaceous materials, including carbon nanotubes,16 graphene17 and reduced graphene oxide sheets,18 have been employed as catalyst support to improve the electrical conductivity of the HER electrocatalyst. Consequently, the improved electrical conductivity contributes to faster reaction kinetics, and thus a smaller overpotential and a larger cathodic current can be obtained in HER.17,18 Thirdly, previous research also demonstrated that cation-doping/substitution (Fe, Ni, Co and B) to those transition metal dichalcogenides can effectively improve their HER electrocatalytic efficiency by promoting the catalytic activity of active sites.19–23 For example, cobalt incorporation into MoS2 occupies the structural edges, more specifically, the HER catalytic active S-edge, so that the hydrogen binding energy is greatly reduced. As a result, hydrogen adsorption onto the catalyst is greatly facilitated.24 However, anion-doping/substitution to transition metal dichalcogenides has seldom been investigated in HER catalysis, although anion-doping/substitution has been proven to be effective to promote photocatalytic materials25–28 and improve the electrical conductivity of thermoelectric materials.29
Here, we demonstrate the development of MoSe2 nanosheets with S-doping for HER catalysis. MoSe2 has higher intrinsic electrical conductivity than MoS2 due to the more metallic nature of Se. And, the unsaturated Se-edges in MoSe2 are found to be electrocatalytically active and beneficial for the HER process as S-edges in MoS2.8,9 Moreover, theoretical calculation shows that the Gibbs free energy for hydrogen adsorption onto MoSe2 edges is lower than that of MoS2, leading to higher coverage of hydrogen adsorption.30 Similar to other layered metal dichalcogenides, the surface energy of the edge sites in MoSe2 is higher than that of the terrace sites, so it tends to expose more basal planes as terminating surfaces. In our synthesis, a surfactant is employed which is expected to lower the surface energy of edge sites, resulting in nanosheets with large quantities of exposed edge sites. Besides, the obtained S-doped MoSe2 (∼1.68 wt% S) nanosheets are rich in both structural defects in their basal planes as well as unsaturated sites along the basal edges. With S-doping, the bandgap of MoSe2 is slightly reduced indicating improved electrical conductivity. In the HER process, the S-doped MoSe2 catalyst exhibits highly-active electrocatalysis with a current density of 30 mA cm−2 at the overpotential of ∼156 mV and a small Tafel slope of 58 mV per decade.
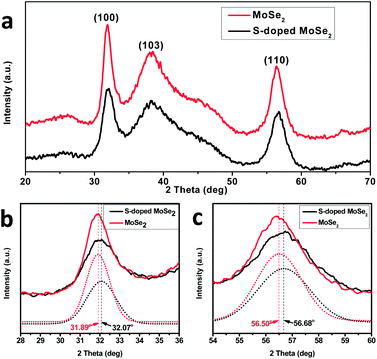
For comparison, the MoSe2 nanosheets are firstly synthesized by reacting Mo–oleylamine and Se–oleylamine–dodecanethiol mixtures. Dodecanethiol not only promotes the dissolution of selenium in oleylamine but also acts as a surfactant to lower the surface energy of the basal edges, limiting the expanded growth of the basal plane. The SEM and TEM images (ESI, Fig. S1†) clearly reveal the formation of ultrathin nanosheets, which crumbled into a three dimensional network with large quantities of exposed edge sites. The XRD pattern for the as-synthesized nanosheet (Fig. 1a) reveals characteristic peaks at 2θ = 31.89°, 38.21° and 56.50° corresponding to diffraction planes of (100), (103) and (110) for MoSe2 (JCPDF 00-029-0914), respectively. The EDX analysis shows that the atomic ratio of Se to Mo is 2.07![[thin space (1/6-em)]](https://www.rsc.org/images/entities/char_2009.gif) :
:![[thin space (1/6-em)]](https://www.rsc.org/images/entities/char_2009.gif) 1, which further confirms the formation of MoSe2 (ESI, Fig. S1d†).
1, which further confirms the formation of MoSe2 (ESI, Fig. S1d†).
The S-doping is introduced by addition of elemental sulfur powder to the precursor solution. The XRD pattern (Fig. 1) of S-containing MoSe2 reveals diffraction peaks at 2θ = 32.07°, 38.31° and 56.68° with a slight displacement to higher angles compared to that of pure MoSe2. The right-shift of the diffraction peaks indicates compaction of unit cells. Such a right shift of peaks is expected as S has a smaller ionic radius compared to Se.31,32 Besides, it is worth noting that the XRD peaks of S-doped MoSe2 are broader and weaker in intensity (Fig. 1b and c), indicating that incorporation of S reduces the average grain size and the crystallinity of the sample. The smaller sized grains correspond to more grain boundaries, which suggest more defects and structural disordering.
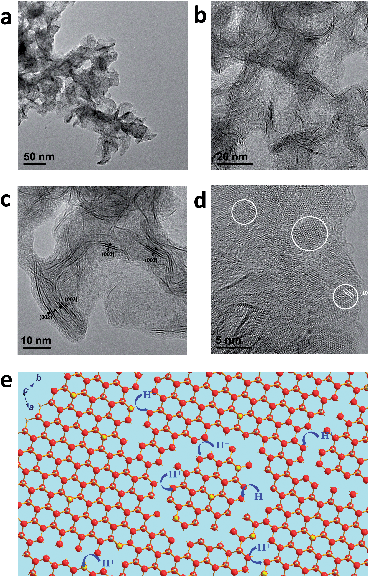
The 3D networking morphology of nanosheets can be retained with the addition of S as shown in Fig. 2a. Fig. 2b reveals a lamellar structure and a large quantity of exposed edge sites of the (002) plane. The incorporation of S into MoSe2 gives rise to more stacking faults and plane defects, resulting in a notable curvature of the edge of the (002) plane and non-uniformity of the spacing between adjacent (002) planes ranging from 6.5 Å to 7.5 Å (Fig. 2c and ESI, Fig. S2c†). The HRTEM images in Fig. 2d and Fig. S2 (ESI†) reveal the polycrystalline feature of the basal plane of the S-doped MoSe2 nanosheet, which is composed of distributed nanodomains smaller than 5 nm. The nanodomains result in the formation of additional edge sites along the domain walls, and the unsaturated S and Se along the domain walls are possible active sites for hydrogen ion adsorption as illustrated in Fig. 2e.
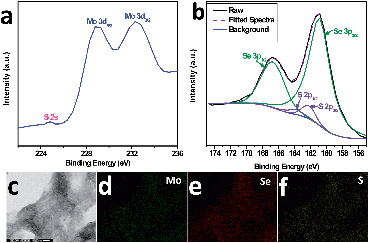
In order to investigate the chemical composition of the samples, XPS, EDX elemental mapping and elemental analysis (CHNS-MS) were carried out. The full profile of the XPS spectrum confirms the presence of Mo, Se and S (Fig. S3a). Two characteristic peaks (Fig. 3a) located at 232.4 eV and 229.0 eV can be assigned to Mo 3d3/2 and Mo 3d5/2, respectively. And the minor peak at 224.8 eV corresponds to S 2s, indicating the presence of S in a small quantity.33 The peaks between 155 eV and 175 eV can be de-convoluted into four peaks (Fig. 3b). Peaks at 160.8 eV and 166.8 eV are attributed to Se 3p3/2 and 3p1/2, respectively.34 Whereas the other two peaks at 162.4 eV and 163.8 eV correspond to binding energies of S 2p3/2 and 2p1/2 in MoS2, suggesting the existence of Mo–S bonding instead of elemental S.35,36 And, it is also an indication of substitutional doping of S to Se instead of S occupying the interstitial sites of MoSe2. The peak at 55 eV is attributed to Se 3d3/2 (Fig. S3b†). The incorporation of S is also confirmed by STEM-EDX mapping, which reveals a uniform compositional distribution of S inside the MoSe2 nanosheets (Fig. 3c–f). The amount of S-doping is further confirmed by CHNS-elemental analysis to be 1.68 wt%.
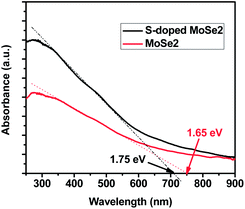
It has been reported that the structural defects in molybdenum chalcogenides can have significant influence on their optical and electrical properties.37,38 The bandgap variation is determined from the UV-visible diffuse reflectance spectra of samples. As shown in Fig. 4, the S-doped MoSe2 nanosheets possess a narrow bandgap of 1.65 eV compared with pristine MoSe2 nanosheets (1.75 eV). As demonstrated in previous studies, point defects and residual strain induced from small amount doping may give rise to extra donor levels in the forbidden energy gap, leading to bandgap narrowing.39,40 Subsequently, the electrical conductivity of the material can be enhanced due to bandgap narrowing.41–43
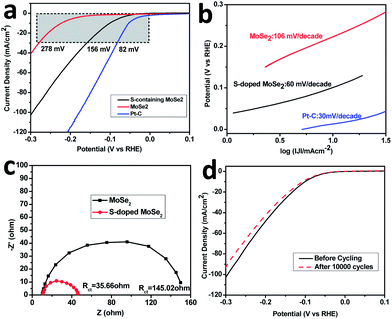
The electrocatalytic HER activities of MoSe2 and S-doped MoSe2 were investigated in 0.5 M H2SO4 solution using a typical three-electrode setup. For comparison, HER catalytic measurements using commercial Pt–C (10 wt% Pt) were also performed. The polarization curves (Fig. 5a) (I–V plot) exhibited a small onset overpotential of 90 mV for S-doped MoSe2, beyond which the cathodic current rose rapidly under more negative potentials. In contrast, the pure MoSe2 shows a larger onset overpotential of around 200 mV. At a same current density of 30 mA cm−2, the S-doped MoSe2 nanosheet needs an overpotential of 156 mV (82 mV for Pt–C) while MoSe2 requires a greater overpotential of 278 mV.
The Tafel plots (Fig. 5b) were derived from the polarization curve. The linear portion of the Tafel plot was fitted into the Tafel equation:
η = b![[thin space (1/6-em)]](https://www.rsc.org/images/entities/char_2009.gif) log log![[thin space (1/6-em)]](https://www.rsc.org/images/entities/char_2009.gif) j + a j + a |
Besides of more active HER catalysis sites, the enhanced charge transfer kinetics also contribute to the improved HER electrocatalysis efficiency of S-doped MoSe2 nanosheets. In order to prove this effect, Ac impedance measurement was carried out at an overpotential of η = 150 mV (Fig. 5c). The Nyquist plots obtained from impedance measurement were fitted with an equivalent circuit in Fig. S4 (ESI†). The S-doped MoSe2 nanosheets exhibited a much lower charge transfer impedance of 35.66 Ω than pure MoSe2 nanosheets (145.02 Ω), indicating faster HER kinetics with the S-doped MoSe2 catalyst.23
Stability is another important property of the HER electrocatalyst. Cycling stability is investigated by carrying out continuous cyclic voltammetry between −0.4 V and 0.2 V (vs. RHE) at 100 mV s−1. As shown in Fig. 5d, only a slight activity loss was observed after 10![[thin space (1/6-em)]](https://www.rsc.org/images/entities/char_2009.gif) 000 cycles' accelerated scanning, indicating a good cycling performance. This might be caused by the consumption of H+ or accumulation of H2 around the electrode surface that hinders the reaction.38
000 cycles' accelerated scanning, indicating a good cycling performance. This might be caused by the consumption of H+ or accumulation of H2 around the electrode surface that hinders the reaction.38
Conclusions
In conclusion, we have demonstrated a simple method to synthesize S-doped MoSe2 with enhanced HER catalytic activity. We attribute the improved HER catalytic effects of S-doped MoSe2 to the proliferation of unsaturated active sites for hydrogen evolution catalysis and the enhancement of the electrical conductivity resulting from S-doping. The present work suggests that anion-doping/incorporation is an effective method to increase the density of catalytic active sites and the electrical conductivity of metal dichalcogenides, enabling their potential to replace Pt as an electrocatalyst in HER. Further improvements of the materials may be obtained by increasing the doping concentration followed by addition of conductive carbon as a catalyst support to achieve more active sites and higher electrical conductivity.Experimental procedures
Molybdenum chloride (MoCl5), selenium powder, sulfur powder, 10 wt% Pt on charcoal, technical grade oleylamine (70%) and Nafion solution (5% in a mixture of lower aliphatic alcohols and water) were all purchased from Sigma-Aldrich. Oleylamine was purged with Ar gas at 120 °C for 2 h before use. Other chemicals were all used as received.The synthesis was carried out using a three-neck flask under continuous Ar gas flow in a heating mantle. 0.1 mmol MoCl5 and 10 ml oleylamine were mixed and heated to 120 °C (solution A). 0.2 mmol Se powder and 0.2 mmol S powder were added to a 10 ml oleylamine–dodecanethiol (9![[thin space (1/6-em)]](https://www.rsc.org/images/entities/char_2009.gif) :
:![[thin space (1/6-em)]](https://www.rsc.org/images/entities/char_2009.gif) 1 vol%) mixture and heated to 120 °C for 1 h in a separate flask (solution B). Solution B changed from colorless to brownish during heating indicating dissolution of Se powder in oleylamine. Solution A was then added to solution B, and the mixed solution was heated to 220 °C and maintained at this temperature for 6 h. Subsequently, the reaction mixture was naturally cooled down to room temperature. Hexane was added to the mixture, which was then centrifuged with an ethanol–hexane mixture for more than 5 times. The residual solid was finally dispersed in ethanol for further use and analysis. In the synthesis of pure MoSe2 without doping, only 0.2 mmol Se powder was added to a 10 ml oleylamine–dodecanethiol (9
1 vol%) mixture and heated to 120 °C for 1 h in a separate flask (solution B). Solution B changed from colorless to brownish during heating indicating dissolution of Se powder in oleylamine. Solution A was then added to solution B, and the mixed solution was heated to 220 °C and maintained at this temperature for 6 h. Subsequently, the reaction mixture was naturally cooled down to room temperature. Hexane was added to the mixture, which was then centrifuged with an ethanol–hexane mixture for more than 5 times. The residual solid was finally dispersed in ethanol for further use and analysis. In the synthesis of pure MoSe2 without doping, only 0.2 mmol Se powder was added to a 10 ml oleylamine–dodecanethiol (9![[thin space (1/6-em)]](https://www.rsc.org/images/entities/char_2009.gif) :
:![[thin space (1/6-em)]](https://www.rsc.org/images/entities/char_2009.gif) 1 vol%) mixture to make solution B.
1 vol%) mixture to make solution B.
Morphologies were characterized using a field emission scanning electron microscope (FESEM, JEOL JSM-7600F). The TEM images were observed using a transmission electron microscope (TEM, JEOL 2100F) operating at 200 kV. Crystal phases were identified using an X-ray diffractometer (Shimadzu) with Cu Kα irradiation. Theta Probe X-ray photoelectron spectroscopy (XPS, ESCALab 250i-XL & Theta Probe A1333) was used to verify the presence of Mo, S and Se. CHNS elemental analysis was conducted on a CHNS elemental analyser, which can simultaneously determine the amount of carbon, hydrogen, nitrogen and sulfur contained in materials.
Three types of materials were tested for the HER electrocatalysis, including the commercial 10 wt% Pt on activated charcoal (Pt–C), MoSe2 nanosheet and S-doped MoSe2 nanosheet. The dispersions of catalyst materials were prepared by 30 min sonication of a mixture containing 4 mg catalyst materials in 0.9 ml ethanol, 0.1 ml H2O and 20 μL Nafion to form a homogeneous ink. 5 μL of the mixture were loaded onto glassy carbon electrodes by drop casting and dried naturally overnight. As the glass carbon electrode has a diameter of 3 mm, the mass loading on each electrode is 0.28 mg cm−2. Linear sweep voltammetry with a scan rate of 2 mV s−1 was conducted in 0.5 M H2SO4 (barged with Ar gas) using a Ag/AgCl (1 M KCl) electrode as the reference electrode and Pt wire as the counter electrode. All the potentials were calibrated to a reversible hydrogen electrode (RHE) after measurement. Before the polarization curve was recorded, cyclic voltammetry (CV) was conducted on each sample between −0.6 V and 0.2 V (vs. RHE) at 100 mV s−1 for 100 cycles to electrochemically remove residual organic components.45,46 And CV was conducted for 10![[thin space (1/6-em)]](https://www.rsc.org/images/entities/char_2009.gif) 000 cycles between −0.4 V and 0.2 V (vs. RHE) at 100 mV s−1 for the stability test. For the Tafel analysis, the logarithm of the negative current density of the resulting polarization curve was plotted vs. overpotential. The Nyquist plots were measured with frequencies ranging from 100 kHz to 0.1 Hz at an overpotential of 150 mV.
000 cycles between −0.4 V and 0.2 V (vs. RHE) at 100 mV s−1 for the stability test. For the Tafel analysis, the logarithm of the negative current density of the resulting polarization curve was plotted vs. overpotential. The Nyquist plots were measured with frequencies ranging from 100 kHz to 0.1 Hz at an overpotential of 150 mV.
Acknowledgements
This work was supported by MOE AcRF Tier 2 (ARC 26/13, no. MOE2013-T2-1-034), AcRF Tier 1 (RG 61/12, RGT18/13) and AcRF Tier 1 (RG 2/13), A*STAR SERC grant 1021700144, Singapore MPA 23/04.15.03 grant, and Start-Up Grant (M4080865.070.706022) in Singapore. This research is also funded by the Singapore National Research Foundation under the Campus for Research Excellence And Technological Enterprise (CREATE) programme: Emobility in Megacities.Notes and references
- R. D. Cortright, R. R. Davda and J. A. Dumesic, Nature, 2002, 418, 964–967 CrossRef CAS PubMed.
- E. Miller, 2012 Annual Merit Review - Hydrogen Production and Delivery, 2012 Search PubMed.
- J. Guo and X. Chen, Hydrogen Generation: Electrochemistry and Photoelectrocatalysis, Mc Graw Hill Education,1st edn, 2012 Search PubMed.
- J. Kye, M. Shin, B. Lim, J.-W. Jang, I. Oh and S. Hwang, ACS Nano, 2013, 7, 6017–6023 CrossRef CAS PubMed.
- N. R. Elezović, L. Gajić-Krstajić, V. Radmilović, L. Vračar and N. V. Krstajić, Electrochim. Acta, 2009, 54, 1375–1382 CrossRef PubMed.
- L. Sun, D. Ca and J. Cox, J. Solid State Electrochem., 2005, 9, 816–822 CrossRef CAS PubMed.
- Z. Wu, B. Fang, Z. Wang, C. Wang, Z. Liu, F. Liu, W. Wang, A. Alfantazi, D. Wang and D. P. Wilkinson, ACS Catal., 2013, 3, 2101–2107 CrossRef CAS.
- D. Kong, H. Wang, J. J. Cha, M. Pasta, K. J. Koski, J. Yao and Y. Cui, Nano Lett., 2013, 13, 1341–1347 CrossRef CAS PubMed.
- H. Wang, D. Kong, P. Johanes, J. J. Cha, G. Zheng, K. Yan, N. Liu and Y. Cui, Nano Lett., 2013, 13, 3426–3433 CrossRef CAS PubMed.
- J. Kim, S. Byun, A. J. Smith, J. Yu and J. Huang, J. Phys. Chem. Lett., 2013, 4, 1227–1232 CrossRef CAS.
- M. Chhowalla, H. S. Shin, G. Eda, L.-J. Li, K. P. Loh and H. Zhang, Nat. Chem., 2013, 5, 263–275 CrossRef PubMed.
- J. Kibsgaard, Z. Chen, B. N. Reinecke and T. F. Jaramillo, Nat. Mater., 2012, 11, 963 CrossRef CAS PubMed.
- W. I. Choi, B. C. Wood, E. Schwegler and T. Ogitsu, J. Phys. Chem. C, 2013, 117, 21772–21777 CAS.
- T. F. Jaramillo, K. P. Jørgensen, J. Bonde, J. H. Nielsen, S. Horch and I. Chorkendorff, Science, 2007, 317, 100–102 CrossRef CAS PubMed.
- J. Xie, H. Zhang, S. Li, R. Wang, X. Sun, M. Zhou, J. Zhou, X. W. Lou and Y. Xie, Adv. Mater., 2013, 25, 5807–5813 CrossRef CAS PubMed.
- A. B. Laursen, S. Kegnaes, S. Dahl and I. Chorkendorff, Energy Environ. Sci., 2012, 5, 5577–5591 CAS.
- Y. Li, H. Wang, L. Xie, Y. Liang, G. Hong and H. Dai, J. Am. Chem. Soc., 2011, 133, 7296–7299 CrossRef CAS PubMed.
- E. G. S. Firmiano, M. A. L. Cordeiro, A. C. Rabelo, C. J. Dalmaschio, A. N. Pinheiro, E. C. Pereira and E. R. Leite, Chem. Commun., 2012, 48, 7687–7689 RSC.
- T. Zhou, H. Yin, Y. Liu, Y. Chai, J. Zhang and C. Liu, Catal. Lett., 2010, 134, 343–350 CrossRef CAS.
- L. Álvarez, G. Berhault and G. Alonso-Nuñez, Catal. Lett., 2008, 125, 35–45 CrossRef.
- B. Liu, Y. Chai, Y. Liu, Y. Wang, Y. Liu and C. Liu, Fuel, 2012, 95, 457–463 CrossRef CAS PubMed.
- Y. Okamoto, K. Hioka, K. Arakawa, T. Fujikawa, T. Ebihara and T. Kubota, J. Catal., 2009, 268, 49–59 CrossRef CAS PubMed.
- D. Merki, H. Vrubel, L. Rovelli, S. Fierro and X. Hu, Chem. Sci., 2012, 3, 2515–2525 RSC.
- J. Bonde, P. G. Moses, T. F. Jaramillo, J. K. Norskov and I. Chorkendorff, Faraday Discuss., 2009, 140, 219–231 RSC.
- Y. Cong, J. Zhang, F. Chen and M. Anpo, J. Phys. Chem. C, 2007, 111, 6976–6982 CAS.
- G. Yang, Z. Jiang, H. Shi, T. Xiao and Z. Yan, J. Mater. Chem., 2010, 20, 5301–5309 RSC.
- H. Tang, H. Yin, J. Wang, N. Yang, D. Wang and Z. Tang, Angew. Chem., Int. Ed., 2013, 52, 5585–5589 CrossRef CAS PubMed.
- J. Du, X. Lai, N. Yang, J. Zhai, D. Kisailus, F. Su, D. Wang and L. Jiang, ACS Nano, 2010, 5, 590–596 CrossRef PubMed.
- W. Zhou, W. Zhao, Z. Lu, J. Zhu, S. Fan, J. Ma, H. H. Hng and Q. Yan, Nanoscale, 2012, 4, 3926–3931 RSC.
- H. Tang, K. Dou, C.-C. Kaun, Q. Kuang and S. Yang, J. Mater. Chem. A, 2014, 2, 360–364 CAS.
- C. Yang, M. Qin, Y. Wang, D. Wan, F. Huang and J. Lin, Sci. Rep., 2013, 3, 1286 Search PubMed.
- G. Wang, M. Yang, Z. Li, K. Lin, Q. Jin, C. Xing, Z. Hu and D. Wang, J. Nanopart. Res., 2013, 15, 1–8 Search PubMed.
- Y. Shi, J.-K. Huang, L. Jin, Y.-T. Hsu, S. F. Yu, L.-J. Li and H. Y. Yang, Sci. Rep., 2013, 3, 1839 Search PubMed.
- T. Ueno, Jpn. J. Appl. Phys., 1983, 22, 1469 CrossRef CAS.
- L. Benoist, D. Gonbeau, G. Pfister-Guillouzo, E. Schmidt, G. Meunier and A. Levasseur, Surf. Interface Anal., 1994, 22, 206–210 CrossRef CAS.
- H. W. Wang, P. Skeldon and G. E. Thompson, Surf. Coat. Technol., 1997, 91, 200–207 CrossRef CAS.
- W. Zhou, X. Zou, S. Najmaei, Z. Liu, Y. Shi, J. Kong, J. Lou, P. M. Ajayan, B. I. Yakobson and J.-C. Idrobo, Nano Lett., 2013, 13, 2615–2622 CrossRef CAS PubMed.
- J. Xie, J. Zhang, S. Li, F. Grote, X. Zhang, H. Zhang, R. Wang, Y. Lei, B. Pan and Y. Xie, J. Am. Chem. Soc., 2013, 135, 17881–17888 CrossRef CAS PubMed.
- V. B. Kamble and A. M. Umarji, AIP Adv., 2013, 3, 082120 CrossRef PubMed.
- A. Naldoni, M. Allieta, S. Santangelo, M. Marelli, F. Fabbri, S. Cappelli, C. L. Bianchi, R. Psaro and V. Dal Santo, J. Am. Chem. Soc., 2012, 134, 7600–7603 CrossRef CAS PubMed.
- J. Ihanus, E. Lambers, P. H. Holloway, M. Ritala and M. Leskelä, J. Cryst. Growth, 2004, 260, 440–446 CrossRef CAS PubMed.
- J. Tang, S. Hinds, S. O. Kelley and E. H. Sargent, Chem. Mater., 2008, 20, 6906–6910 CrossRef CAS.
- S. Wang, L. Yi, J. E. Halpert, X. Lai, Y. Liu, H. Cao, R. Yu, D. Wang and Y. Li, Small, 2012, 8, 265–271 CrossRef CAS PubMed.
- Encyclopedia of Electrochemical Power Sources, ed. C. K. Dyer, P. T. Moseley, Z. Ogumi, D. A. J. Rand and B. Scrosati, Elsevier, 2009 Search PubMed.
- H. Yang, Y. Tang and S. Zou, Electrochem. Commun., 2014, 38, 134–137 CrossRef CAS PubMed.
- J. Solla-Gullón, V. Montiel, A. Aldaz and J. Clavilier, J. Electroanal. Chem., 2000, 491, 69–77 CrossRef.
Footnote |
| † Electronic supplementary information (ESI) available: Morphology and compositional characterization of MoSe2 nanosheets, TEM and HRTEM images showing disordered nanodomains, XPS spectrum and Tafel and impedance analyses. See DOI: 10.1039/c4ta00458b |
| This journal is © The Royal Society of Chemistry 2014 |

