 Open Access Article
Creative Commons Attribution 3.0 Unported Licence
Development of CaMn1−xRuxO3−y (x = 0 and 0.15) oxygen reduction catalysts for use in low temperature electrochemical devices containing alkaline electrolytes: ex situ testing using the rotating ring-disk electrode voltammetry method
Cathryn A.
Hancock
*a,
Ai Lien
Ong
a,
Peter R.
Slater
b and
John R.
Varcoe
a
aDepartment of Chemistry, University of Surrey, Guildford, UK. E-mail: c.a.hancock@surrey.ac.uk; Tel: +44 (0)1483 686838
bSchool of Chemistry, University of Birmingham, Edgbaston, Birmingham, UK
First published on 14th January 2014
Abstract
Various inorganic solid state catalysts are of interest for use as cathode catalysts in low temperature alkaline fuel cells including alkaline polymer electrolyte fuel cells. This ex situ study compares the oxygen reduction reaction in aqueous KOH (1 mol dm−3) electrolyte on solid state and sol–gel synthesised CaMn1−xRuxO3 (x = 0 and 0.15) catalysts along with fuel-cell-grade Pt-based benchmark catalysts. The inclusion of Ru (e.g. in the CaMn0.85Ru0.15O3 examples) led to enhanced electronic conductivities compared to the Ru free exemplars. Rotating ring disk electrode hydrodynamic voltammetry was successfully used to determine the electron transfer numbers and hydrogen peroxide production yield for each catalyst. The electron transfer numbers of a number of the catalysts promisingly approach n = 4 (the same as for the platinum benchmarks). However, the on-set potentials of the CaMn1−xRuxO3 (x = 0 and 0.15) catalysts were less than that of the Pt-based benchmarks and they also degraded in the alkaline conditions used (with a further decrease in onset potentials on degradation): the results from the study lead to the hypothesis that the degradation is related to the electrochemically generated peroxide.
Introduction
There are many problems with current energy production techniques, the most pressing being dwindling fossil fuel supplies in combination with an increase in global population and its increasing energy demands.1 Since the early 2000's, shale gas has developed into a key oil and gas industry growth sector with resources being thought available for another 100+ years. However, this simply postpones the problem of diminishing fuel sources.2 In addition, the burning of fossil-derived fuels is inefficient and releases anthropogenic greenhouse gases into the atmosphere leading to undesirable climate change.Fuel cells represent an excellent alternate energy conversion technology when compared to the burning of fossil fuels in internal combustion engines. There are many different types of fuel cell, that work under different conditions, which are being developed for various applications. Solid oxide fuel cells (SOFC) are generally used in high temperature applications such as generators for large scale power production.3 In contrast to SOFCs, polymer electrolyte fuel cells are mainly being developed for low temperature mobile and portable applications.4 This includes the recently advocated alkaline polymer electrolyte fuel cells (APEFC) that contain alkaline anion-exchange membranes (AAEMs); this study is about this technology.
There are a number of issues that need to be investigated and problems to be solved, before such fuel cells become more widely used. This paper is focused on alternative cathode catalysts. Platinum-based catalysts are traditionally used (especially in proton-exchange membrane fuel cells) due to their high catalytic performances and relatively low over-potentials:5 the problem is the high cost and low abundance of such precious metals. There have been numerous studies that have focused on lowering the cost of these Pt-based catalysts.6,7 A common approach is to support the Pt metal on high surface area substrates, such as carbon, to lower the Pt-loading (this approach has been particularly successful at the anode). This approach is often in combination with the alloying of the Pt with cheaper elements such as Co. These Pt-alloy catalysts are, however, generally still expensive and can additionally exhibit reduced durabilities (leaching out of the non-noble metal component). As such, they do not represent the most ideal solution.
A different class of materials that has shown promise when used as catalysts in fuel cells are those based on low cost perovskite materials. These materials can have high ionic and electronic conductivities, and initial studies have shown promising oxygen reduction reaction (ORR) activities with a number of examples.5,8–12 A feature of perovskites that is attractive to researchers is the ability to incorporate a wide variety of cations (differing species and doping levels) that allows for a wide range of doping possibilities. Most research on using perovskites in fuel cells has focussed on the high temperature solid oxide systems: a considerable amount of research has involved the La1−xSrxMO3 (M = Mn, Fe and Co) system, which has the required ionic and electronic conductivities.9,10,12–19 Considering the success of using perovskite materials in high temperature fuel cells, research is now moving towards the lower temperature systems. A number of catalysts have shown promise for use as ORR catalysts at lower temperatures including Pr0.6Ca0.4MnO3 (ref. 20) and Ca0.9La0.1MnO3;21 this study will focus on the CaMnO3 end member (to the latter) and will investigate the effect of a small amount of Ru doping. Standard Pt- and C-based electrodes and catalysts will be used as benchmarks.
Methodology
Synthesis and structural analysis
The synthesis of CaMn1−xRuxO3−y (x = 0 and 0.15) was performed via two different methods: (1) solid state synthesis and (2) the sol–gel combustion method. These two contrasting techniques were both used to synthesise the catalysts in order to determine the method that would produce catalysts with the smallest particle size (with higher specific surface areas that are beneficial to application in fuel cells). Table 1 summarises the conditions used for all samples prepared. The following examples were the procedures used to synthesis the x = 0.15 catalysts:| Method | Initial process | 1st heating step | Additional heating steps |
|---|---|---|---|
| Sol–gel | Dissolve and heat nitrates into a gel | 350 °C for 3 h | Grind and heat at 600 °C and 800 °C for 12 h |
| Solid state | Grind oxide materials thoroughly | 1100 °C for 12 h | Grind 1300 °C for 12 h |
For a solid state method, high purity CaCO3 (2.00 g, 0.0200 mol, 99%, Fisher), MnO2 (1.48 g, 0.0170 mol, 99%, Sigma), and RuO2 (0.399 g, 0.00300 mol, 99.9%, Sigma) were intimately ground and heated to 1100 °C for 12 h and then reground and reheated at 1300 °C for a further 12 h.
For the sol–gel combustion method, high purity Ca(NO3)24H2O (2.000 g, 0.008470 mol, 99%, Sigma), Mn(NO3)2 (1.288 g, 0.007198 mol, 99.98%, Alfa Aesar), and RuO2 (0.169 g, 0.00127 mol, 99.9%, Sigma) were dissolved in deionised water (20 cm3, resistivity = 18.2 MΩ cm) with stirring. High purity ethylenediaminetetraacetic acid (EDTA, 4.949 g, 0.01693 mol, 99%, Sigma) and citric acid (3.254 g, 0.01693 mol, 99.8%, Fisher) were added to the solution, which was then heated until the material formed a gel (typically 4 h); the gel was then heated at 350 °C for 3 h. The resulting powder was then ground and reheated twice, first at 600 °C for 12 h and then finally at 800 °C for 12 h.
Powder X-ray diffraction (PANalytical Xpert Pro) was used to characterise the final catalysts (λ = 1.5406 Å). This involved the determination of the phase purity, the structure of the material, and an estimation of the particle size; the latter was calculated using the Scherrer equation.22 Lattice parameters were calculated using the software Unit Cell (last updated 1998, Holland and Redfern).
Electronic conductivity measurements
The samples were first pressed into pellets and sintered at 1350 °C. Four Pt electrodes were then attached to the pellet using Pt paste and heated to 1000 °C to ensure bonding to the sample. The temperature of the assembly was then decreased to 350 °C for 12 h to ensure full oxygenation. Conductivities (σ/S cm−1) of the samples were then measured at room temperature to 750 °C with 50 °C steps using the 4-probe d.c. method23 and calculated using eqn (1): | (1) |
Catalyst ink preparation
The catalyst to be electrochemically tested was first ground into a fine powder by ballmilling at 350 rpm for 2 h in propanol (Fritsch Pulveriseette 7 Planetary Ballmill). Samples (18.5 mg) were then suspended in propan-2-ol (6.00 cm3) containing Nafion 117 dispersion (0.10 cm3 of supplied dispersion, which is a 5% dispersion in lower aliphatic alcohols, Alfa Aesar). The resulting ink was shaken (by hand) before a 5 mm3 sample was taken and dropped onto the surface of a dry rotating Pt-ring glassy-carbon-(GC)-disk electrode (Ametek, UK, disk area = 0.2475 cm2, ring inner diameter ∅ = 0.625 cm, ring outer ∅ = 0.792 cm) that had been cleaned as described below. The ink was allowed to dry and then the dropping procedure was repeated a further 3 times. The following catalysts were used for benchmarking: Vulcan XC-72R carbon powder (Pt-free benchmark), Pt/C (20% m/m Pt, HiSPEC 3000, Alfa Aesar) and Pt black (HISPEC 1000, Alfa Aesar).Electrochemical procedure
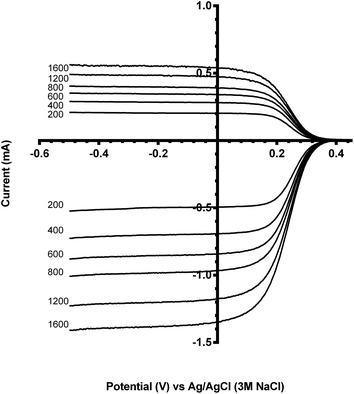
All electrochemical experiments with the rotating ring-disk electrodes (RRDE) were conducted using an IviumStat bipotentiostat (supplied by Alvatek, UK). This instrument also contained an internal impedance analyser. The instrument was controlled using IviumSoft software (version 1.831). The RRDEs rotation rates were controlled using a Pine rotator (supplied by Ametek). Polished, cleaned, and catalyst-ink-free Pt-ring Pt(polycrystalline)-disk (Ametek, UK, disk area = 0.1642 cm2, ring inner ∅ = 0.493 cm, ring outer ∅ = 0.538 cm) and Pt-ring glassy-carbon(GC)-disk RRDEs were used in control experiments.The RRDEs were polished by gently moving in a figure of eight pattern on a Rayon Microcloth disk (Buehler) coated with an alumina slurry (particle size < 0.05 μm) and then thoroughly rinsed with distilled water. The collection efficiency (N) of each RRDE was determined by submerging in a solution of potassium ferricyanide (K3Fe(CN)6, 10 mmol dm−3) in aqueous KCl (0.5 mol dm−3) and sweeping the disk potential between 0.5 V and −0.5 V vs. Ag/AgCl (3 mol dm−3 NaCl internal solution) reference electrode at a sweep rate = 10 mV s−1; the ring potential was set at 0.6 V vs. Ag/AgCl (3 mol dm−3 NaCl). N was measured for each RRDE rotation rate used. The RRDEs were submerged in deionised water, when not in use.
The electrolyte used for the RRDE ORR studies was an aqueous solution of KOH (1 mol dm−3, analytical grade, Fluka) and was used as supplied. The KOH electrolyte (90 cm3) was placed in a single compartment jacketed glass cell at 26 °C and purged with N2 (99.999%, BOC) for 3 h to ensure the complete removal of CO2 from the solution. After purging, the RRDE under study (polished as described above) was electrochemically cleaned by cycling between −1 and +0.5 V vs. Ag/AgCl until reproducible voltammograms were obtained. Before the first ORR measurements, the aqueous solution was purged with O2 for 1 h to achieve full O2-saturation. The O2 purge pipe was then removed from the solution, but was left above the solution for the duration of the subsequent electrochemical measurement to ensure a blanket of oxygen above the electrolyte solution (without disturbing the electrolyte surface).
The RRDE under study (with/without addition of catalyst ink) was immersed into the O2 saturated aqueous solution along with a Hg/HgO (1 mol dm−3 KOH internal solution, Analytical grade, Fluka) reference electrode and a Pt wire counter electrode (surface area significantly larger than the area of the RRDE disk working electrode, length = 50 cm and ∅ = 0.05 cm). Immediately after immersion of the test RRDE into the solution, an impedance test (frequency range 10![[thin space (1/6-em)]](https://www.rsc.org/images/entities/char_2009.gif) 000–1000 Hz, voltage perturbation rms amplitude = 10 mV) was recorded to determine the uncompensated iR-correction required. The RRDE test was performed with rotation rates in the range 200–1600 rpm. The reduction of O2 was carried out by sweeping the disk potential from +0.2 to −1.0 V vs. Hg/HgO (1 mol dm−3 KOH) at various scan rates (see figure captions); the ring potential was held at +0.2 V vs. Hg/HgO (1 mol dm−3 KOH).
000–1000 Hz, voltage perturbation rms amplitude = 10 mV) was recorded to determine the uncompensated iR-correction required. The RRDE test was performed with rotation rates in the range 200–1600 rpm. The reduction of O2 was carried out by sweeping the disk potential from +0.2 to −1.0 V vs. Hg/HgO (1 mol dm−3 KOH) at various scan rates (see figure captions); the ring potential was held at +0.2 V vs. Hg/HgO (1 mol dm−3 KOH).
Results and discussion
Powder XRD characterisation
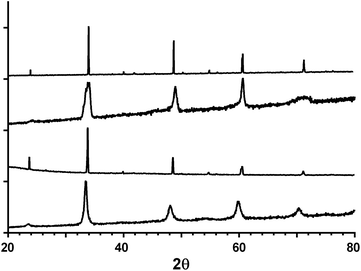
Fig. 1 shows the powder XRD profiles for the CaMn1−xRuxO3 series synthesised by the two different methods. The catalyst materials are phase pure and the peaks correspond to an orthorhombic cell with a Pnma space group. The calculated lattice parameters are summarised in Table 2. The cell parameters were not calculated for the sol–gel samples due to the broadness of the peaks, which makes reliable calculation of the small orthorhombic distortion difficult.| Composition | a (Å) | b (Å) | c (Å) | Cell volume (Å3) | Estimated average particle size (nm) |
|---|---|---|---|---|---|
| CaMnO3 (solid state) | 5.2812(4) | 7.4620(4) | 5.2761(7) | 207.92(2) | 113 |
| CaMnO3 (sol–gel) | — | — | — | — | 13 |
| CaMn0.85Ru0.15O3 (solid state) | 5.3116(4) | 7.4915(4) | 5.2892(7) | 210.46(2) | 67 |
| CaMn0.85Ru0.15O3 (sol–gel) | — | — | — | — | 14 |
There is an increase in the unit cell volume on doping with Ru with both synthesis methods. This increase is due to the increase in size of Ru4+ (radius r = 76 pm, coordination number CN = 6) compared to Mn4+ (r = 67 pm, CN = 6) along with the partial reduction of Mn4+ to Mn3+ (r = 72 pm, CN = 6). Smaller particle sizes are generally more beneficial for electrochemical purposes mainly due to increased specific (and electrochemically active) surface areas. The XRD data clearly shows that the sol–gel technique produced materials that yielded wider peaks compared to the materials produced using the solid state method. The data from the (1 0 1), (1 2 1), (2 0 2) and (0 4 2) peaks in Fig. 1 were used for Scherrer equation analysis. Even when considering the limitations of the equation,22 the data (Table 2) indicates that the sol–gel method produced catalysts with smaller particle sizes. Hence, the sol–gel samples were selected for use in the electrochemical RRDE tests detailed below.
Electronic conductivity
A good electrical conductivity is needed for a catalyst to have a high performance in an electrochemical device. A “standard” perovskite catalyst that is currently used in electrochemical devices is La1−xSrxMnO3 (LSM) which typically exhibits conductivities in the range 7–284 mS cm−1:5 this is comparable to the undoped CaMnO3 catalysts produced in this study. As seen in Fig. 2, the conductivity significantly increases on doping with Ru: this is a result of the partial reduction of the Mn4+ → Mn3+ yielding a mixed valency. In addition, the incorporation of Ru into the system doesn't hinder the electronic transport properties of the Mn–O network. Note that the conductivities could only be reliably measured for the solid state materials as the high sintering temperature required in the pellet making process enlarges the particle sizes of the sol–gel prepared samples.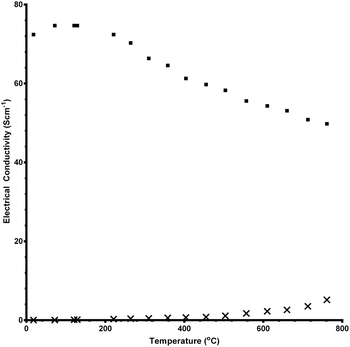 | ||
| Fig. 2 Electronic conductivity data between room temperature and 750 °C for CaMn1−xRuxO3 synthesised using the solid state method. (x = 0 data = crosses and x = 0.15 data = squares). | ||
Electrochemical studies
There are two reaction pathways that can occur for the ORR at the cathode of a fuel cell:| O2 + 2H2O + 4e− → 4OH− (n = 4e− ORR pathway) | (2) |
| O2 + H2O + 2e− → HO2− + OH− (n = 2e− ORR pathway) | (3) |
The more efficient (desirable) reaction mechanism is the 4-electron reduction which occurs on Pt catalysts (in acid and alkaline media) to produce water (eqn (2)). However there is a competing mechanism, the 2-electron process, which produces undesirable peroxide species (eqn (3)). Not only is this process electron inefficient (each O2 molecule only reacts with 2e−) but the generation of peroxide species (and potentially the very damaging HO˙ and HOO˙ radicals) can be detrimental to (lead to degradation of) the catalyst and other device components, especially polymeric components (including fully fluorinated types).
There are a couple of methods that can be used to determine the number of e− consumed (n) in an ORR reaction. Both involve the use of rotating electrode hydrodynamic voltammetry. Method 1 involves a rotating disk electrode (RDE) and a potentiostat: the number of electrons transferred is calculated using Koutecky–Levich (K–L) analysis. This method involves less complex and less expensive equipment but is most suited only to simple catalysts, such as metallic Pt and Au: K–L analysis does not always give the correct n value (as well as not being able to directly determine the amount of peroxide species produced) with more complex catalysts that contain transition metal centres that can undergo internal redox processes and that can cause interferences/uncertainties with the RDE disk areas due to the application of the catalyst layers (validated methods, that are required for determining the precise electrochemically active surface areas needed for further analyses [such as full Tafel plot analysis and determination of specific activities], may also not be available for more complex catalysts). Hence, Method 2 was selected for evaluating the catalysts produced in this study, which uses a rotating ring-disk electrode (RRDE) and a bipotentiostat (controls the potential of the disk and ring independently, whilst simultaneously recording the currents at the ring and disk): the currents recorded at both the ring and the disk are used to calculate peroxide yield. Note that K–L analysis can still be attempted when using RRDEs.
Before conducting experiments on the catalysts, to determine the amount of peroxide formed from the ORR, the collection efficiency (N) of the ring electrode must first be calculated. There are two methods for achieving this: one is theoretical and the second is experimental. Generally the experimental method is preferred (and used in this study) as the theoretical method requires the precise dimensions of the electrode, which are generally unknown due to the machining process used and changes brought on from the polishing and cleaning regimen and the ink deposition process. To experimentally measure N, a well-known redox system, such as the ferrocyanide/ferricyanide system (a simple, single electron, and reversible couple), is used. When the voltage of the disk is swept to negative values (the ring is held at a constant potential), the ferricyanide is reduced at the disk to ferrocyanide, which is then swept to the ring where it is oxidised back into ferricyanide (eqn (4) and eqn (5)):
| Reduction at disk: Fe(CN)63− + e− → Fe(CN)64− | (4) |
| Oxidation at ring: Fe(CN)64− → Fe(CN)63− + e− | (5) |
Not all of the ferrocyanide contacts with the ring: the ratio between the ring and disk limiting currents is the collection efficiency N (Fig. 3 and eqn (6)):
| N = 100% × (−IR/ID) | (6) |
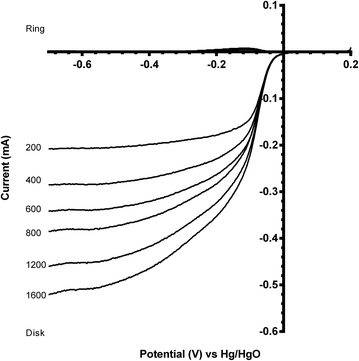
Benchmarking experiments were performed on a number of standard Pt catalysts deposited on the disk of a Pt-ring GC-disk RRDE. Control experiments involved measurements with a Pt-ring Pt(polycrystalline)-disk electrode to determine whether the experimental method produced the expected 4-electron ORR. Fig. 4 shows the ORR voltammograms for the Pt-ring Pt-disk control RRDE. Using this data, along with the prior measured collection efficiency, the percentage peroxide produced and the electron transfer (n) number were calculated using eqn (7) and eqn (8):24
 | (7) |
 | (8) |
As seen in Fig. 4, the ring currents are very low, which indicate very little peroxide generation, with n values approaching 4 (see Table 3). These values are expected with a polycrystalline Pt-disk electrode, which indicates that this technique is valid.
| Electrode | % peroxide, mean ± std dev. (sample size) | n, mean ± std dev. (sample size) | Onset potential at −0.05 mA |
|---|---|---|---|
| a Catalyst ink deposited on the GC-disk of a Pt-ring GC-disk RRDE. b Data for these catalysts after degradation. c Data for 200 rpm only. | |||
| Pt-disk (Pt-ring Pt-disk RRDE) | 2.5 ± 0.87(6) | 3.95 ± 0.02(6) | −0.05c |
| GC-disk (Pt-ring GC-disk RRDE) | 71.5 ± 6.24(6) | 2.57 ± 0.12(6) | −0.271c |
| Vulcan XC-72R carbon blacka | 70.7 ± 5.92(6) | 2.59 ± 0.12(6) | −0.139c |
| Pt/C (20% m/m Pt)a | 21.1 ± 1.26(6) | 3.58 ± 0.03(6) | −0.007c |
| Platinum blacka | 22.9 ± 3.13(6) | 3.54 ± 0.06(6) | 0.032c |
| CaMnO3a,b | 41.1 ± 3.19(6) | 3.18 ± 0.06(6) | −0.256c |
| CaMn0.85Ru0.15O3a,b | 47.8 ± 3.03(6) | 3.04 ± 0.06(6) | −0.235c |
| CaMnO3/Vulcan XC-72Ra,b | 36.7 ± 3.04(6) | 3.27 ± 0.06(6) | −0.235c |
| CaMn0.85Ru0.15O3/Vulcan XC-72Ra,b | 41.1 ± 2.44(6) | 3.18 ± 0.05(6) | −0.235c |
| CaMnO3 before degradationa | 31.4c | 3.37c | −0.232c |
| CaMn0.85Ru0.15O3 before degradationa | 50.83c | 2.98c | −0.202c |
| CaMnO3/Vulcan XC-72R before degradationa | 27.4c | 3.45c | −0.091c |
| CaMn0.85Ru0.15O3/Vulcan XC-72R before degradationa | 36.9c | 3.26c | −0.106c |
A comparison of the ORR polarisation curves for the control Pt-ring GC-disk RRDE (without added catalysts) and the Pt-ring GC-disk benchmark RRDE where the GC-disk was coated with a catalyst ink containing Vulcan XC-72R carbon black powder (0.07 mg) are presented in Fig. 5. The onset potentials increased to more positive values with the Vulcan. This improvement can be attributed to the higher specific surface area and the different surface functionalisation of the Vulcan, compared to the blank GC-disk, resulting in a higher number of active sites. However, while the onset potential increased, the % peroxide yield and n value were the same (Table 3).
The two standard benchmark Pt catalysts studied were Pt/C (20% m/m Pt, 0.07 mg catalyst on the electrode) and Pt black (0.07 mg catalyst on the electrode). Fig. 6 shows that the Pt black has a more positive onset potential compared to the Pt/C, which was expected due to the increased amount of Pt in the pure Pt black (less interference due to the absence of carbon black support, which, as shown above, yields closer to n = 2e− ORR) and a particle size effect (larger Pt particle size for the Pt black). The n values for both Pt benchmark catalysts were comparable (Table 3) at n > 3.5 (there is still the GC disk causing an n = 2 competitive reaction – only the Pt-ring Pt-disk electrode with no carbon in the electrode approaches n = 4 as discussed above).
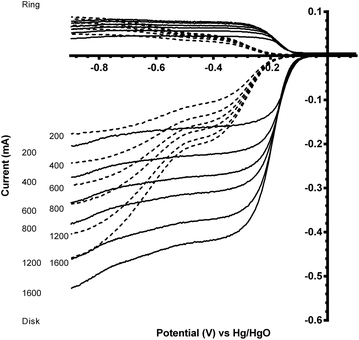
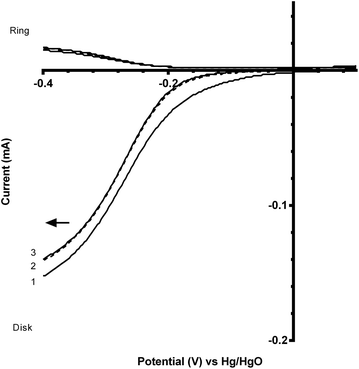
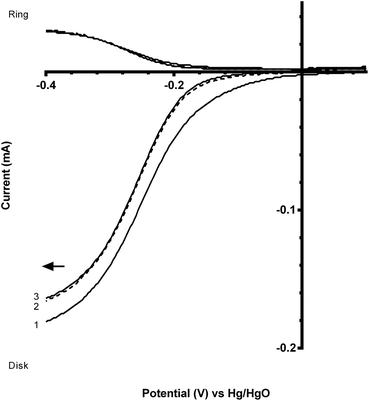
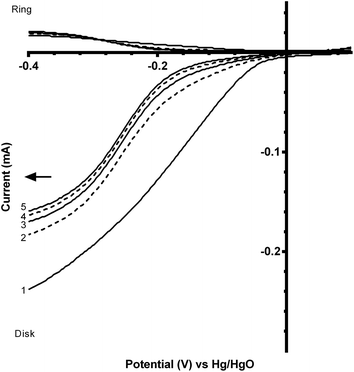
Fig. 7 and 8 shows the ORR voltammograms for the CaMnO3 and CaMn0.85Ru0.15O3 sol–gel catalysts after a number of sequential scans: this experiment was to probe the stability of the catalysts. Each scan was conducted at the same rotation and scan rate. There was a rapid decline in the onset potential (shifted to more negative potentials) with a final stabilisation after the 3rd or 4th sequential scan. The percentage of potential loss at −0.1 mA for both catalysts were calculated using eqn (9):25
 | (9) |
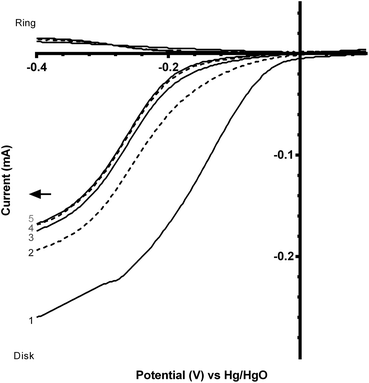
| Cycle | CaMnO3 | CaMnO3 + Vulcan | CaMn0.85Ru0.15O3 | CaMn0.85Ru0.15O3 + Vulcan |
|---|---|---|---|---|
| 1 | 0 | 0 | 0 | 0 |
| 2 | 5 | 82 | 8 | 52 |
| 3 | 5 | 101 | 8 | 63 |
| 4 | — | 106 | — | 67 |
| 5 | — | 108 | — | 67 |
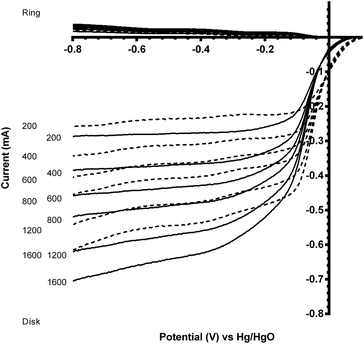
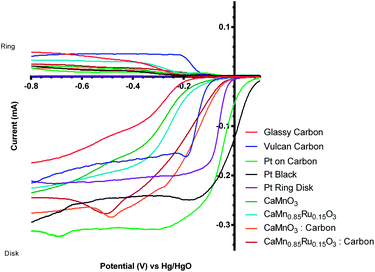
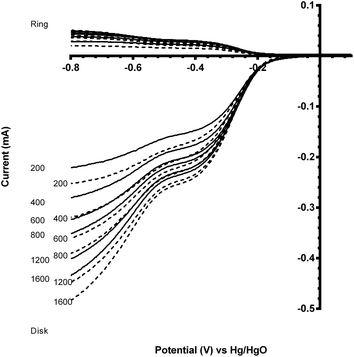
Before this catalyst degradation, the beginning-of-life onset potentials were superior to the GC-disk control but were inferior to that of the Vulcan XC-72R carbon black benchmark. Despite this poor onset potential performance measure, the % peroxide yield were lower and the n values were greatly improved (Table 3). The comparison between the Ru-doped and the undoped sol–gel catalysts were as expected (Fig. 9). The onset potential was more positive on doping with the small amount of the precious metal Ru (used in the past as a co-metal in Pt-alloy anode catalysts in low temperature direct methanol fuel cells and with fuel cells fuelled with reformed H2 that contained traces of CO). In addition, the electrical conductivity of the Ru-doped catalyst is significantly increased compared to the undoped example: this will lead to less ohmic drops inside the catalyst layer.
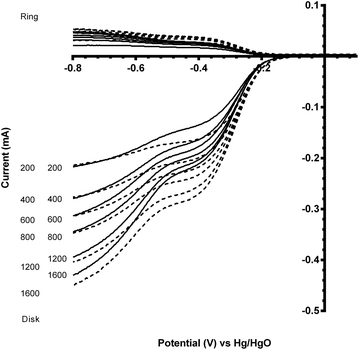 | ||
| Fig. 9 Voltammograms for the ORR in O2-saturated aqueous KOH (1 mol dm−3) electrolyte with the degraded CaMn1−xRuxO3 [x = 0 (solid) and 0.15 (dashed)] sol–gel catalysts (studied after 3 voltammetric sweeps – refer to Fig. 7). Scan rate = 5 mV s−1 with rotation rates of 200, 400, 600, 800, 1200 and 1600 rpm. | ||
The perovskite catalysts were also tested with the addition of Vulcan XC-72R carbon powder (5![[thin space (1/6-em)]](https://www.rsc.org/images/entities/char_2009.gif) :
:![[thin space (1/6-em)]](https://www.rsc.org/images/entities/char_2009.gif) 1 mass ratio of CaMn1−xRuxO3
1 mass ratio of CaMn1−xRuxO3![[thin space (1/6-em)]](https://www.rsc.org/images/entities/char_2009.gif) :
:![[thin space (1/6-em)]](https://www.rsc.org/images/entities/char_2009.gif) Vulcan) to see the effect of the addition of a more electronically conductive component. However, the addition of the carbon black component led to an enhanced (undesirable) loss of onset potential over several sequential potential sweeps, compared to the catalysts in the absence of carbon black (Fig. 10 and 11 and Table 4). From the data shown in Table 4 there is a significant decrease in the loss of onset potential when doped with Ru. This is hypothesised to be due to the Ru stabilising the structure of the catalyst. As the ORR is predominantly n = 2e− on Vulcan XC-72 (see Table 3), this result provides further corroboratory evidence that the presence of peroxide is a primary cause of this degradation in onset potentials over the first few voltammetry sweeps with these inorganic catalysts.
Vulcan) to see the effect of the addition of a more electronically conductive component. However, the addition of the carbon black component led to an enhanced (undesirable) loss of onset potential over several sequential potential sweeps, compared to the catalysts in the absence of carbon black (Fig. 10 and 11 and Table 4). From the data shown in Table 4 there is a significant decrease in the loss of onset potential when doped with Ru. This is hypothesised to be due to the Ru stabilising the structure of the catalyst. As the ORR is predominantly n = 2e− on Vulcan XC-72 (see Table 3), this result provides further corroboratory evidence that the presence of peroxide is a primary cause of this degradation in onset potentials over the first few voltammetry sweeps with these inorganic catalysts.
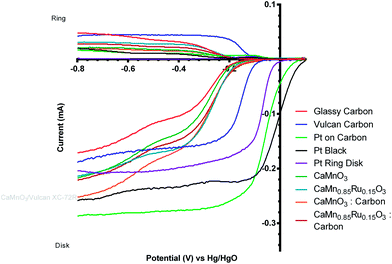
It would be highly desirable if these catalysts could be developed so that they are resistant to this peroxide-derived degradation: this is because of the observed and desirable increase in the onset potential (more positive) with the pre-degradation perovskite/carbon mixed catalyst compared to the separate unmixed Vulcan and inorganic catalysts (see Fig. 12 presenting the 1st voltammetric sweep data) and the increase in the n value towards the target n = 4 (Table 3) on addition of the Vulcan.
However, the comparison of the two degraded perovskite/carbon mixed catalysts (after 5 voltammetric sweeps) was surprising (Fig. 13). It was expected that the onset potential would follow the same trend as observed with the carbon-free catalysts, i.e. the Ru doped catalyst having a more positive onset potential. However when mixed with the Vulcan carbon, the Ru-containing and the Ru-free sol–gel catalysts had similar onset potentials, while the Ru-free catalyst had an n value closer to 4. In addition, when comparing the post-degradation performances of the CaMnO3/Vulcan and the C-free CaMn0.85Ru0.15O3 catalysts, the onset potentials were surprisingly similar (Fig. 14). Catalyst degradation clearly represents a major interference towards the evaluation of the perovskite catalysts' electrochemical performance.
As stated earlier, Koutecky–Levich (K–L) analysis method can be used to determine the electron transfer of simple (e.g. well defined metallic) catalysts. The two controls used were a Pt-ring Pt-disk RRDE and a Pt-ring GC-disk RRDE both without application of any catalyst ink: it is known that the Pt disk should yield n = 4 and the GC disk an n value closer to 2. Eqn (10) gives the K–L equation for a rotating ring disk electrode:26,27
 | (10) |
![[thin space (1/6-em)]](https://www.rsc.org/images/entities/char_2009.gif) 485 C mol−1), D = the O2 diffusion coefficient (taken here as = 2.04 × 10⁻⁵ cm2 s−1), ν = kinematic viscosity (taken here as = 0.01 cm2 s−1), ω = rotation rate (rad s−1), Co = bulk concentration of O2 (taken here as = 7.8 × 10⁻⁷ mol cm−3), and A = disk area (Pt-ring GC-disk RRDE = 0.2475 cm2 and Pt-ring Pt-disk RRDE = 0.1642 cm2). Using a modified version of eqn (10) (eqn (11)), the n values can be calculated from the gradient of the slopes in Fig. 15:
485 C mol−1), D = the O2 diffusion coefficient (taken here as = 2.04 × 10⁻⁵ cm2 s−1), ν = kinematic viscosity (taken here as = 0.01 cm2 s−1), ω = rotation rate (rad s−1), Co = bulk concentration of O2 (taken here as = 7.8 × 10⁻⁷ mol cm−3), and A = disk area (Pt-ring GC-disk RRDE = 0.2475 cm2 and Pt-ring Pt-disk RRDE = 0.1642 cm2). Using a modified version of eqn (10) (eqn (11)), the n values can be calculated from the gradient of the slopes in Fig. 15: | (11) |
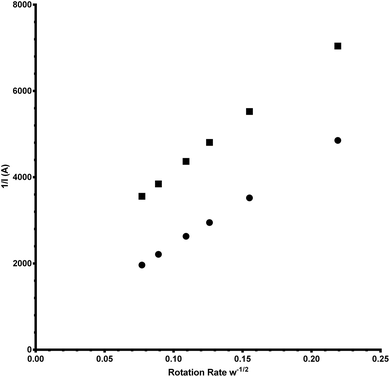 | ||
| Fig. 15 Koutecky–Levich (K–L) plots for the Pt-ring Pt-disk (circles) and the Pt-ring GC-disk (squares) control RRDEs. | ||
The gradients were = 20![[thin space (1/6-em)]](https://www.rsc.org/images/entities/char_2009.gif) 300 and 24
300 and 24![[thin space (1/6-em)]](https://www.rsc.org/images/entities/char_2009.gif) 600 A rad−1/2 s1/2 respectively for Pt and GC.
600 A rad−1/2 s1/2 respectively for Pt and GC.
Table 5 shows the comparison between the K–L and the ring- vs. disk-current RRDE methods for all electrodes and catalysts studied. As can be seen, the K–L analysis provides a reasonable agreement to the RRDE method for the Pt-ring Pt(polycrystalline)-disk and Pt-ring GC-disk RRDE control electrodes. There is also reasonable agreement with the catalyst inks where the K–L method tends to produce larger n values than the RRDE method (with the exception of the Pt black and carbon-only experiments). These results highlight the usefulness of using the ring-current vs. disk-current (eqn (8)) method for elucidating the number of electrons used per O2 molecule for the ORR reaction: this is especially true for complex catalysts (such as the perovskite types discussed in this study), especially where there are no satisfactory validated methods for determining the appropriate specific surface areas of the (powdered) electrocatalyst to use in further analyses of the K–L data.
| RRDE | n K–L | n RRDE |
|---|---|---|
| Pt-ring Pt disk | 4.04 | 3.95 |
| Pt-ring GC-disk | 2.19 | 2.57 |
| Vulcan XC-72R carbon black | 2.09 | 2.59 |
| Pt/C (20% m/m Pt) | 3.72 | 3.58 |
| Platinum black | 3.28 | 3.54 |
| CaMnO3 | 3.43 | 3.18 |
| CaMn0.85Ru0.15O3 | 3.22 | 3.04 |
| CaMnO3/Vulcan XC-72R | 3.96 | 3.27 |
| CaMn0.85Ru0.15O3/Vulcan XC-72R | 3.32 | 3.18 |
Conclusions
CaMn1−xRuxO3 (x = 0 and 0.15) were compared to benchmark platinum and carbon fuel cell catalysts for use as cathode catalysts in alkaline fuel cells (including alkaline polymer electrolyte fuel cells). These tests were performed using rotating ring disk electrode (RRDE) oxygen reduction reaction (ORR) voltammetry in aqueous KOH (1 mol dm−3) solution. The method was validated by measurements with catalyst-ink-free RRDEs containing platinum and glassy carbon disks (which gave the expected ORR electron transfer numbers of n = 4 and 2 respectively).The benchmark catalysts exhibited higher onset potentials (due to their increased surface areas). The less than expected n < 4e− observed for the inks containing the Pt-based catalysts was due to (n ≈ 2) interferences from the carbon supports and the glassy carbon disk of the RRDE.
The initial (1st sweep data) measurements with the CaMn1−xRuxO3 catalysts (synthesised using the sol–gel method) yielded an increase in onset potentials compared to the glassy-carbon (GC) disk-only RRDE. With the further addition of Vulcan XC-72R to the CaMn1−xRuxO3 catalysts, the onset potential further increased (more positive) due to the larger area of interface between the CaMn1−xRuxO3 catalysts and the carbon “support”. The trend in onset potentials (1st sweep data) increased (from negative to more positive) in the order: GC disk control < CaMnO3 < CaMn0.85Ru0.15O3 < Vulcan XC-72R benchmark < CaMn0.85Ru0.15O3 + Vulcan < CaMnO3 + Vulcan < Pt disk control < Pt/C (20% mass Pt) benchmark < Pt black benchmark.
However further doping experiments are needed to stabilise these solid state catalysts as there is a severe reduction (negative shift) in the onset potential on further cycling after the 1st sweep data. After 3–5 sweeps of degradation, the revised trend in onset potentials is changed to: GC disk control < CaMnO3, CaMn0.85Ru0.15O3 < CaMn0.85Ru0.15O3 + Vulcan < CaMnO3 + Vulcan < Vulcan XC-72R benchmark < Pt disk control < Pt/C benchmark < Pt black benchmark. This decrease was due to the hypothesised degradation of the catalysts in the alkaline conditions with the presence of (electro-generated) peroxide.
Even though the trend for the onset potentials changed on degradation of the catalysts, the trend in ORR electron transfer numbers stayed the same for both the pre- and post-degraded CaMn1−xRuxO3 catalysts. The observed trend in n was: GC disk control < Vulcan XC-72R benchmark < CaMn0.85Ru0.15O3 < CaMn0.85Ru0.15O3/Vulcan XC-72R < CaMnO3 < CaMnO3/Vulcan XC-72R < Pt black benchmark < Pt/C benchmark < Pt disk control.
Acknowledgements
The authors thank the UK's Engineering & Physical Sciences Research Council (EPSRC) for funding (grants EP/I004882/1 and EP/G009929/2). The IviumStat bipotentiostat used was purchased using funding from EPSRC grant EP/H019480/1 (SuperGen Biological Fuel Cells consortium).Notes and references
- C. S. Song, Catal. Today, 2002, 77, 17 CrossRef CAS.
- H. Rogers, Oxf. Rev. Econ. Pol., 2011, 27, 117 CrossRef.
- A. B. Stambouli and E. Traversa, Renewable Sustainable Energy Rev., 2002, 6, 433 CrossRef CAS.
- G. Merle, M. Wessling and K. Nijmeijer, J. Membr. Sci., 2011, 377, 1 CrossRef CAS PubMed.
- J. Tulloch and S. W. Donne, J. Power Sources, 2009, 188, 359 CrossRef CAS PubMed.
- A. Morozan, B. Jousselme and S. Palacin, Energy Environ. Sci., 2011, 4, 1238 CAS.
- N. M. Markovic, T. J. Schmidt, V. Stamenkovic and P. N. Ross, Fuel Cells, 2001, 1, 105 CrossRef CAS.
- L. Qui, T. Ichikawa, A. Hirano, N. Imanishi and Y. Takeda, Solid State Ionics, 2003, 158, 55 CrossRef.
- A. Tarancon, S. J. Skinner, R. J. Chater, F. Hernandez-Ramirez and J. A. Kilner, J. Mater. Chem., 2007, 17, 3175 RSC.
- P. Plonczak, M. Gazda, B. Kusz and P. Jasinski, J. Power Sources, 2008, 181, 1 CrossRef CAS PubMed.
- Y. Shimakawa, Inorg. Chem., 2008, 47, 8562 CrossRef CAS PubMed.
- S. J. Skinner, Int. J. Inorg. Mater., 2001, 3, 113 CrossRef CAS.
- R. H. E. Van Doorn and A. J. Burggraaf, Solid State Ionics, 2000, 128, 65 CrossRef CAS.
- G. J. K. Acres, J. Power Sources, 2001, 100, 60 CrossRef CAS.
- K. Xie, Y. Q. Zhang, G. Y. Meng and J. T. S. Irvine, J. Mater. Chem., 2011, 21, 195 RSC.
- J. Molenda, K. Swierczek and W. Zajac, J. Power Sources, 2007, 173, 657 CrossRef CAS PubMed.
- K. Damen, M. van Troost, A. Faaij and W. Turkenburg, Prog. Energy Combust. Sci., 2006, 32, 215 CrossRef CAS PubMed.
- T. Kawada, K. Masuda, J. Suzuki, A. Kaimai, K. Kawamura, Y. Nigara, J. Mizusaki, H. Yugami, H. Arashi, N. Sakai and H. Yokokawa, Solid State Ionics, 1999, 121, 271 CrossRef CAS.
- S. B. Adler, Solid State Ionics, 1998, 111, 125 CrossRef CAS.
- T. Hyodo, M. Hayashi, S. Mitsutake, N. Miura and N. Yamazoe, J. Appl. Electrochem., 1997, 27, 745 CrossRef CAS.
- Y. Kiros, C. Myren, S. Schwartz, A. Sampathrajan and M. Ramanathan, Int. J. Hydrogen Energy, 1999, 24, 549 CrossRef CAS.
- A. L. Patternson, Phys. Rev., 1939, 56, 978 CrossRef.
- W. S. Wang and A. V. Virkar, Sens. Actuators, B, 2004, 98, 282 CrossRef CAS PubMed.
- J. Sunarso, A. A. J. Torriero, W. Zhou, P. C. Howlett and M. Forsyth, J. Phys. Chem. C, 2012, 116, 5827 CAS.
- B. Kumar, M. Llorente, J. Froehlich, T. Dang, A. Sathrum and C. P. Kubiak, Annu. Rev. Phys. Chem., 2012, 63, 541 CrossRef CAS PubMed.
- S. Treimer, A. Tang and D. C. Johnson, Electroanalysis, 2002, 14, 165 CrossRef CAS.
- C. H. Hamann, A. Hamnett and W. Vielstich, Electrochemistry, Wiley-VCH, Germany, 2nd edn, 2007, pp. 193–197 Search PubMed.
| This journal is © The Royal Society of Chemistry 2014 |

