
 Open Access Article
 This Open Access Article is licensed under a
 Creative Commons Attribution 3.0 Unported Licence
Microgel-like aggregates of isotactic and atactic poly(methacrylic acid) chains in aqueous alkali chloride solutions as evidenced by light scattering†
Simona
Sitar
a,
Vladimir
Aseyev
b and
Ksenija
Kogej
*a
aDepartment of Chemistry and Biochemistry, Faculty of Chemistry and Chemical Technology, University of Ljubljana, Aškerčeva 5, P.O. Box 537, SI-1001, Ljubljana, Slovenia. E-mail: ksenija.kogej@fkkt.uni-lj.si
bLaboratory of Polymer Chemistry, Department of Chemistry, University of Helsinki, P.O. Box 55, FIN-00014 HU, Helsinki, Finland
First published on 30th July 2014
Abstract
A comparative light-scattering study of isotactic and atactic poly(methacrylic acid), iPMA and aPMA, respectively, in aqueous solutions with added alkali chlorides, XCl (X = Li, Na, Cs), at 25 °C and XCl concentration of 0.1 mol L−1, demonstrates that both PMA isomers are strongly associated at low degrees of neutralization, αN (= 0 for aPMA and 0.25 for iPMA), in the presence of all XCls. The shape parameter ρ and the scattering functions suggest that aggregates have the characteristics of microgel particles, with a dense core surrounded by a less dense shell. The extent of aggregation depends on the stereoregular structure of the polymer and on the type of the added cation. Li+ and Na+ ions support aggregation better than Cs+ ions. Besides, iPMA chains are more strongly aggregated than aPMA chains and form particles with a denser core. A model of the aggregation process is suggested for iPMA. At high αN, a slow diffusive process (so-called extraordinary or anomalous mode in diffusion of polyelectrolytes), arising from electrostatic interactions between charged chains, is observed for both PMAs. Results suggest that under the same experimental conditions iPMA is effectively more charged than aPMA. The role of ions in the slow-mode phenomenon is less pronounced than in aggregation.
Introduction
Polyelectrolytes often self-organize into large-scale structures by electrostatic and other forces that can be directed by various parameters, e.g. by polyion charge, the presence of other charged species in solution (from small and more mobile ions to surfactant ions and colloids), temperature, solvent, etc. The ability to control intermolecular association between polyelectrolyte chains is of great importance in nature and in various applications. A recent themed issue of Soft Matter on polyelectrolytes in biology and soft matter1 discusses the current state of the art in this field from various aspects. Although natural polyelectrolytes (DNA and RNA) have been a focus of research in recent years, synthetic polyelectrolytes with simpler structures still help to identify mechanisms on the molecular level and aid in understanding complex phenomena.Among synthetic polyelectrolytes, the weak types, like poly(methacrylic acid), PMA,2 are good candidates for studying aggregation/association phenomena, due to the fact that their charge can easily be varied by changing the pH of the medium. Furthermore, mere variation of the stereochemical structure of the polymer chain may have a strong effect on intermolecular interactions, aggregation, and solution properties in general.3 PMA is one of the simplest synthetic polymers for which solution and aggregation behaviors depend significantly on the chain tacticity.2,4–7 It has been demonstrated, for example, that the pH-induced conformational transition is reversible for so-called conventional or atactic PMA, aPMA,2,8 but irreversible for the structurally highly ordered isotactic PMA, iPMA.4,8 The underlying molecular reasons for such behavior are far from being satisfactorily explained.
In the past, research interest in PMA was mostly related to the fact that the PMA chain adopts a compact conformation at low pH (low degrees of neutralization, αN) and undergoes a conformational transition upon increasing pH (i.e. αN), which takes place on the intramolecular level. Less attention, however, was devoted to the ability of PMA to form intermolecular aggregates in aqueous solutions at low αN, even though Eliassaf et al.9,10 demonstrated already in the 1960s that the unneutralized aPMA (αN = 0) is capable of forming gel networks in concentrated aqueous solutions. Gel formation was induced either by heating9 or shearing10 of solutions. The interpretation of the shearing-induced association was that physical cross-links between the aPMA chains are more likely to be formed in flow than in a system at rest, as demonstrated both in concentrated10 and later also in more dilute conditions.11–13 On the other hand, the structurally more ordered iPMA has received considerably less attention, although it exhibits some very obvious differences in comparison with aPMA. In addition to the above-mentioned irreversible conformational transition, iPMA is insoluble in water when αN < ∼0.2 (ref. 5, 6 and 14) and exhibits a high tendency to form aggregates in aqueous solutions.6,7,13 Van den Bosch et al.6 have demonstrated that a 10 w/w% iPMA solution with αN = 0.28 very rapidly forms an elastic gel when cooled below 0 °C, whereas an opposite behavior was reported for aPMA:9 a sample of aPMA (αN = 0) with a rather high molar mass formed a gel network in concentrated solution when heated above 47 °C. Pronounced intermolecular association was also revealed by studies of very dilute iPMA solutions.7
It is well known that the properties of polyelectrolytes depend also on the nature of the ions that are present in solution. The effect of ions on the properties of proteins was recognized more than 100 years ago by Hofmeister15,16 who ranked ions in a specific series (the Hofmeister series) according to their ability to induce precipitation of proteins from water. Collins17–19 proposed a simple law of matching water affinities, LMWA, which relates these phenomena to the tendency of oppositely charged ions (groups) to form so-called contact ion pairs. These are formed if the affinity of oppositely charged ions for water, manifested through the ion's hydration enthalpy, is similar.17,19–22 In the case of polyelectrolytes, the interaction of simple ions with charged macromolecular surfaces has to be considered. Thus, in relation to PMA, Strauss23 showed that volume changes accompanying interactions of PMA with alkali metal ions depend on the ion's hydration radius. In line with the LMWA proposed later, this was attributed to the competition between hydrating water molecules and the PMA's carboxylate groups for a given cation. However, the ion-specific effects were, until now, not investigated systematically with PMA, in particular not in relation to chain tacticity. Since the carboxylate functional group is widespread in biology and in colloid chemistry, PMA may serve as a study example of the effect of ions on the stability and structure in solutions of such macromolecules.
In this contribution, we investigate the effect of alkali metal ions on aggregation/association phenomena in aqueous PMA solutions. We present a static, SLS, and dynamic light-scattering, DLS, study of both PMA isomers, isotactic and atactic, in dilute aqueous solutions at 25 °C and with increasing αN in the presence of LiCl, NaCl, and CsCl. The main objectives of the study are to identify the nature of the aggregates between PMA chains and the function of alkali metal cations in aggregation (the low αN case), and additionally to reveal their role in intermolecular interactions with increasing polyion charge (the higher αN cases). In order to achieve the first objective we determine the hydrodynamic radius, Rh, and when possible the radius of gyration, Rg, of particles in solution and, from these, their shape parameter, ρ (= Rg/Rh). To realize the second goal, light-scattering, LS, studies are extended to higher αN values (up to αN = 1) where electrostatic repulsion between polyions prevents aggregate formation, but leads to so-called anomalous diffusion of polyions (a diffusive mode in DLS). This phenomenon is described by various terms in the literature, as an extraordinary mode,24 slow mode,25,26 polyelectrolyte effect,27 or multimacroion domain or cluster formation,25,28–31 and still presents a major challenge in investigations of polyelectrolyte behavior in solutions. The slow mode stems from electrostatic repulsion between similarly charged polyions and manifests itself as an apparent diffusion coefficient in correlation functions measured by DLS. Therefore, we will use the term slow mode for this feature within this manuscript. We address all these issues in relation to chain tacticity.
Experimental section
Materials
aPMA (Polymer Source, Inc., sample no. P14096-MAA, with weight and number average molar masses Mw = 189 000 g mol−1 and Mn = 165 000 g mol−1, respectively) and iPMA (Mw = 32![[thin space (1/6-em)]](https://www.rsc.org/images/entities/char_2009.gif) 000 g mol−1, Mn = 11000 g mol−1) were the same as used previously.13 The stereoregular composition of both PMAs was determined from the NMR spectrum of the methylated forms of polyacids. The aPMA sample is rich in syndiotactic triads and the iPMA sample contains around 93% of isotactic triads. The stereoregular compositions of both PMAs are reported in Table S1 (ESI†).
000 g mol−1, Mn = 11000 g mol−1) were the same as used previously.13 The stereoregular composition of both PMAs was determined from the NMR spectrum of the methylated forms of polyacids. The aPMA sample is rich in syndiotactic triads and the iPMA sample contains around 93% of isotactic triads. The stereoregular compositions of both PMAs are reported in Table S1 (ESI†).
LiCl, NaCl and CsCl (all from Merck KGaA) were used to prepare aqueous 0.1 M XCl solutions. Solid LiOH monohydrate (Fluka Biochemica), aqueous NaOH (Fixanal, Merck KGaA) and aqueous CsOH (Riedel-de Haen) were used to prepare LiOH, NaOH and CsOH solutions, respectively. The concentration of all hydroxide solutions was determined by neutralization potentiometric titration using a standardized HCl solution.
Preparation of solutions
aPMA is soluble in water at any αN, whereas iPMA is insoluble unless ≈20% of COOH groups are ionized. The critical value of αN, denoted as αN,crit, at which iPMA dissolves in water at 25 °C is αN,crit ≈ 0.2.5,6,14 Different procedures were therefore used to prepare aPMA and iPMA solutions with various αN values, as reported previously13 and described in detail in ESI.† For setting the αN of PMAs, the XOH solution with the same cation as in the 0.1 M XCls (X) was used.Methods
LS measurements were performed in cylindrical quartz cells. Solutions were gently filtered directly into the measuring cell through hydrophilic Millex-HV filters with a pore size of 0.22 μm and a diameter of 13 mm. The initial few μL of the filtered solution were discarded. No significant loss of the polymer was observed due to filtration, which was verified by checking the intensity of scattered light from unfiltered and filtered solutions. The samples were allowed to equilibrate for 20 min before the measurement was initiated. The intensity of scattered light was collected in the angular range from 40° to 150°. All LS studies were performed at 25 °C.
Methodological aspects of DLS and SLS can be found elsewhere.33,34 At low αN (αN = 0 and 0.25 for aPMA and iPMA, respectively), the measured correlation functions were analyzed with the program CONTIN and two well-separated peaks were obtained in the distribution of the correlation times. The calculated distributions were used to split the total scattering intensity into two contributions. The resulting dynamic modes were analyzed individually in order to obtain the corresponding diffusion coefficients (and from those the hydrodynamic radii), and the radii of gyration in the case of large particles. The correlation functions for αN ≥ 0.4 (iPMA) and αN = 1 (aPMA) also exhibited two dynamic modes, a fast and a slow (extraordinary) mode (for more details see Results and discussion). In iPMA solutions, the relaxation time distributions were overlapping and CONTIN analysis was difficult. A bi-exponential fit was used instead to obtain the relaxation times for both modes. No such problem was encountered with aPMA. Details on all these procedures are described in the literature35,36 and in the ESI† accompanying this paper. Examples of data analysis are shown in Fig. S1–S3.† Representative correlation functions are given in Fig. S4a and b.†
Results
The refractive index increment
The measured dn/dcp values are reported in Table 1 and plotted in Fig. 1 in dependence on αN for visual appreciation. For aPMA in 0.1 M LiCl and NaCl they increase linearly with increasing αN, whereas in 0.1 M CsCl they decrease in the range 0 < αN < 0.5 and increase for αN ≥ 0.5. The highest dn/dcp (= 0.193 mL g−1) at αN = 0 is detected in 0.1 M CsCl. For αN > 0.2, the ranking of dn/dcp values according to the counterion present in aPMA solutions is Na+ > Li+ > Cs+.| iPMA | aPMA | ||||||||
|---|---|---|---|---|---|---|---|---|---|
| LiCl | NaCl | CsCl | α N | LiCl | NaCl | CsCl | |||
| α N | dn/dcp | α N | dn/dcp | α N | dn/dcp | dn/dcp | |||
| — | — | — | 0 | 0.148 | 0.158 | 0.193 | |||
| 0.25 | 0.246 | 0.25 | 0.223 | 0.27 | 0.194 | 0.25 | 0.162 | 0.173 | 0.129 |
| 0.35 | 0.256 | 0.34 | 0.208 | 0.36 | 0.183 | — | |||
| 0.45 | 0.246 | — | 0.45 | 0.162 | — | ||||
| 0.5 | 0.240 | 0.48 | 0.224 | — | 0.5 | 0.183 | 0.197 | 0.113 | |
| 0.57 | 0.239 | 0.58 | 0.213 | 0.58 | 0.135 | — | |||
| 0.6 | 0.240 | — | — | — | |||||
| 0.75 | 0.265 | 0.75 | 0.219 | 0.75 | 0.147 | 0.75 | 0.201 | 0.214 | 0.137 |
| 1.0 | 0.288 | 1 | 0.229 | 1 | 0.139 | 1.0 | 0.226 | 0.246 | 0.156 |
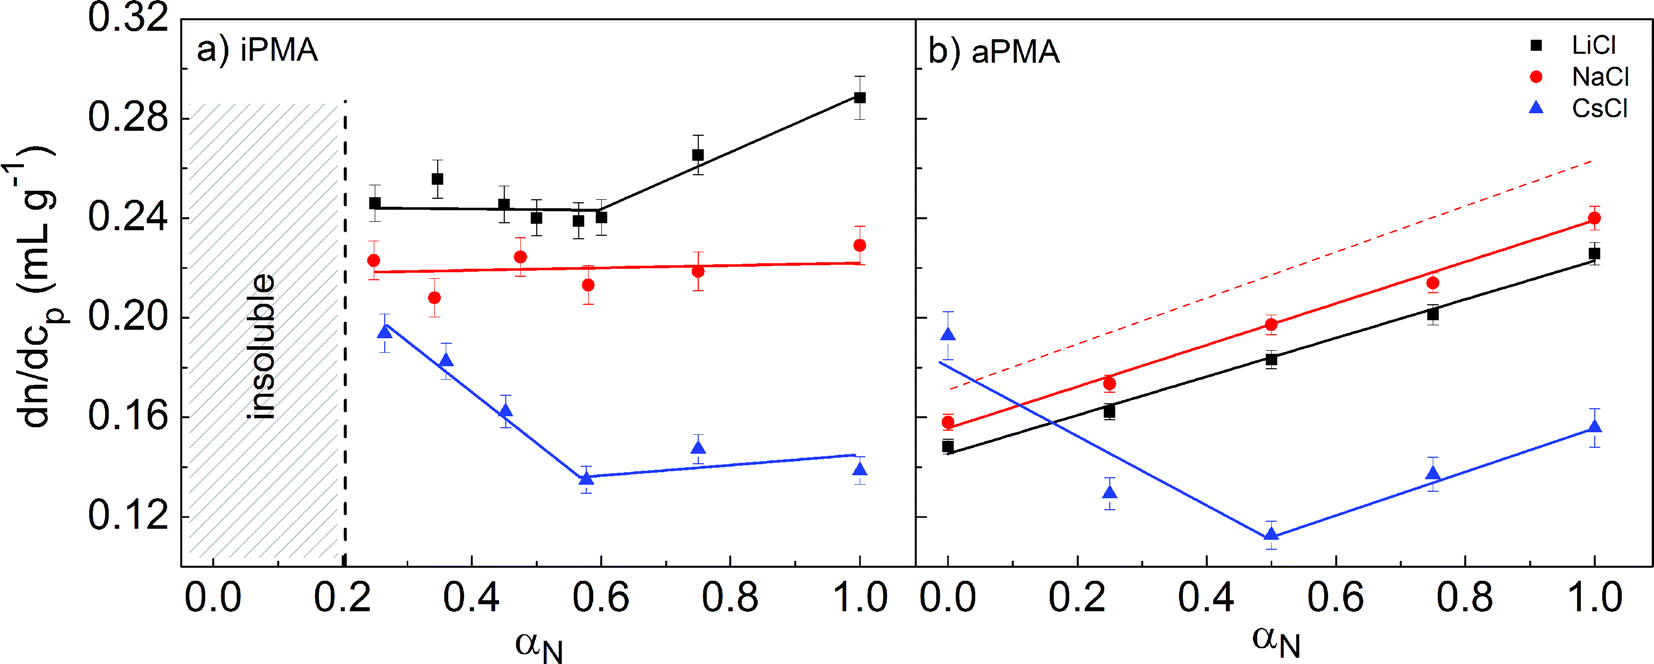 | ||
| Fig. 1 The dependence of dn/dcp on degree of neutralization, αN, in aqueous iPMA (a) and aPMA solutions (b) in the presence of 0.1 M LiCl (black squares), NaCl (red circles), and CsCl (blue triangles) at 633 nm. The dashed red line in Fig. 1b is based on the equation for the dn/dcp dependence on αN of aPMA solutions in 0.05 M NaCl at 488 nm as reported.36 The solid lines are merely guidance for the eyes. | ||
The αN dependence of the dn/dcp values for iPMA in 0.1 M CsCl is very similar to the one found for aPMA in 0.1 M CsCl, with a minimum at αN ≈ 0.5, and almost constant values for αN larger than that. In 0.1 M NaCl and LiCl, however, it is clearly different: in contrast to the linear increase in the whole αN region in the aPMA case, the dn/dcp values for iPMA are more or less constant (dn/dcp ≈ 0.22 in 0.1 M NaCl and dn/dcp ≈ 0.24 in 0.1 M LiCl for αN ≤ 0.6) and clearly increase only in 0.1 M LiCl for αN ≥ 0.6. Note also that the ranking of ions is different in comparison with aPMA: the largest dn/dcp values in the whole αN range are measured in 0.1 M LiCl, leading to the sequence Li+ > Na+ > Cs+ for iPMA solutions.
The literature data on the αN dependence of dn/dcp in aqueous PMA solutions are scarce and reported only for aPMA, sometimes called conventional PMA. Heitz et al.38 report a linear dependence in 0.05 M NaCl and at a lower wavelength (488 nm). The dn/dcp value for the acid form in that work applies to water without added NaCl. This dependence is given as a dashed red line in Fig. 1b. In our case, the line is shifted to lower values, which is expected due to the longer wavelength (633 nm) of light used in our measurements.39 To our knowledge, no literature data on dn/dcp are available for iPMA.
In spite of the fact that the parameter dn/dcp does not affect the determination of Rh and Rg, it gives important information on the optical contrast of the studied PMA isomers in aqueous solutions of alkali chlorides. Obviously, the optical contrast depends strongly on the stereoregular structure of PMA and on the type of the added cation. As discussed by Schweins et al.,37 one may picture polyelectrolyte-simple salt solutions as two-phase systems, i.e. domains of polyelectrolyte chains with an ion atmosphere of counterions and co-ions and the polyion-free part of the solution, which contains only the simple (small) ions. The concentration of simple ions is not the same in these domains, which is known as the Donnan effect. Large differences in the dn/dcp dependence on αN (i.e. on the optical contrast between the polyion domains and the salt-containing solvent) could be explained either by significantly different single chain conformations, and consequently a different distribution of counterions, or by the presence of other species, e.g. aggregates, in solution. In relation to the counterion distribution, it has been shown that the binding of Na+ ions is somewhat stronger with iPMA,7 but this difference vanishes with decreasing αN. We therefore propose that the most important contribution to the optical contrast in PMA solutions, in particular at low αN values, is provided by the interchain aggregates. Qualitatively, dn/dcp data suggest that the state of hydrated iPMA chains is different from that of hydrated aPMA chains. This will also become evident from LS results discussed in the following.
Concentration dependence
The size of single polymer chains in solution generally depends on the polymer concentration. Consequently, we start with a discussion of the effect of cp on the measured diffusion coefficient, D. We first discuss the low αN (= 0 for aPMA and 0.25 for iPMA) conditions, where multimolecular aggregates are present in solution in equilibrium with individual coils. Afterwards, the case of αN = 1 is investigated, where intermolecular association is absent, but the so-called polyelectrolyte mode sets in (for details on the discrimination between aggregation and slow mode, see the discussion in the following section). The polymer concentration range for the studies of concentration dependence was 1–3 g L−1, which is below the overlap concentration, cp*, in all cases (as estimated by DLS, the smallest cp* in our studies was ≈ 40 g L−1). These studies were conducted only in 0.1 M NaCl.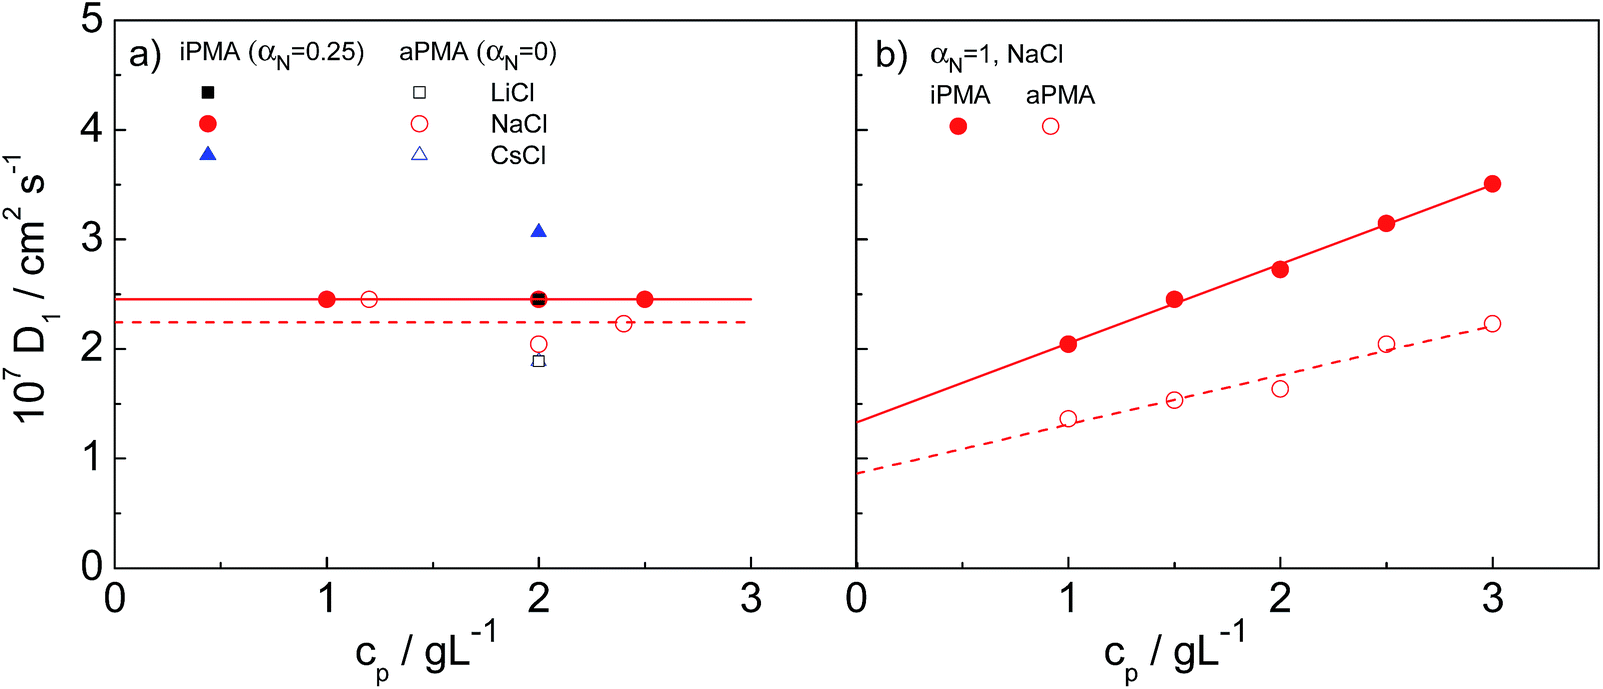 | ||
| Fig. 2 The dependence of the diffusion coefficient of individual chains, D1, on polymer concentration, cp, in 0.1 M NaCl: (a) iPMA at αN = 0.25 and aPMA at αN = 0 (for comparison, values in 0.1 M LiCl and CsCl at cp = 2 g L−1 are also shown) and (b) both PMAs at αN = 1 in 0.1 M NaCl. Lines in Fig. 2a only apply to the data in 0.1 M NaCl. | ||
The small Rh,1 values of individual chains are expected, knowing that PMA chains adopt a coiled conformation for αN < ∼0.3. The size of an ideal coil of a polymer chain with the same degree of polymerization as aPMA (DP ≈ 2200) or iPMA (DP ≈ 370) would have to be around 10 and 4 nm, respectively, which suggests that the determined size of iPMA is too large. Likely reasons for this are more chain rigidity of the stereoregular iPMA and its non-zero αN value.
In contrast to Rh,1, cp has a significant effect on the hydrodynamic radius of the aggregates, Rh,2. As expected, the extent of aggregation, as the size of the aggregates, increases with increasing cp from 90 to 122 nm (250 to 340 nm) at cp = 1.5 and 2.5 g L−1 for iPMA and aPMA, respectively. However, the shape parameter ρ (= Rg,2/Rh,2), which will be discussed in detail below, is independent of cp (ρ ≈ 0.60 and 0.73 for iPMA and aPMA, respectively), showing that the aggregates remain self-similar. On the basis of this, we propose that the interpretation of aggregation phenomena in dilute PMA solutions at low αN is not affected by the polymer concentration as long as solutions are sufficiently dilute (well below cp*).
In our study, cs was constant (cs = 0.1 M) and λ was varied via αN, which affects cpc (cpc = αNcp). The maximum value of λ was 0.235 for fully ionized polyions (αN = 1), meaning that the conditions in PMA solutions correspond to the transient or possibly the “dilute lattice” regime. The D1 values for αN = 1 in 0.1 M NaCl are plotted in dependence on cp in Fig. 2b and are comparable in magnitude to those of weakly charged PMA chains at cs = 0.1 M (compare Fig. 2a and b). However, in contrast to the low αN conditions, D1 values increase with increasing cp, pointing to a positive value of A2 for both PMAs at αN = 1, which is expected for fully charged polyions dissolved in an aqueous medium. The calculated Rh,1 values of aPMA (iPMA) chains decrease from around 18 (12) nm at cp = 1 g L−1 to around 11 (7) nm at cp = 3 g L−1.
Further experiments were performed at a constant polymer concentration of cp = 2 g L−1. As will become evident below, the slow diffusion process (slow mode) in PMA solutions in this polyion concentration regime depends primarily on the polyion charge, its tacticity and the type of the added cation.
Aggregation at αN = 0 (aPMA) and 0.25 (iPMA) and the nature of aggregates
The presence of aggregates in both iPMA and aPMA solutions at low αN is clearly manifested in the plot of the LS intensity in absolute units, ΔRθ=0 (= (R − R0)θ=0, where R is the Rayleigh ratio of the solution and R0 that of the solvent and the index “θ = 0” denotes extrapolation to zero angle) as a function of αN, shown in Fig. 3. The ΔRθ=0 values are plotted as relative values, i.e. they are divided by (ΔRθ=0)αN=1, a value obtained at αN = 1. The calculated relaxation time, τ, distribution functions are shown in Fig. 4.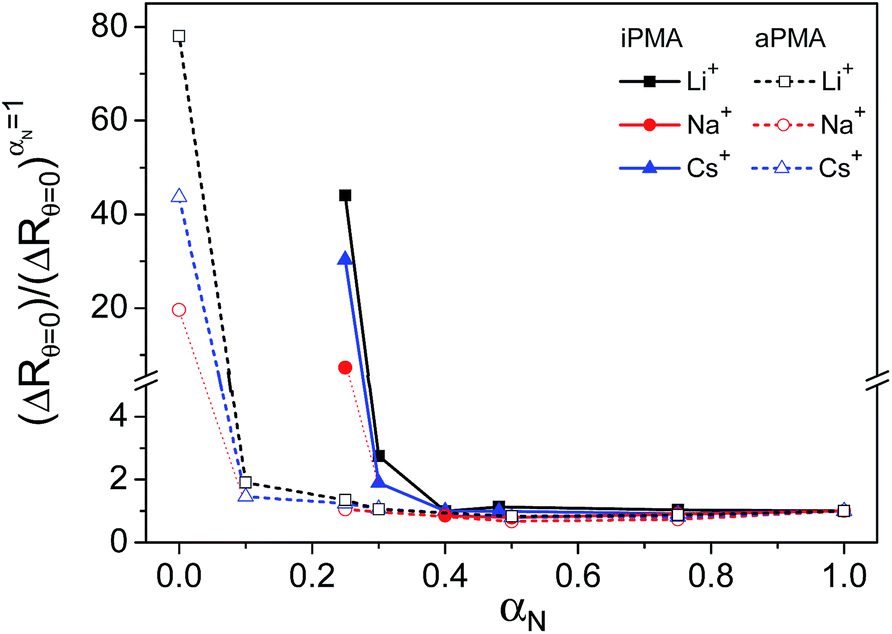 | ||
| Fig. 3 The total LS intensity (ΔRθ=0) divided by its value at αN = 1((ΔRθ=0)αN=1) plotted versus αN in aqueous iPMA and aPMA solutions: 0.1 M LiCl (black squares), NaCl (red circles) and CsCl (blue triangles); cp = 0.023 M. The solubility limit of iPMA is at αN ≈ 0.2. | ||
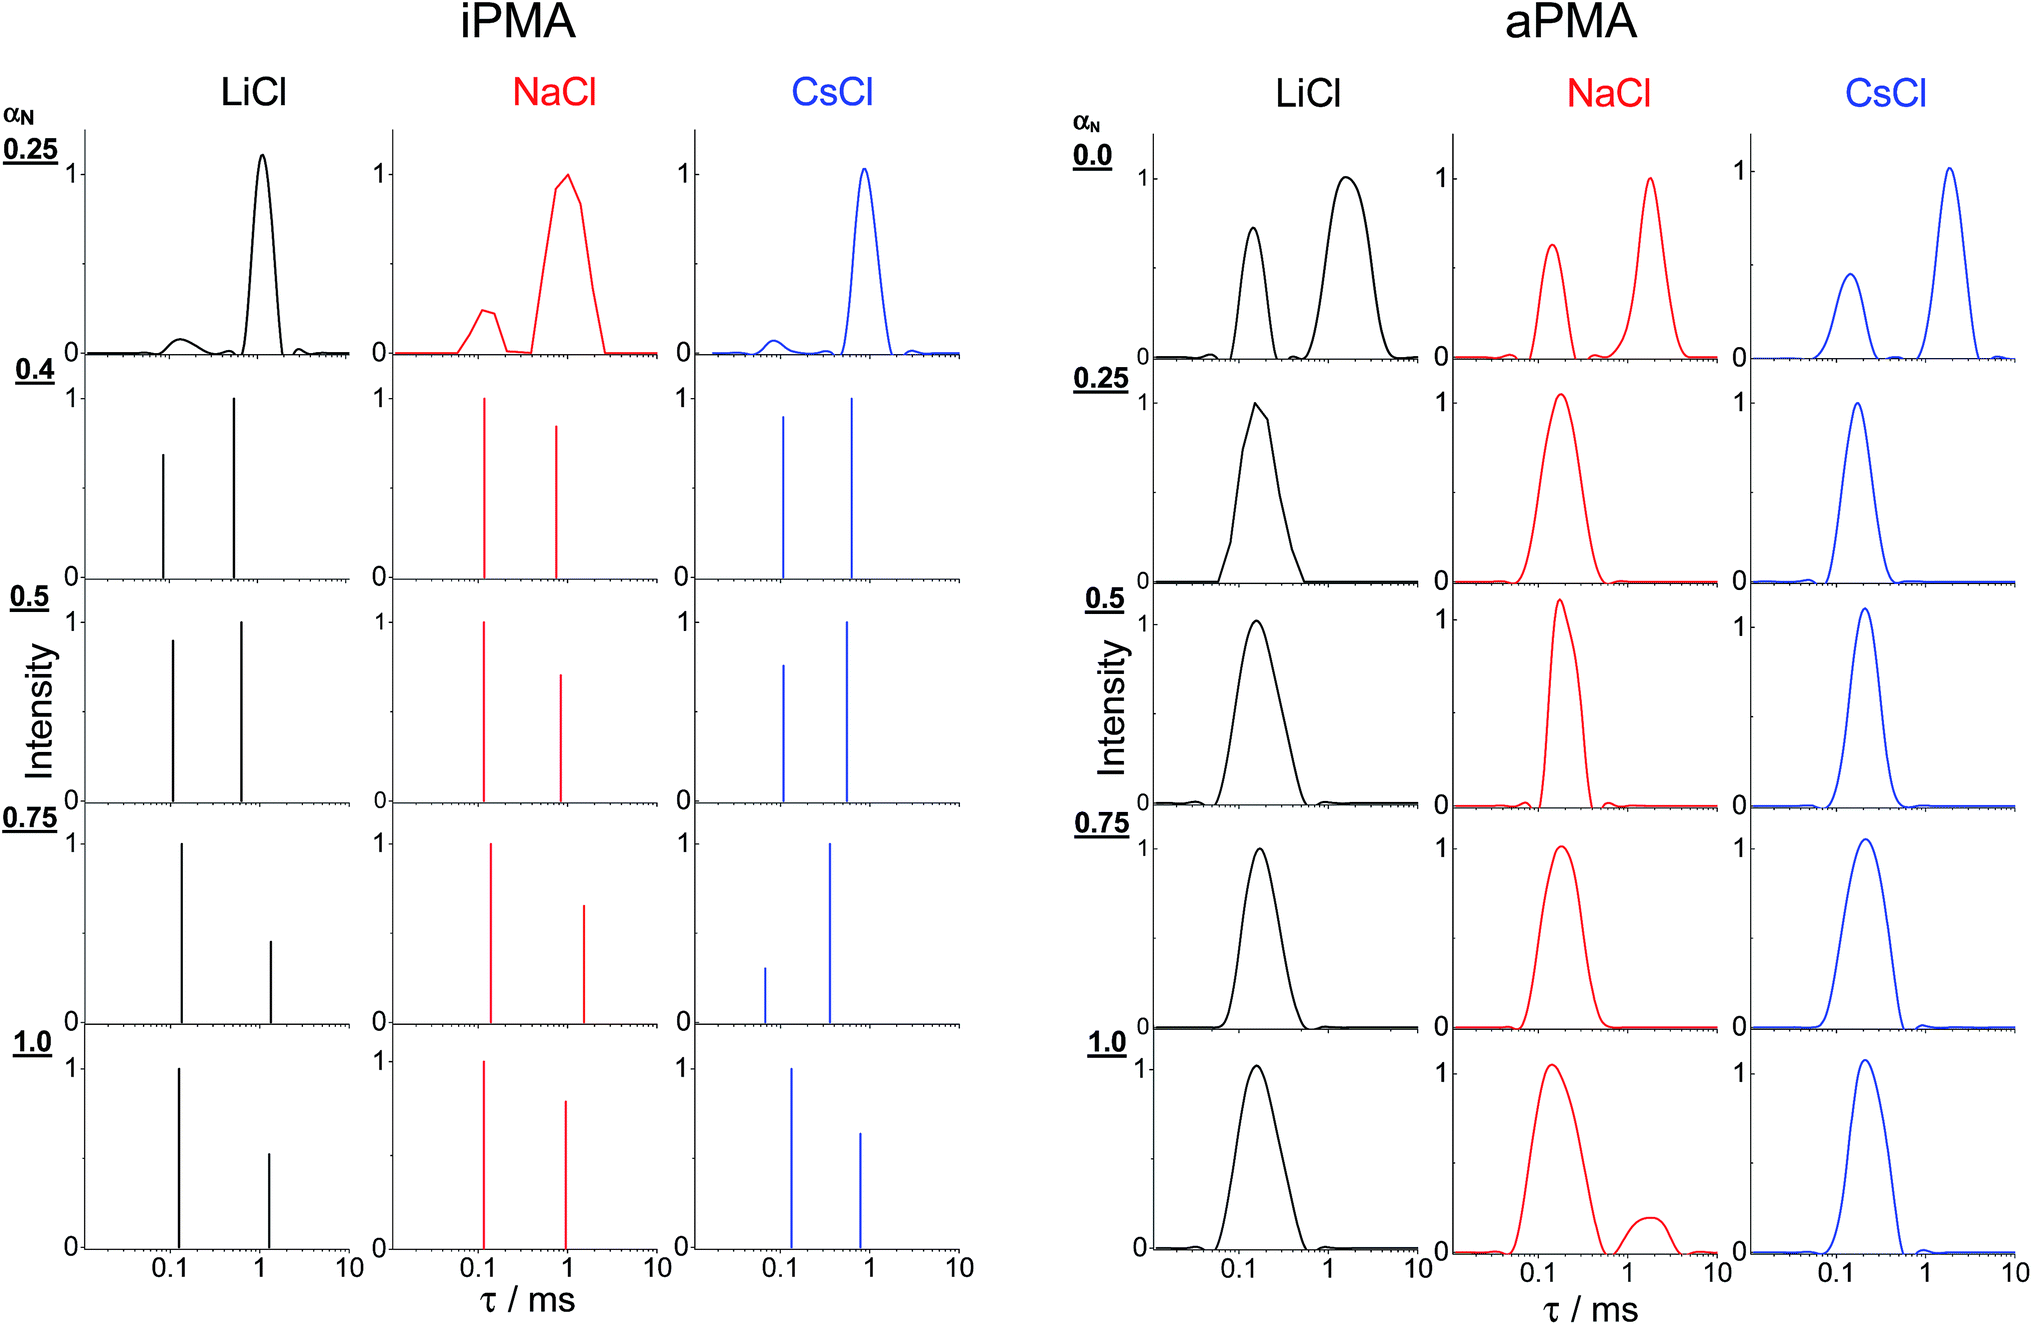 | ||
| Fig. 4 The relaxation time, τ, distribution functions obtained at θ = 90° for aqueous aPMA and iPMA solutions of various αN values in 0.1 M LiCl (black), 0.1 M NaCl (red) and 0.1 M CsCl (blue). Note that the distributions for all iPMA solutions with αN ≥ 0.4 were estimated using a bi-exponential fit (Origin 8.0 Software), whereas the others were obtained using the CONTIN program (see ESI†). | ||
Clearly, the total LS intensity is very high at αN = 0 for aPMA and at αN = 0.25 for iPMA and drops by 1–2 orders of magnitude at higher αN. The calculated distributions at the lowest αN are bimodal in both cases. The fast relaxation time, resulting in a smaller size, Rh,1, is associated with individual chains, whereas the slow relaxation process, resulting in a larger size, Rh,2, is attributed to multi-chain aggregates. The evidence that the slow relaxation process is due to aggregates is given by the high LS intensity in these αN conditions. Data in Fig. 3 demonstrate that the intensity drops sharply with increasing αN. Thus, the ratio ΔRθ=0/(ΔRθ=0)αN=1 is close to 1 already at αN = 0.1 (0.3) for aPMA (iPMA), suggesting the disintegration of the aggregates in a very narrow region of αN values (the same conclusions are also obtained by considering separately the contribution of the aggregates to the total LS intensity). We conclude that the aggregation ceases abruptly with increasing αN for both PMAs.
The Rh,2 values of aggregates were obtained from the measured diffusion coefficients extrapolated to zero angle (see Fig. S5a†) and are reported in Table 2. They clearly depend on the type of the cation. Rh,2 ranges from 90 to 115 nm for iPMA and from 230 to 290 nm for aPMA and points to extensive aggregation between chains. In view of the fact that aggregates are large in size in comparison to the wavelength of light, the radius of gyration, Rg,2, could be determined from the angular dependence of the LS intensity (see Fig. S5b†), and from that the shape parameter ρ (= Rg,2/Rh,2) was calculated. The resulting ρ values are around 0.63 for iPMA and around 0.75 for aPMA (Table 2), which are both lower than ρ for a hard sphere (ρ = 0.78).
| XCl | iPMA | aPMA | ||||||||
|---|---|---|---|---|---|---|---|---|---|---|
| α N | R h,1 | R h,2 | R g,2 | ρ | α N | R h,1 | R h,2 | R g,2 | ρ | |
| LiCl | 0.25 | 10 ± 1 | 115 ± 2 | 73 ± 2 | 0.63 ± 0.02 | 0 | 13 ± 1 | 263 ± 4 | 195 ± 3 | 0.74 ± 0.02 |
| NaCl | 0.25 | 10 ± 1 | 110 ± 2 | 64 ± 2 | 0.58 ± 0.02 | 0 | 12 ± 1 | 292 ± 5 | 221 ± 3 | 0.76 ± 0.02 |
| CsCl | 0.27 | 7 ± 1 | 90 ± 2 | 60 ± 2 | 0.67 ± 0.03 | 0 | 13 ± 1 | 231 ± 4 | 173 ± 3 | 0.75 ± 0.02 |
In view of these small ρ values, we tried to classify the aggregate structure by comparing the scattering data with theoretically predicted scattering functions for some typical particle topologies.39 For this purpose, the angular dependence of scattered light was followed and the intensities were split into contributions of small and large particles as demonstrated in ESI.† The data for the large particles (aggregates) are presented in Fig. 5 in the form of a Kratky plot (i.e. the dependence of (qRg)2P(q) on qRg). The experimental points are compared with six selected particle topologies, ranging from rigid rod to hard sphere. It can be seen that the majority of data points for iPMA remain in the range of low q-values (corresponding to qRg < 1.5) where most of the topologies (except the spherical) fit. The aggregates of aPMA are sufficiently large to exceed this limit. Thus the corresponding data extend to higher qRg values and can clearly be approximated with the Debye-Bueche scattering function (for details of these fits, see also Fig. S5b†). As is seen in Fig. 5, the iPMA aggregates are too small to resolve their internal structure using the Kratky plot. However, it appears that the calculated points correspond to the aPMA series.
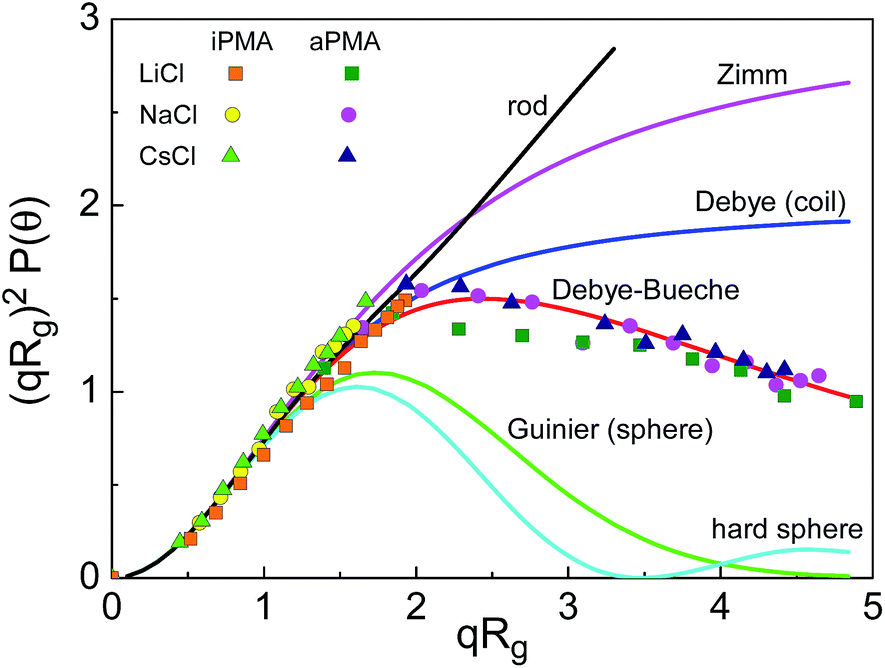 | ||
Fig. 5 The Kratky plot for six selected topologies (solid lines; for details see ref. 39) and the experimental data for iPMA ( , ,  , ,  ) and aPMA ( ) and aPMA ( , ,  , ,  ) at αN = 0.25 and 0, respectively, in 0.1 M LiCl (squares), NaCl (circles), and CsCl (triangles). The LS data in this figure apply to the slow diffusive process, thus only representing the multimolecular aggregates. ) at αN = 0.25 and 0, respectively, in 0.1 M LiCl (squares), NaCl (circles), and CsCl (triangles). The LS data in this figure apply to the slow diffusive process, thus only representing the multimolecular aggregates. | ||
The Debye-Bueche scattering function is reported in the literature for the description of hyperbranched flexible chain molecules and microgels from chemically cross-linked flexible chains.41,42 On the basis of this, and of the low ρ values, we propose that iPMA and aPMA aggregates can be characterized as microgel-like particles, i.e. spherical solvent-draining particles with a higher polymer density in the centre and a lower density towards the outer surface (shell). The “cross-links” connecting the PMA chains are physical rather than chemical.
According to the higher ρ value (around 0.75, irrespective of the added cation), the aggregates of aPMA chains have a looser structure that allows easier penetration of solvent into the interior, whereas aggregates of a highly regular iPMA with a lower ρ are considerably denser with a more compact core, allowing only the outer shell to be drained by water. In addition, the dn/dcp data indicate that the surface of the aggregates (providing the optical contrast in scattering) is also different for iPMA aggregates in comparison with aPMA aggregates. This may partly arise from the different extent of ion binding, but predominantly it is attributed to the different polarity of the aggregate surface.
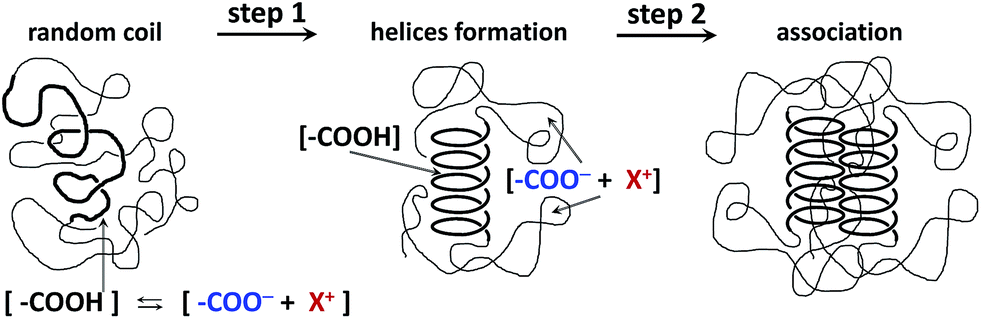
The idea of different compactness and surface polarity of the iPMA aggregates becomes plausible if one takes into account that the iPMA chains adopt a partly helical conformation in solution.5,6,43 Such an ordered conformation would promote association through very efficient hydrogen bonding between helices arranged in parallel. It was proposed by van den Bosch et al.6 that hydrogen bonding in iPMA solutions may be strongly cooperative. For the cooperativity to be truly effective, the distribution of dissociated and undissociated carboxyl groups should not be random, as usually thought. On the contrary, we propose that the undissociated carboxyl groups (COOH) are concentrated in the helical regions and the dissociated (COO−) groups in the disordered regions of the chains. In this way, it becomes reasonable to suggest that domains are formed, within which uncharged portions of iPMA chains are strongly hydrogen-bonded to neighbouring chains in a cooperative manner. Water may be largely excluded from these regions (the cores of the particles). The water-exposed regions of the aggregate surface are made up of less ordered chain portions with hydrophilic COO− groups and comprise the shell around the core. The comparison of results for aPMA and iPMA implies that the affinity of charged/polar groups for water (in our case either COO− or COOH) depends considerably on the particular distribution of other hydrophilic and hydrophobic groups in a certain chain conformation. The hydration/dehydration effects are thus crucial in aggregation between PMA chains, as discussed recently also by Burrows et al.44 for another anionic polyelectrolyte, poly(vinyl sulfate), in that case with trivalent counterions. There exists only a narrow window of αN in which the described association in PMA solutions can be observed.
A sketch of the proposed model for the aggregation of iPMA chains is presented in Fig. 6. The first step in this model is the disorder-to-order (coil-to-helix) transition and the second one is the side-by-side aggregation of helices. A similar cooperative mechanism was reported previously for intermolecular association between even more hydrophobic poly(ethacrylic acid), PEA, chains in water45 and for synthetic polymers in organic solvents, e.g. for isotactic poly(methylmethacrylate) in 2-butanone46 or syndiotactic poly(styrene) in bromoform.47 The majority of the ionized carboxyl groups in this aggregate are exposed to the solvent and the hydrophobic methyl groups are mostly hidden in the hydrophobic core. Thus the dielectric constant of the hydrophobic core is lower than that of the surrounding shell, as proved by fluorescence measurements.5 The charges on the iPMA chains together with their counterions only exist in the shell of the aggregates, which are therefore swollen with water due to the osmotic pressure effects.
 | ||
| Fig. 6 A model of the association process in iPMA solutions at αN = 0.25. | ||
On the other hand, aPMA chains have a random distribution of carboxyl groups along the chain and at αN = 0 only a very small part (a few %) is charged due to self-ionization. The COOH groups are capable of forming intermolecular hydrogen bonds, but presumably in a less cooperative manner due to aPMA's irregular structure. Consequently, the core of aPMA aggregates is less dense in comparison with those of iPMA and at the same time the surface has a considerably lower charge. Besides, it was demonstrated previously by pyrene-based fluorescence measurements that the interior of the compact form of aPMA at αN = 0 is actually more hydrophobic than that of iPMA, because the methyl groups can be more efficiently buried in it,5 whereas the surface has to be more hydrophilic. This is finally demonstrated also in a different optical contrast. Responsibility for the stability of aPMA aggregates in solutions at rest comes largely from the hydrophobic effect associated with the methyl side groups, and not so much from hydrogen bonding, as is the case with iPMA. However, we have to stress that the probability of hydrogen bond formation between aPMA chains strongly increases in the field of flow as confirmed in several publications,9,11,13 which is not the case with iPMA.13
Generally, aggregation is more favourable for neutral polymers and increases with increasing Mw. Thus our results suggest that iPMA, which is ionized to a non-negligible degree (αN = 0.25) and has a six times lower Mw than aPMA, is much more inclined towards intermolecular association than aPMA.
Effect of ions on aggregation
The sequence of ions in relation to the size of the aggregates is Li+ > Na+ > Cs+ for iPMA and Na+ > Li+ > Cs+ for aPMA (see Table 2), the same as noticed previously for dn/dcp values. These results show that Na+ and Li+ better support aggregation between iPMA and aPMA chains than Cs+ ions do. This observation can be understood by taking into account the hydration radii of the investigated cations, which decrease with increasing ionic radii, and by applying the LMWA17–19 for the interpretation of ion pair formation in the electrolyte solutions. The COO− anion is strongly hydrated, as are the Li+ and Na+ ions; they have high hydration enthalpies, ΔHhydr. On the other hand, the Cs+ ion is only weakly hydrated, with a considerably lower ΔHhydr. The LMWA states that the closer the ΔHhydr values of ions are, the stronger is the resulting ion pair. Thus COO− is expected to form the strongest ion pair with Na+ ions, since their ΔHhydr values are very close to each other (ΔHhydr ≈ −420 kJ mol−1), and the weakest one with Cs+ ions.Although PMA chains at low αN are only weakly charged (a few COO− groups are present due to self-ionization in the aPMA αN = 0 case, and around 25% in the iPMA αN ≈ 0.25 case), the LMWA seems to apply fairly well. Thus Na+ ions better support aggregation between PMA chains than Cs+ ions do, so larger aggregates are formed in the former case. The observed sequence in the size of aPMA aggregates (Na+ > Li+ > Cs+) is therefore in perfect agreement with the LMWA, although aPMA is virtually uncharged. Recent computer simulations by Hess et al.48 performed on a neutral protein and on two (either positively or negatively) charged proteins show that the neutral protein followed the same series as did the charged proteins with respect to ion specificity. The authors have concluded that this is probably due to the fact that carboxylates stick out of the protein surface and are fully hydrated. This is also a reasonable explanation for aPMA. On the level of an individual chain, it is widely accepted that aPMA at low αN is in a rather compact coil conformation. Methyl groups are predominantly buried in the core of such a structure (the core is rather hydrophobic; see above) and polar COOH groups, and among these some charged COO− groups arising from self-ionization, are facing the water solvent.
In the iPMA case, the largest aggregates are formed in the presence of LiCl, suggesting that Li+ ions interact more strongly with carboxylates on the iPMA chain. Several factors may be responsible for this difference in comparison with aPMA. First, it is reasonable to expect that the ΔHhydr of an ion depends to some extent also on the structural features of the whole macromolecule. The particular positioning of the COO− groups on the isotactic chain could lead to a modified interaction of the aggregated isotactic polymer with water. Water molecules avoid contact with hydrophobic methyl groups and are pushed toward ionized COO− groups with a high affinity for water. In this way, they may contribute to a somewhat higher ΔHhydr of COO−, closer to that of Li+ (for which ΔHhydr = −531 kJ mol−1). Besides, it is also known that the Li+ ion's position in the Hofmeister series shifts depending on the surrounding environment. These together could bring about a different sequence in iPMA solutions in comparison with those of aPMA. An important implication of our results is that the cation specificity in PMA solutions is determined by the properties of the cation's water of hydration and by the ability to donate these water molecules to the polymer, which certainly depends on the polymer's state in solution.
It is worth noting that the value of ρ (see Table 2) shows no pronounced ion-specific effects. The same also holds for the Kratky plot (Fig. 5). This implies that the nature (spatial mass distribution) of the aggregates is similar, irrespective of the added ion, but only the extent of aggregation changes. The mass distribution within the aggregates is affected primarily by the chemical and physical nature of the polyion.
The αN dependence of the slow mode
We now turn our attention to the study of the slow mode as a function of αN. Fig. 3 shows that the total LS intensity in the presence of all XCls drops to a very low and constant value for αN > 0 (aPMA) or αN > 0.25 (iPMA). All time distribution functions for iPMA solutions with αN > 0.25 are bimodal, regardless of the counterion (Fig. 4). As for aPMA, bimodality is observed only for αN = 1 in the presence of 0.1 M NaCl. The fast mode, as before, is associated with the diffusion of individual chains (small particles). On the other hand, the slow mode at higher αN does not represent particles, but is due to the so-called polyelectrolyte effect, originating from electrostatic repulsions between the charged chains. The evidence for this is provided by the low LS intensity (c.f.Fig. 3) and by inspecting plots of the decay rate, Γ, in dependence on the square of the scattering vector q given in Fig. 7. An additional verification that we are dealing with an “anomalous” diffusion process is that points are rather scattered in the Kratky plot (not reported); it is impossible to claim that they follow any specific topology.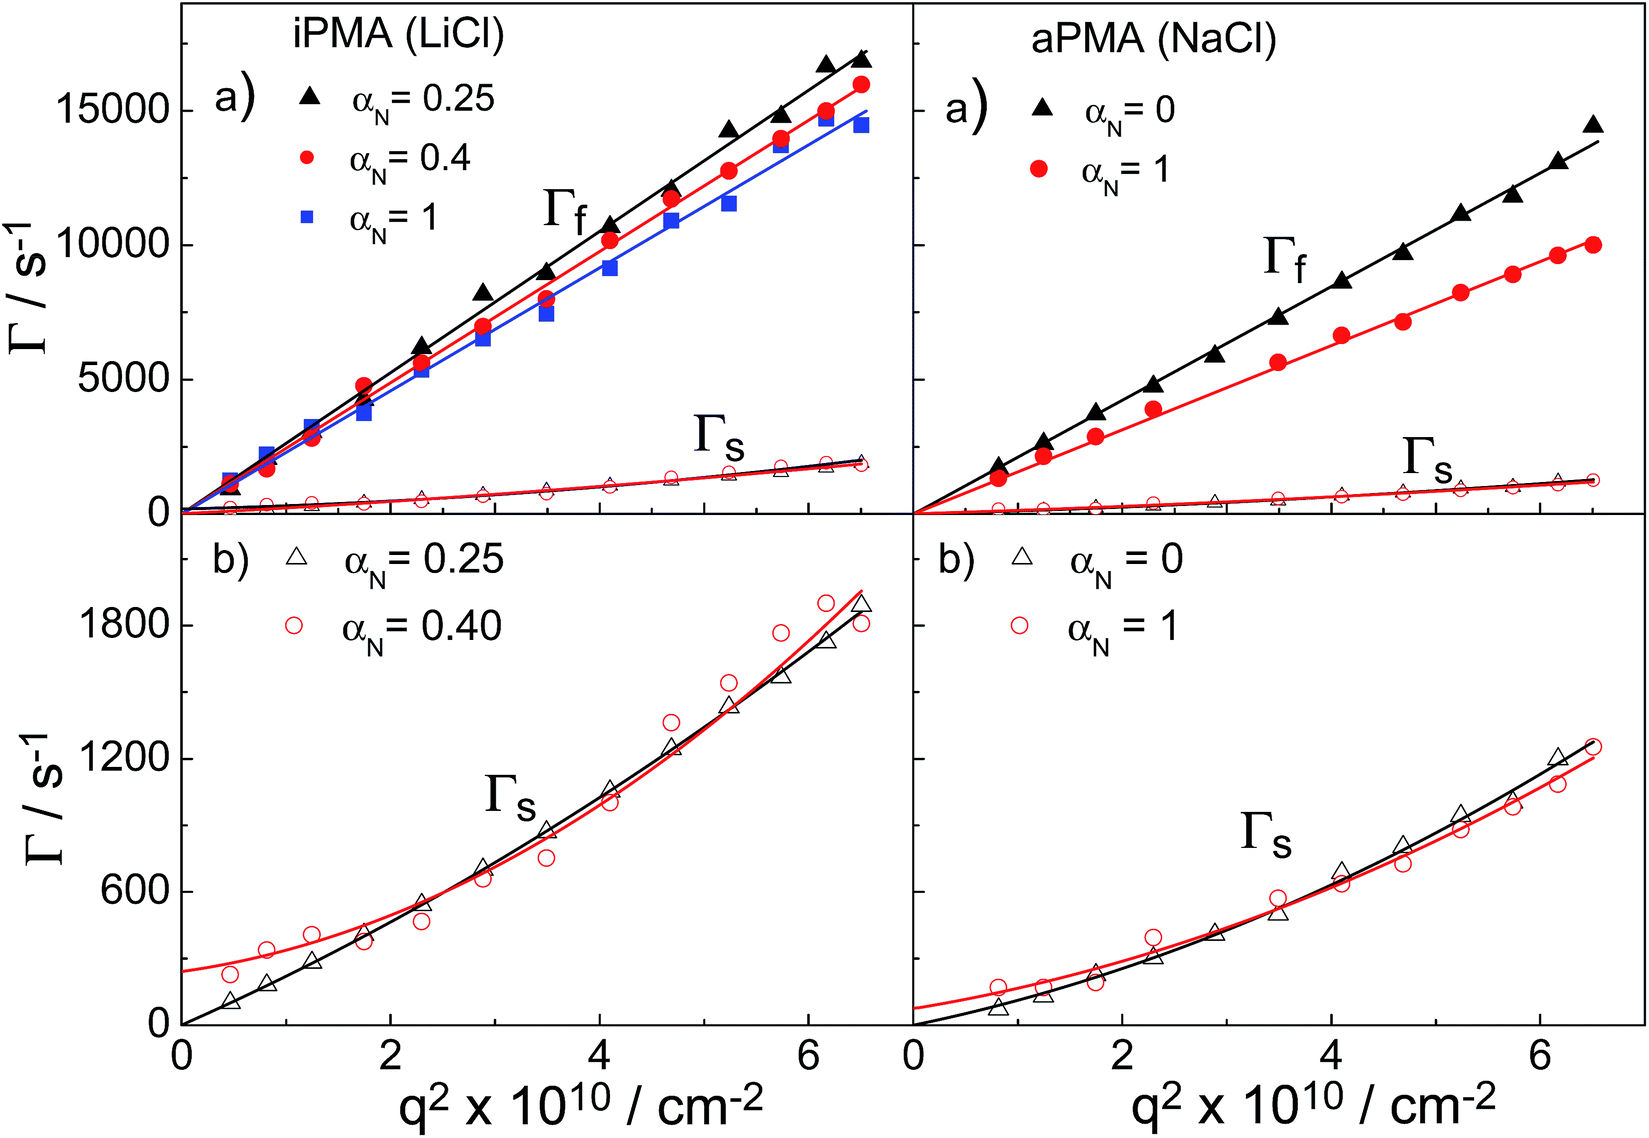 | ||
| Fig. 7 Decay rates, Γ = τ−1, as a function of the square of the scattering vector, q2, at selected αN values for iPMA in 0.1 M LiCl and for aPMA in 0.1 M NaCl: (a) fast, Γf (filled symbols), and slow mode, Γs (open symbols); (b) only slow mode, Γs. | ||
Curves with a high slope in Fig. 7 correspond to the fast relaxation process, characterized by the fast relaxation rate, Γf, and those with the low slope to a considerably slower relaxation process, characterized by the slow relaxation rate, Γs. In Fig. 7b, the range for Γs curves is enlarged. At all studied αN values and for all XCls, the Γfvs. q2 curves were linear for both PMAs. They start from the origin, thus representing true translational diffusion of rather monodisperse (and small) particles. Also, the Γsvs. q2 curves for αN = 0 (aPMA) or 0.25 (iPMA) start from the origin, but show positive deviations from linearity with increasing q2 as a consequence of polydispersity of the aggregates.
In contrast, the Γs curves at higher αN do not go through the origin (c.f. the lines in Fig. 7b for αN = 0.4 (iPMA) and 1 (aPMA) and additional curves for iPMA with αN = 1 in ESI, Fig. S6†) and cannot be related to the translational diffusion.34 They are due to the polyelectrolyte effect, often referred to in the literature as the slow mode.25–28 Note that we use the notation Γs for both the aggregates and the slow mode, because it signifies the slow diffusion (real or “anomalous”) characterized by a small value of D. Similar curves were reported in Cong et al.25 (c.f.Fig. 2 there) for sodium poly(styrenesulfonate), NaPSS, where the slow mode was studied in detail. Our results show that the slow mode is present in the aqueous 0.1 M XCls solutions of iPMA at all αN ≥ 0.4, whereas for aPMA it is only detected in the 0.1 M NaCl solution at αN = 1. This indicates that under the investigated conditions, 0.1 M alkali chlorides do not provide efficient screening of the electrostatic forces between iPMA chains, whereas they do for aPMA chains in all the cases except for the highest polyion charge (αN = 1) in 0.1 M NaCl. This difference between aPMA and iPMA agrees with the conclusions of previous investigations5,7 that the iPMA chain has a locally higher charge density in comparison to aPMA and therefore a higher salt concentration is needed to screen electrostatic interactions efficiently. The 0.1 M XCls seem to be the borderline case for observation of the slow mode, at least as far as aPMA is concerned. Further investigations are in progress regarding the dependence of the slow mode in iPMA and aPMA solutions on salt concentration. One of the open issues is also the effect of ions on the slow mode.
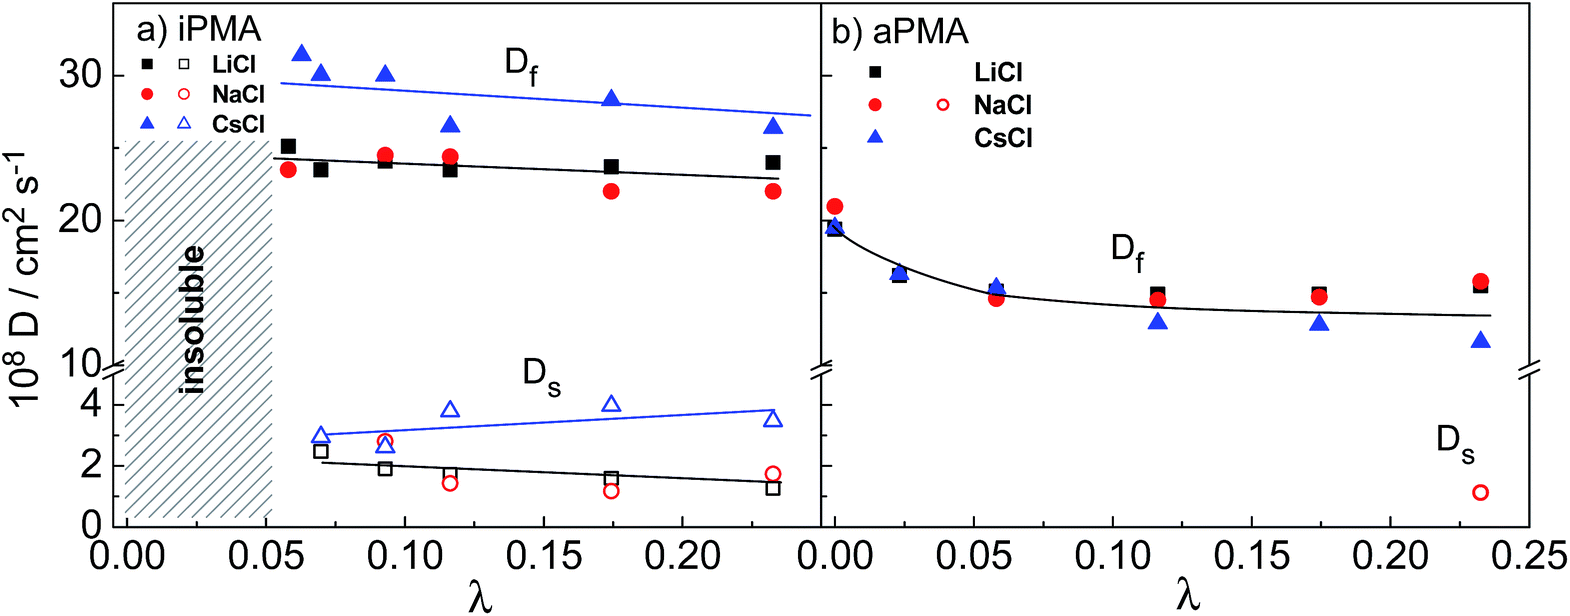
The diffusion coefficients were obtained from the initial slopes of the decay rate curves and are plotted in Fig. 8 as a function of λ. The range of λ values that can be covered by changing αN (at constant cp and cs) is rather narrow (0.01 < λ < 0.24). In this λ range, the Df of the iPMA solutions, as of the aPMA solutions (for λ > 0.05 or αN > 0.2) is more or less independent of αN in all 0.1 M XCls. Somewhat higher values are obtained only for aPMA at αN = 0 (practically uncharged chains) for all three salts. The latter is related to the faster diffusion of the uncharged chains in comparison to the charged chains at the rather high ionic strength provided by 0.1 M XCls. In contrast to our result, Sedlak26,31 has reported an increasing trend of Df with αN (λ) up to αN ≈ 0.5 (λ ≈ 0.12), however at a considerably higher cp (= 36.6 g L−1) and in salt-free aPMA solutions. Förster et al.27 report diffusion coefficients of quaternized poly(2-vinyl pyridine), QPVP, over a much broader range of λ values (from around 0.005 to more than 1000). Similarly to our case, no strong dependence of Df on λ can be inferred for QPVP in the same λ range as covered in our work (0.01 < λ < 0.24). The slow diffusion coefficient, Ds, of PMA differs from Df by approximately one order of magnitude, again similar to the QPVP case, and is almost constant in the whole λ range. It has to be noticed that in Förster et al.27λ was varied by changing cs and cp, and not αN as in the PMA case reported here.
 | ||
| Fig. 8 Fast, Df, and slow, Ds, diffusion coefficients as a function of the parameter λ (= αNcp/cs) for (a) iPMA and (b) aPMA in the presence of 0.1 M LiCl (black squares), NaCl (red circles) and CsCl (blue triangles). The filled symbols denote the fast relaxation mode and the open symbols the slow relaxation mode. | ||
The effect of different alkali metal ions on Df and Ds is not as pronounced as their effect on aggregation. It may be noticed that both the Df and Ds of iPMA in 0.1 M CsCl are higher in comparison with 0.1 M LiCl and NaCl in the whole λ region, whereas with aPMA there is no obvious difference. The explanation of these subtle differences is justified only in the case of iPMA in 0.1 M CsCl and invokes the role of cations in screening electrostatic interactions between negatively charged polyions. It is well known that polyions diffuse much faster in comparison with the equivalent neutral polymer chains due to their mutual electrostatic repulsion. If these interactions are screened, the diffusion should slow down. In the function of screening, Cs+ ions are less effective than Li+ and Na+ ions, which stems from the effects discussed in relation to hydration/dehydration (see above). Cs+ ions are not so prone to release their water of hydration upon binding to the carboxylate groups on PMA as are Li+ and Na+. They bind to the polyion's electrostatic atmosphere in accordance with the Coulomb forces. In the polyelectrolyte field, this type of binding is described as atmospheric binding in contrast to site binding,23 which involves dehydration. Therefore, Cs+ ions bind less strongly to PMA than do Li+ and Na+ ions and thus the diffusion of polyions with carboxylate groups is faster in CsCl solutions. This is naturally reflected in both Df and Ds values. As far as Li+ and Na+ ions are concerned, the mutual difference in diffusion coefficients is not significant. This finding may be related to the value of ΔHhydr, which is closer for these two cations and considerably lower (by around 50 to 90%) for the Cs+ ions.21
Conclusions
In conclusion, we have shown that isotactic and atactic PMA chains aggregate in aqueous solutions at low degrees of neutralization, αN, in the presence of 0.1 M LiCl, NaCl and CsCl. The aggregates, irrespective of the cation present, resemble spherical microgel-like particles with a core–shell structure. The density distribution between the core and the shell depends primarily on the chain tacticity and, to a lesser extent, on the nature of the cation. The effect of the cations is revealed in the extent of aggregation. The aggregates' sizes follow the sequence (from the largest to the smallest) Na+ > Li+ > Cs+ for aPMA and Li+ > Na+ > Cs+ for iPMA, which was explained by the law of matching water affinities.The iPMA chains form aggregates with a considerably denser core than the aPMA chains, as deduced from the value of the shape parameter. Not only the density distribution, but also the outer and inner polarity of the aggregates is different. Thus the aPMA aggregates have a more hydrophobic, although less compact, core. This was inferred from the measured optical contrast, as reflected by the refractive index increment values, and from previous fluorescence studies. The greater compactness of the iPMA aggregates was explained by proposing a model of cooperative hydrogen bond formation between chains in a helical conformation. The undissociated carboxyl groups are concentrated in these helical regions within the core and the dissociated groups in the disordered regions of the aggregates, i.e. in the corona. Such a model could also explain the different sequence of cations for iPMA on the one hand and for aPMA on the other hand (see above). It is suggested that the state of the hydrated iPMA aggregates is different from that of the hydrated aPMA aggregates. Consequently, the affinity of the Li+ ions for the carboxylates of iPMA may become larger than that of the Na+ ions.
Different chain conformations are not limited to low αN. Investigations upon increasing αN show that the slow mode, arising from the electrostatic interactions between the charged chains, is present for iPMA at all αN > 0.25 and in all 0.1 M XCls, but for aPMA only at αN = 1 in 0.1 M NaCl. The most straightforward explanation of this is that the effective charge density of both PMAs is different due to different chain conformations. The helical conformation of iPMA, which is also preserved at higher αN, leads to a locally higher charge density of iPMA in comparison with aPMA. It was concluded that the 0.1 M concentration of XCls is not sufficient to screen the electrostatic repulsion between iPMA chains and seems to be the borderline case for aPMA. Further investigations on the dependence of the slow mode on salt concentration in PMA solutions are in progress.
Acknowledgements
This work was financially supported by the Slovenian Research Agency, ARRS, through the Physical Chemistry program P1-0201. The authors are grateful to the Slovenian Research Agency, ARRS (Grants no. BI-FI/09-005, BI-FI/11-12-004), to the Academy of Finland (Grants no. 132404 and 134581), and to Finnish Society of Science and Letters (Magnus Ehrnrooth Foundation) for the financial support of the research visits.Notes and references
- M. Rubinstein and G. A. Papoian, Soft Matter, 2012, 8, 9265–9267 RSC
and papers therein.
- V. Crescenzi, Adv. Polym. Sci., 1968, 5, 358–386 CrossRef CAS
- K. Hatada, J. Polym. Sci., Part A: Polym. Chem., 1999, 37, 245–260 CrossRef CAS
- J. C. Leyte, H. M. R. Arbouw-van der Veen and L. H. Zuiderweg, J. Phys. Chem., 1972, 76, 2559–2561 CrossRef CAS
- N. Vlachy, J. Dolenc, B. Jerman and K. Kogej, J. Phys. Chem. B, 2006, 110, 9061–9071 CrossRef CAS PubMed
- E. van den Bosch, Q. Keil, G. Filipcsei, H. Berghmans and H. Raynaers, Macromolecules, 2004, 37, 9673–9675 CrossRef CAS
- B. Jerman, M. Breznik, K. Kogej and S. Paoletti, J. Phys. Chem. B, 2007, 111, 8435–8443 CrossRef CAS PubMed
- B. Jerman and K. Kogej, Acta Chim. Slov., 2006, 53, 264–273 CAS
- J. Eliassaf and A. Silberberg, Polymer, 1962, 3, 555–564 CrossRef CAS
- J. Eliassaf, A. Silberberg and A. Katchalsky, Nature, 1955, 176, 1119 CrossRef CAS
- S. Ohoya, S. Hashiya, K. Tsubakiyama and T. Matsuo, Polym. J., 2000, 32, 133–139 CrossRef CAS
- K. Kogej, H. Berghmans, H. Reynaers and S. Paoletti, J. Phys. Chem. B, 2004, 108, 18164–18173 CrossRef CAS
- S. Sitar, V. Aseyev and K. Kogej, Polymer, 2014, 55, 848–854 CrossRef CAS PubMed
- E. M. Loebl and J. J. O'Niell, J. Polym. Sci., 1960, 45, 538–540 CrossRef CAS PubMed
- F. Hofmeister, Arch. Exp. Pathol. Pharmakol., 1888, 24, 247–260 Search PubMed
- W. Kunz, J. Henle and B. W. Ninham, Curr. Opin. Colloid Interface Sci., 2004, 9, 19–37 CrossRef CAS PubMed
- K. Collins, Biophys. J., 1997, 72, 65–76 CrossRef CAS
- K. D. Collins, Methods, 2004, 34, 300–311 CrossRef CAS PubMed
- K. Collins, G. W. Neilson and J. E. Enderby, Biophys. Chem., 2007, 128, 95–104 CrossRef CAS PubMed
- W. Kunz, Curr. Opin. Colloid Interface Sci., 2010, 15, 34–39 CrossRef CAS PubMed
- J. Kher, S. C. Flores and P. S. Cremer, J. Phys. Chem. B, 2012, 116, 7389–7397 CrossRef PubMed
- J. Heyda and J. Dzubiella, Soft Matter, 2012, 8, 9338–9344 RSC
- U. P. Strauss and Y. P. Leung, J. Am. Chem. Soc., 1965, 87, 1476–1480 CrossRef CAS
- S. C. Lin, W. I. Lee and J. M. Schurr, Biopolymers, 1978, 17, 1041–1064 CrossRef CAS PubMed
- R. Cong, E. Temyanko, P. S. Russo, N. Edwin and R. M. Uppu, Macromolecules, 2006, 39, 731–739 CrossRef CAS
- M. Sedlak, Č. Konak, P. Štepanek and J. Jakeš, Polymer, 1987, 28, 873–879 CrossRef CAS
- S. Förster, M. Schmidt and M. Antonietti, Polymer, 1990, 31, 781–792 CrossRef
- S. Förster and M. Schmidt, Adv. Polym. Sci., 1995, 120, 51–133 CrossRef
- M. Drifford and J. P. Dalbiez, Biopolymers, 1985, 24, 1501–1514 CrossRef CAS PubMed
- M. Sedlák, Macromolecules, 1993, 26, 1158–1162 CrossRef
- M. Sedlák, Langmuir, 1999, 15, 4045–4051 CrossRef
- C. Urban and P. Schurtenberger, J. Colloid Interface Sci., 1998, 207, 150–158 CrossRef CAS PubMed
-
W. Schärtl, Light Scattering from Polymer Solutions and Nanoparticle Dispersions, Springer Verlag, Berlin, Heidelberg, 2007 Search PubMed
-
Dynamic Light Scattering: The Method and Some Application, ed. W. Brown, Clarendon Press, Oxford, 1993 Search PubMed
- E. V. Tarassova, V. Aseyev, A. Filippov and H. Tenhu, Polymer, 2007, 48, 4503–4510 CrossRef CAS PubMed
- M. Kanao, Y. Matsuda and T. Sato, Macromolecules, 2003, 36, 2093–2102 CrossRef CAS
- R. Schweins, J. Hollmann and K. Huber, Polymer, 2003, 44, 7131–7141 CrossRef CAS PubMed
- C. Heitz, M. Rawiso and J. Francois, Polymer, 1999, 40, 1637–1650 CrossRef CAS
-
Light Scattering from Polymer Solutions, ed. M. B. Huglin, Academic Press, New York, 1972 Search PubMed
- A. Silberberg, J. Eliassaf and A. Katchalsky, J. Polym. Sci., 1957, 23, 259–284 CrossRef CAS PubMed
- G. Savin and W. Burchard, Macromolecules, 2004, 37, 3005–3017 CrossRef CAS
- W. Burchard, Macromolecules, 2004, 37, 3841–3849 CrossRef CAS
- U. M. Apel, R. Hentschke and J. Helfrich, Macromolecules, 1995, 28, 1778–1785 CrossRef CAS
- H. D. Burrows, D. Costa, M. L. Ramos, M. G. Miguel, M. H. Teixeira, A. A. C. C. Pais, A. J. M. Valente, M. Bastos and G. Bai, Phys. Chem. Chem. Phys., 2012, 14, 7950–7953 RSC
- S. Peljhan, E. Žagar, J. Cerkovnik and K. Kogej, J. Phys. Chem. B, 2009, 113, 2300–2309 CrossRef CAS PubMed
- K. Buyse and H. Berghmans, Polymer, 2000, 41, 1045 CrossRef CAS
- J. De Rudder, B. Berge and H. Berghmans, Macromol. Chem. Phys., 2002, 203, 2083 CrossRef CAS
- B. Hess and N. F. A. van der Vegt, Proc. Natl. Acad. Sci. U. S. A., 2009, 106, 13296–13300 CrossRef CAS PubMed
Footnote |
| † Electronic supplementary information (ESI) available. See DOI: 10.1039/c4sm01448k |
| This journal is © The Royal Society of Chemistry 2014 |