DOI:
10.1039/C4SM00928B
(Paper)
Soft Matter, 2014,
10, 6417-6424
Probing the association of triblock copolymers with supported lipid membranes using microcantilevers†
Received
29th April 2014
, Accepted 11th June 2014
First published on 30th June 2014
Abstract
Pluronics are a class of amphiphilic triblock copolymers that are known to interact with cellular membranes in interesting ways. The solubility of these triblock copolymers in free lipid membranes can be altered with temperature, allowing the possibility of tuning their membrane insertion. However, for supported lipid membranes, the asymmetric local environment and the strong influence of the solid support can alter the solubility of these triblock copolymers in lipid membranes. Here, we probe the interactions of these copolymers with supported lipid membranes using microcantilevers and fluorescence recovery after photobleaching (FRAP) measurements. We measure the solubility and interactions of triblock copolymers (F68 and F98) in supported lipid bilayers as a function of temperature and the length of the copolymer lipophilic block. A Langmuir isotherm model and a free mean area theory are applied to describe the polymer–lipid interactions at the microcantilever surface, determine association constants, and analyze the effect of triblock copolymers on lateral lipid diffusion.
Introduction
Pluronics are amphiphilic triblock copolymers composed of poly(ethylene oxide) (PEO), which is hydrophilic, and poly(propylene oxide) (PPO), which is lipophilic, in a PEOm–PPOn–PEOm structure, where m and n represent the number of monomers in a block. These copolymers have been found to be useful in a number of applications, such as detergents, dispersion stabilizers, foams, and lubricants.1 These triblock copolymers are also able to interact with cell membranes. Pluronics have been reported to seal damaged cell membranes2–4 and protect lipid membranes from peroxidation.5 Pluronics have also been shown to permeabilize cell membranes, which has led to their use in drug delivery6,7 and gene and cancer therapies8. The ratio of the number of hydrophilic PEO monomers to the number of lipophilic PPO monomers determines the hydrophilic/lipophilic balance (HLB) of the copolymer. This balance affects the solubility of the copolymer in lipid membranes: copolymers with higher HLBs can cross cell membranes, while those with lower HLBs are inserted into the lipid bilayer.9–11 Additionally, temperature can be used to change the solubility of the copolymer in lipid membranes.12,13 Therefore, properties such as copolymer aggregation and phase behavior, as well as the interaction with cell membranes, are highly dependent on the temperature.14 Another important factor influencing the polymer–lipid association is the length of the lipophilic PPO block. The conformation of the copolymer in the presence of membranes greatly varies depending on the length of the copolymer relative to the lipid membrane thickness.15,16
There have been several interesting studies aimed at understanding the interactions of the triblock copolymers with cellular membranes. These studies have probed the interactions of triblock copolymers with model lipid membranes, such as lipid monolayers at an air/water interface17 and lipid vesicles.15,18,19 Interestingly, understanding this polymer–lipid interaction remains elusive because the results from different lipid systems are inconsistent,20 likely due to differences in the lipid configuration of these systems. For example, the incorporation of Pluronics into lipid vesicles was reported to impair lipid packing, leading to increased lipid mobility and easier membrane permeation.20,21 However, for a lipid monolayer or bilayer, the insertion of copolymers improves the lipid ordering by packing the lipids tightly.22,23
In this study, we investigate the interactions of PEO–PPO–PEO triblock copolymers with supported lipid bilayers (SLBs). SLBs can be used as a model for cell membranes.24 An important feature of SLBs is their fluidity on a solid support. The main structural feature of SLBs is the asymmetry in the membrane environment: one membrane leaflet is exposed to an aqueous solution, while the other is exposed to a solid support. This leaflet asymmetry has been reported to cause the differences in the surface tension, lipid diffusion, and phase transition temperature between SLBs and free membranes.25–31 In this work, F68 and F98 Pluronics were chosen because they have the same HLB value but the lengths of their lipophilic PPO blocks differ. Thus, the effect of the length of the lipophilic block on polymer–lipid association and copolymer conformation can be studied.
We utilized microcantilever sensors to study the interactions of Pluronic copolymer with SLBs; these sensors are capable of sensitively measuring the surface stress changes associated with liquid–solid systems.32 Surface-coated films, which are either physisorbed or chemisorbed on a biomaterial cantilever, cause a surface free energy change that results in cantilever bending,33 which can be readily detected using a position-sensitive detector. Conformational changes in the adsorbed molecular films have been readily observed using microcantilevers.34–36 SLBs have been used to study lipid interactions with other amphiphilic molecules, such as diblock copolymers37 and lysolipids.38 As a complement to our microcantilever experiments, we also studied the lipid diffusion and membrane fluidity in SLBs using fluorescence recovery after photobleaching (FRAP).39 A Langmuir adsorption-based model was developed to illustrate the relative affinity of the copolymers towards SLBs, and a free area theory was used when analyzing lipid diffusion. Our findings show that the solid support does indeed change the interactions of the triblock copolymers with the supported lipid membranes.
Materials and methods
Materials
A zwitterionic lipid, 1-palmitoyl-2-oleoyl-sn-glycero-3-phosphocholine (POPC), was purchased from Avanti Polar Lipids (Alabaster, AL). A fluorescent lipid, Texas Red-1,2-dihexadecanoyl-sn-glycero-3-phosphoethanolamine (TR-DHPE), was purchased from Invitrogen (Carlsbad, CA). Two poly(ethylene oxide)–poly(propylene oxide)–poly(ethylene oxide) (PEO–PPO–PEO) triblock copolymers (F68 and F98) were obtained from BASF Corporation (Mount Olive, NJ) under the name of Pluronic, Kolliphor, or Poloxamer, and their properties are summarized in Table 1. The values for the critical micelle concentration (CMC) were obtained using a force tensiometer (K100, Krüss GmbH, Germany) at 25 °C and 40 °C. The dithiol–alkane–aromatic PEG3-OH (PEG-SH) was purchased from SensoPath Technologies (Bozeman, MT). All the lipids and chemicals were used as received without further purification.
Table 1 Characteristics of PEO–PPO–PEO triblock copolymers
| Pluronic |
MWa g mol−1 |
PO units |
EO units |
PO/EO |
CPb °C |
CMC (M)c at 25 °C |
CMC (M)c at 40 °C |
|
Molecular weight.
Cloud point (corresponding to the phase separation temperature) in 10% aqueous solution.
Critical micelle concentration determined using a force tensiometer.
|
| F68 |
8400 |
30 |
2 × 75 |
0.2 |
>100 |
1.3 × 10⁻² |
8.2 × 10⁻⁴ |
| F98 |
13![[thin space (1/6-em)]](https://www.rsc.org/images/entities/char_2009.gif) 000 000 |
47 |
2 × 117 |
0.2 |
>100 |
7.5 × 10⁻³ |
2.7 × 10⁻⁵ |
Large unilamellar vesicles (LUVs)
LUVs were prepared by a standard extrusion method.40 Briefly, the POPC lipid was dissolved at 5 mg ml−1 in chloroform. For the fluorescent vesicles used in the FRAP experiments, 0.5 mol% of TR-DHPE was added to the chloroform solution. The chloroform was evaporated under a nitrogen stream. The resulting lipid film was dried in a vacuum chamber for 2 h and then hydrated in PBS (Sigma-Aldrich) buffer, followed by vortexing the solution. The solution was then extruded 40 times through a polycarbonate membrane using a miniextruder (Avanti Polar Lipids), resulting in a translucent solution of LUVs that were approximately 100 nm in diameter. The vesicle solution was further diluted 10 times in PBS and stored at 4 °C until use. Note that the final vesicle concentration may have been lower than initially desired due to lipid loss on the filter membranes after extrusion; however, the concentration was well above the threshold needed to achieve full surface coverage of the SLB.38
Preparation of microcantilever surfaces
Microcantilever chips were purchased from Concentris GmbH (Basel, Switzerland). Each chip contained eight rectangular silicon cantilevers coated with 3 nm of titanium followed by a 20 nm gold layer, resulting in a bimetallic structure. The cantilevers were 500 μm long, 100 μm wide, and 1 μm thick.41 The microcantilever chip was washed with a mixture of hydrogen peroxide and ammonia hydroxide at 75 °C and cleaned using a UV-ozone cleaner (Novascan) under 5 psi oxygen to generate a hydrophilic silicon dioxide surface. The gold surface of the cantilever was then coated with a PEG-SH monolayer to prevent vesicle binding. The surface functionalization process typically lasted 2 h.
Microcantilever assay
The physi- or chemisorption of molecules onto a bimaterial cantilever surface induces a mismatch in the surface stress in the two cantilever materials, causing the cantilever to bend. This is analogous to the bending of a biomaterial cantilever in response to a temperature change, which results from the mismatch in the thermal expansion coefficient of the two materials. The relationship between the cantilever deflection, Δz (m), and the change in surface stress, Δσ (N m−1), is described by Stoney's equation:42| |  | (1) |
where ν is Poisson's ratio of the cantilever material, E is Young's modulus, L is the cantilever length, and t is the cantilever thickness.
A commercial system (Cantisens research system from Concentris GmbH) was used to obtain the real-time deflection positions of the microcantilevers via a scanning laser diode aligned to the tip of the microcantilevers. The position of the reflected laser beam was captured using a position-sensitive detector (PSD) at a sampling frequency of 1 Hz.43 A solution of POPC vesicles was injected at a flow rate of 0.42 μl s−1 into the measurement chamber to form the SLBs on the silicon dioxide surface of the microcantilever. Then, the triblock copolymer (F68 or F98) solution at a concentration of 10, 50, 100, or 500 μM in PBS was injected at various temperatures (25, 30, 35, or 40 °C). Because of small variations in the material properties of the cantilevers, such as the stiffness or the thickness of the gold layer, the deflections of the microcantilevers were normalized by each cantilever's change in deflection due to a 1 °C change in temperature.32 Each experiment was repeated at least three times on either the same or a different chip, with a minimum of five cantilevers on one chip.
Fluorescence recovery after photobleaching (FRAP)
Fluorescence recovery after photobleaching (FRAP) is a well-established technique for measuring the fluidity and lateral mobility of lipids,44 as well as the proteins within a lipid bilayer.45 For the FRAP experiments, a simple microfluidic flow cell was created to generate SLBs. A simple rectangular microfluidic channel that was 2 cm in length, 0.5 mm in width, and 50 μm in height was fabricated in polydimethylsiloxane (PDMS) using standard soft lithography techniques46–48 and bonded to a glass coverslip. The glass coverslip for the microfluidic device was cleaned with a mixture of hydrogen peroxide and ammonia hydroxide at 75 °C and oxygen plasma (Harrick Plasma). Initially, the SLB was formed on the coverslip by injecting a fluorescent LUV solution (POPC with 0.5 mol% TR-DHPE) at a rate of 10 μl min−1 for 10 min into the microfluidic channel using a syringe pump followed by PBS buffer to remove excess vesicles. Then, the triblock copolymer (F68 or F98) solution at a concentration of 100 μM was injected at various temperatures (25, 30, 35, or 40 °C), followed by PBS buffer.
The fluidity of the lipids with and without the triblock copolymers was characterized by FRAP using confocal microscopy (Olympus IX81). A 23 μm spot was photobleached by the light source, a mercury lamp at 405 nm, for 60 s. The fluorescence intensities of this spot and the surrounding area (used as control) were monitored over time using a 40× objective.44 The fluorescence fraction is defined as follows:
| |  | (2) |
where
F(
t) is the fluorescence intensity as a function of time,
F(0) is the fluorescence intensity before bleaching, and
F(∞) is the final recovered intensity. Thus, the recovery half time,
τ1/2, is determined as the time where
f(
t) = 1/2,
r is the radius of the bleached area, and
γD is a factor accounting for both the beam shape and the bleaching extent. The lateral diffusion coefficients of the lipids were calculated using the following equation:
49| |  | (3) |
Mathematical modeling of the polymer–lipid interaction on microcantilevers
The association of triblock copolymers with POPC SLBs on the cantilever surface was theoretically studied using a Langmuir isotherm model.50 The association process is given by the following:| |  | (4) |
In eqn (4), SPOPC represents the POPC bilayer, polymer represents the Pluronic, and KA is the association constant, which allows us to compare the relative affinities of different Pluronics towards the SLBs.51,52 At equilibrium, the polymer–SLB interaction can be written as an association/disassociation reaction rate:
| | | kA[Polymer](1 − θ) = k−Aθ | (5) |
where
θ is the fraction of the SLBs with attached polymer and (1 −
θ) represents the sites available for further polymer association. Defining
KA as the ratio of
kA to
k−A, the following equation describes the relationship between the polymer concentration and the surface stress change measured on the cantilever (a detailed derivation has been previously reported
53 and is shown in the ESI
†):
| |  | (6) |
where [Polymer] is the molar concentration of the triblock copolymers. ΔStress is the change in surface stress caused by the polymer, and ΔStress
max is the maximum change in surface stress when the polymer saturates the surface.
KA is obtained from the plot of [Polymer]/ΔStress with respect to [Polymer].
Free area model for lipid diffusion in FRAP
A free area model is used to characterize the lipid diffusion in an SLB.54,55 In this model, the lateral diffusion of the molecules was considered to be a two-dimensional random motion. To move, a lipid must meet two requirements: a minimum empty surrounding area and a sufficient activation energy.56,57 Therefore, the diffusion coefficient can be affected by two possibilities:with  where p(a) is the Boltzmann distribution of a lipid with a minimum free surrounding area af, and p(E) is the probability that the activation energy, Ea, normalized to the thermal energy, kT, is sufficient. a(T) is the average lipid area, and a0 is the critical area of the lipid when it is closely packed. Thus, the average free area of lipids is af = a(T) – a0, where k is the Boltzmann constant. A detailed derivation of this model has been previously reported by Reits et al.45 In a two-dimensional SLB, the diffusion coefficient of lipids can be expressed as follows:
| |  | (8) |
where Na is Avogadro's constant, and M is the average molecular weight. The above equation is only valid for pure lipids. However, for the association of the triblock copolymer with the SLBs, the effect of the polymer on lipid diffusion must be considered. The free area decreases, and the activation energy changes. Two parameters, the average polymer area apoly0 and the molar ratio of polymer to lipid n, are introduced in the following equation:| |  | (9) |
The activation energy, Ea, and the molar ratio of polymer to lipid, n, are fitting parameters, which are obtained by nonlinear least squares fitting. More details about this model are provided in the supplemental information.
Results and discussion
Microcantilever study of the triblock copolymer interaction with the supported lipid bilayer
To form supported lipid bilayers (SLBs) on a microcantilever surface, the gold side of the cantilever is first inactivated by PEG-SH. Then, upon the addition of LUVs, the vesicles fuse onto the clean hydrophilic silicon dioxide side of the cantilever and rupture to form a planar lipid bilayer. Fig. 1 shows a representative result of how the cantilever deflection changes with the introduction of various components. As indicated by the blue shaded area in Fig. 1, a compressive surface stress is induced by the SLB formation, causing the cantilever to bend toward the gold side. After the switch back to PBS buffer, the microcantilever remains deflected, confirming that a stable SLB has formed. The solution of the triblock copolymer, F98 or F68, is later introduced to the SLBs, causing a further compressive surface stress to the microcantilever (shown by the green shaded area in Fig. 1). The change in the surface stress after the switch back to the buffer flow indicates the association of the copolymer with the supported lipid bilayer.
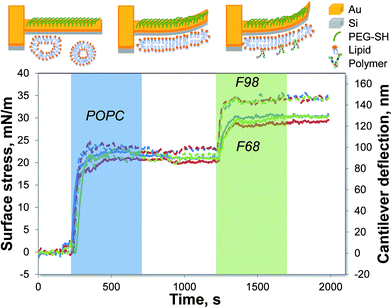 |
| | Fig. 1 Measurement of the triblock copolymer interaction with SLBs using microcantilevers. The SLB is formed on a PEG-coated cantilever prior to the introduction of a 50 μM F98 (dashed lines) or F68 (solid lines) solution at 35 °C. The lines with different colors represent the various cantilevers on one chip. The shaded areas indicate the time when the lipid vesicles (blue) or copolymers (green) are introduced to the measurement chamber. The top diagrams illustrate the bending of the microcantilevers. | |
The length of the lipophilic block has been reported to be an important parameter influencing the interaction of the copolymer with the lipid bilayer.15 Thus, two triblock copolymers that differed in the length of the lipophilic PPO block are studied. Fig. 1 shows that F98, with the longer PPO, has a stronger association with the POPC SLB than F68 does. The two copolymers are further investigated at various concentrations and temperatures, as shown in Fig. 2. For each cantilever, the microcantilever signal is normalized by the thermo-mechanical sensitivity to offset the differences between cantilevers. At a certain temperature, as the copolymer concentration increases, the change in surface stress increases, corresponding to a stronger association between the triblock copolymer and the SLB. The association of either F98 or F68 is also found to be enhanced with increasing temperatures. The extent of association, which is directly proportional to the magnitude of surface stress change, reflects the relative solubility of each copolymer in the SLBs at a specific temperature. Both F98 and F68 show increased solubility in the SLBs with increasing temperature. The solubility increases because the triblock copolymer becomes more hydrophobic at higher temperatures.12,13 The effect of temperature on this solubility in SLBs is in agreement with the interaction measured in lipid monolayers14 and vesicles.19 Although concentration and temperature have a similar influence on F98 and F68, these copolymers display different solubilities in the POPC SLBs. At the same temperature, the association of the triblock copolymer with the longer lipophilic block (F98) is much stronger than that of the shorter copolymer (F68). The polymer–lipid interaction is highly dependent on the temperature, as well as the length of the lipophilic PPO block of the Pluronic.
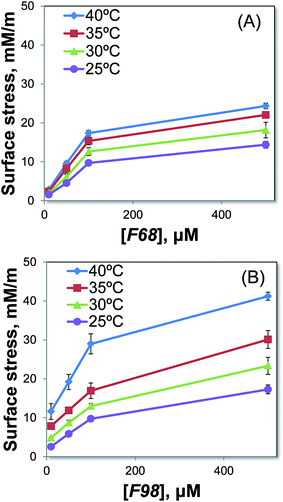 |
| | Fig. 2 Investigation of the association of the triblock copolymers F68 (A) and F98 (B) at concentrations of 10, 50, 100, or 500 μM with POPC SLBs under various conditions. F68 has a shorter PPO block, while F98 has a longer PPO block. Four temperatures are tested: 25 °C (purple), 30 °C (green), 35 °C (red), and 40 °C (blue). | |
Mathematical modeling and calculation of the association constants
The association affinity between the triblock copolymers and the SLBs on microcantilevers can be determined by modeling the process using a Langmuir isotherm model.18 This model has been previously used to describe the binding between antigen–antibody systems on microcantilevers.43,53 The association constant KA is calculated using eqn (6). Fig. 3 shows the plots of [Polymer]/ΔStress with respect to [Polymer] for F68 and F98 at 40 °C because at this temperature, the two copolymers display the greatest difference in the association with the SLBs. In each plot, four data points are used to optimize the linear data fitting. From the slope and intercept of each plot, the association constant KA is calculated (Table 2). The values of KA represent the relative solubility of each copolymer in the POPC SLBs, and the largest value corresponds to the highest solubility. The relative solubility calculated here refers to the capacity of each copolymer for association with the POPC SLBs at a specific temperature. Thus, as shown in Table 2, the association constants become larger with increasing temperature, which is consistent with our experimental results. Because F98 has a longer lipophilic block than F68, it displays larger association constants than those of F68 at corresponding temperatures, confirming its higher solubility in SLBs, particularly at high temperatures. Meanwhile, the change in the association constant KA from 25 to 40 °C is larger for F98 than for F68; thus, the solubility of F98 in SLBs is more sensitive to temperature.15 This sensitivity is likely a result of the longer PPO block of F98. Fitting the experimental data to the derived mathematical equation (eqn (6)) allows us to quantitatively determine the relative solubilities of the copolymers in POPC SLBs.
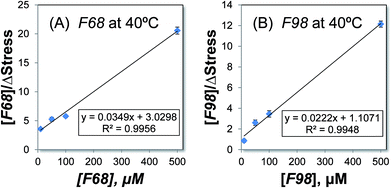 |
| | Fig. 3 Determining the association constant, KA, for the copolymers F68 (A) and F98 (B) at 40 °C. The experimental results for [Polymer]/ΔStress are plotted with respect to [Polymer] and fit to eqn (6). The equations for the trend lines and the R-squared values are shown. | |
Table 2 Association constants KA (μM−1) at various temperatures
| Constant KA |
F68 |
F98 |
| 25 °C |
0.009011 |
0.009796 |
| 30 °C |
0.009488 |
0.011837 |
| 35 °C |
0.010351 |
0.013471 |
| 40 °C |
0.011519 |
0.020052 |
Effect of triblock copolymers on lipid diffusion measured using FRAP
A typical FRAP experiment for a POPC SLB is shown in Fig. 4. After photobleaching, the fluorescence intensity of the bleached area increases with time (images b–f) and finally reaches a value comparable to that before bleaching (image a). The lipid diffusion coefficient is quantitatively determined from the rate of fluorescence recovery using eqn (3). The measured lipid diffusion coefficients, D, with or without triblock copolymers are reported in Fig. 5A. For the FRAP experiments, a copolymer concentration of 100 μM was chosen because this concentration induced the sharpest increase in surface stress for the microcantilevers (Fig. 2). For the POPC SLBs with or without copolymers, the lipid diffusion is always enhanced as the temperature increases.59 However, the increase in the diffusion coefficient for SLBs with copolymers is obviously smaller than that for the pure SLB system, indicating that the copolymer association inhibited the lipid diffusion. In addition, this inhibition effect is stronger for F98 than for F68. To better illustrate the copolymer-induced hindered diffusion, a normalized diffusion coefficient is defined as the ratio of the diffusion coefficient of the lipids in an SLB with copolymer to the diffusion coefficient of the lipids in a pure POPC SLB at the corresponding temperatures (Fig. 5B). Because the temperature effect is eliminated, the normalized D is the same for pure POPC at various temperatures and is reduced at higher temperatures for the POPC with copolymers. However, the decrease in the normalized D for POPC with F98 is much faster than with F68. Therefore, the lipid diffusion is slightly hindered by F68, and the temperature has a small effect on this inhibition. However, our microcantilever results in Fig. 2 indicate that the higher temperatures increase the hydrophobicity of the copolymer and further improve the copolymer association with the SLBs. As a result, the inconsistency between the minimal effect of the F68-induced diffusion inhibition and its large influence on the association of F68 with SLBs indicates a small effect of the F68 association on the lipid fluidity; this finding further suggests that the adsorption of F68 occurs on the outer leaflet of the SLBs. F98 has a different effect on the lipid diffusion, hindering the lipid diffusion at higher temperatures. Thus, the temperature effect on diffusion inhibition is consistent with the copolymer association, suggesting deeper insertion of F98 into the SLB. The different effects of F68 and F98 result from the difference in the length of the lipophilic PPO block. The PPO block of F68 is too short to insert into the hydrophobic region of the lipid bilayer; thus, its adsorption only slightly hinders lipid diffusion, and more association does not further hinder diffusion. However, the long PPO block of F98 allows for deeper insertion, which highly hinders lipid diffusion, and this effect increases with increasing temperature.
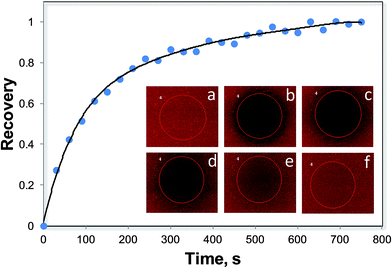 |
| | Fig. 4 Recovery of fluorescence for POPC SLB with TR-DHPE as an indicator. The SLB was formed on the surface of a microfluidic device at 25 °C. The images show the FRAP data measured by confocal microscopy. (a) SLB before photobleaching; (b–f) fluorescence recovery with respect to time. | |
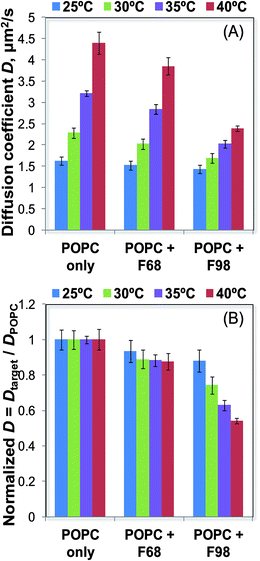 |
| | Fig. 5 Diffusion coefficient D measured by FRAP for POPC with and without Pluronics (A). The concentration of either F68 or F98 is 100 μM. To better illustrate the effect of the polymer on the lipid diffusion, a normalized diffusion coefficient is obtained by normalizing the data using the diffusion coefficient of the lipids in a pure POPC SLB (B). | |
Modeling the lipid diffusion using a free area theory
The effect of the triblock copolymers on the lateral diffusion of the lipid molecules is investigated using the free area theory, which has been used for a quantitative study of lipid diffusion.56,60–62 The free area theory accounts for both the activation energy and the free area. The diffusion coefficient can be calculated from eqn (9). Fig. 6 shows the fitting of the free area model to the experimental data. The calculated diffusion coefficients are expressed as a function of temperature and accurately reproduce the variation trend in the lipid diffusion: the diffusion is hindered more strongly by F98 than by F68, and the inhibition increases with increasing temperature. Additionally, the molar ratio of polymer to lipid, n, is also calculated from the free area model by nonlinear least squares fitting, as shown in Table 3. The ratio n is larger and more affected by temperature for F98 than for F68, demonstrating the larger solubility of F98 in the SLBs, which is also confirmed by the cantilever and FRAP data. Furthermore, the relative values of n agree well with the variation trend in the surface stress change from the microcantilevers in Fig. 2 for the corresponding conditions; this result indicates that n also reflects the amount of copolymers associated with the SLBs on the cantilever surface.
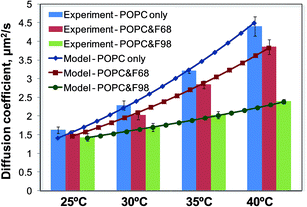 |
| | Fig. 6 Diffusion coefficient D as a function of temperature for three systems: POPC only (blue), POPC with F68 (red), and POPC with F98 (green). The bar graph shows the experimental data, while the lines show the diffusion coefficient calculated from the free area model, according to eqn (8) and (9). | |
Table 3 Molar ratio of polymer to lipids n (%) at various temperatures
| Ratio n |
F68 |
F98 |
| 25 °C |
4.74 |
5.18 |
| 30 °C |
5.43 |
6.86 |
| 35 °C |
6.11 |
8.54 |
| 40 °C |
6.79 |
10.22 |
To better illustrate the solubility of the triblock copolymers in supported lipid bilayers, Fig. 7 shows the possible temperature dependence of the Pluronics conformations within the lipid model SLBs. At low temperatures, F68 or F98 adsorbs weakly to the outer leaflet of the SLBs and slightly hinders lipid diffusion. Although the two copolymers are different, the adsorption or inhibition effect of F98 is slightly higher than that of F68. However, with increasing temperature, the difference between F68 and F98 becomes larger. Although the association of F68 increases at higher temperatures, the inhibition of the lipid diffusion does not change much because F68 only partially inserts into SLBs due to its short PPO block. For F98, which has a long lipophilic PPO block, the higher temperature not only increases its association with the SLBs but also allows for greater insertion into the hydrophobic region of the SLBs, which highly hinders the lipid diffusion. In this study, although F98 has the potential to span the SLB, as reported previously for lipid bilayers,15,16 it would prefer to have the PEO ends remain on the outer leaflet. The reason lies in the asymmetric environment of the SLBs.25 The proximal leaflet of the SLB is confined by a thin water layer and the solid support. The energy penalty for disrupting this confinement is too great. The inhibitory effect of the triblock copolymers on the lipid diffusion in this study is consistent with the results from studies using a lipid monolayer22,23 but different from those for the studies using vesicles,20,21 where lipid fluidity is enhanced. Additionally, for a lipid monolayer prepared on a Langmuir trough or for a supported lipid bilayer on solid surface, the packing of lipids is either controlled at steady surface pressure63 or confined by a solid support;41 thus, the insertion of copolymers tightens the lipid packing and reduces the membrane permeability and lipid diffusion.22 In contrast, the lipid packing is not confined in lipid vesicles, where the presence of copolymers during vesiculation increases the size of the lipid vesicles.18 Therefore, the incorporation of copolymers disturbs the lipid packing and accelerates the leakage and mobility of the membrane.21
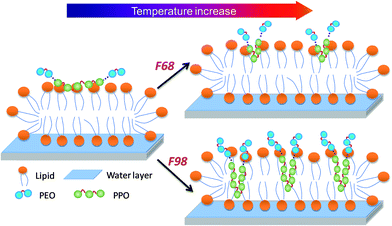 |
| | Fig. 7 Schematic of the possible temperature dependence of the SLB interactions with different Pluronics. | |
Conclusion
The solubility of triblock copolymers in SLBs was studied using microcantilevers and FRAP. To better understand the polymer–lipid interactions, a Langmuir isotherm model and a free mean area theory were used to explore the association of the copolymers with the SLBs and hindered lipid diffusion, respectively. The SLB is interesting in that it has an asymmetry: one leaflet is exposed to solution, while the other is confined by a solid support. This asymmetry can greatly affect polymer–lipid interactions. The microcantilever results indicate that the association of the triblock copolymers with a POPC SLB is enhanced with increasing temperature, where F98 is more sensitive to temperature than F68 due to the longer lipophilic block. The FRAP data, which monitor the copolymer-induced inhibition of lipid diffusion, further demonstrate the possible conformations of soluble Pluronics within SLBs. We suggest that greater inhibition of lipid diffusion indicates greater copolymer insertion into the SLBs. Therefore, both F68 and F98 adsorb onto the bilayer surface at low temperatures without affecting lipid diffusion. However, at higher temperatures, F98 inserts into the SLBs, as indicated by its high inhibition of lipid diffusion, whereas F68 just partially inserts into the SLBs, and the inhibition remains low. In summary, although the solubilities of F68 and F98 in SLBs both increase with temperature, the solubility of F98 with its longer PPO block is always higher and more sensitive than that of F68.
Acknowledgements
This research was funded by a grant from The Welch Foundation (Grant C-1755). We also acknowledge Benjamin Wang for assisting with cantilever experiments.
References
- C. Guo, J. Wang, H. Z. Liu and J. Y. Chen, Langmuir, 1999, 15, 2703–2708 CrossRef CAS.
- R. C. Lee, L. P. River, F. S. Pan, L. Ji and R. L. Wollmann, Proc. Natl. Acad. Sci. U. S. A., 1992, 89, 4524–4528 CrossRef CAS.
- J. T. Padanilam, J. C. Bischof, R. C. Lee, E. G. Cravalho, R. G. Tompkins, M. L. Yarmush and M. Toner, Ann. N. Y. Acad. Sci., 1994, 720, 111–123 CrossRef CAS PubMed.
- J. Hannig, J. Yu, M. Beckett, R. Weichselbaum and R. C. Lee, Int. J. Radiat. Biol., 1999, 75, 379–385 CrossRef CAS.
- J.-Y. Wang, J. Marks and K. Y. C. Lee, Biomacromolecules, 2012, 13, 2616–2623 CrossRef CAS PubMed.
- D. Cohn, A. Sosnik and A. Levy, Biomaterials, 2003, 24, 3707–3714 CrossRef CAS.
- A. Sosnik and D. Cohn, Biomaterials, 2004, 25, 2851–2858 CrossRef CAS PubMed.
- X. Y. Xiong, K. C. Tam and L. H. Gan, J. Nanosci. Nanotechnol., 2006, 6, 2638–2650 CrossRef CAS PubMed.
- P. Alexandridis and T. A. Hatton, Colloids Surf., A, 1995, 96, 1–46 CrossRef CAS.
- G. Wanka, H. Hoffmann and W. Ulbricht, Macromolecules, 1994, 27, 4145–4159 CrossRef CAS.
- S. L. Frey, D. Zhang, M. A. Carignano, I. Szleifer and K. Y. C. Lee, J. Chem. Phys., 2007, 127 Search PubMed.
- P. Alexandridis, J. F. Holzwarth and T. A. Hatton, Macromolecules, 1994, 27, 2414–2425 CrossRef CAS.
- P. Linse, Macromolecules, 1993, 26, 4437–4449 CrossRef CAS.
- S. L. Frey and K. Y. C. Lee, Langmuir, 2007, 23, 2631–2637 CrossRef CAS PubMed.
- M. A. Firestone, A. C. Wolf and S. Seifert, Biomacromolecules, 2003, 4, 1539–1549 CrossRef CAS PubMed.
- S. Hezaveh, S. Samanta, A. De Nicola, G. Milano and D. Roccatano, J. Phys. Chem. B, 2012, 116, 14333–14345 CrossRef CAS PubMed.
- S. A. Maskarinec and K. Y. C. Lee, Langmuir, 2003, 19, 1809–1815 CrossRef CAS.
- K. Kostarelos, T. F. Tadros and P. F. Luckham, Langmuir, 1999, 15, 369–376 CrossRef CAS.
- M. Johnsson, M. Silvander, G. Karlsson and K. Edwards, Langmuir, 1999, 15, 6314–6325 CrossRef CAS.
- J.-Y. Wang, J. Chin, J. D. Marks and K. Y. C. Lee, Langmuir, 2010, 26, 12953–12961 CrossRef CAS PubMed.
- T. Demina, I. Grozdova, O. Krylova, A. Zhirnov, V. Istratov, H. Frey, H. Kautz and N. Melik-Nubarov, Biochemistry, 2005, 44, 4042–4054 CrossRef CAS PubMed.
- G. H. Wu, J. Majewski, C. Ege, K. Kjaer, M. J. Weygand and K. Y. C. Lee, Biophys. J., 2005, 89, 3159–3173 CrossRef CAS PubMed.
- B. Lee and M. A. Firestone, Biomacromolecules, 2008, 9, 1541–1550 CrossRef PubMed.
- M. Tanaka and E. Sackmann, Nature, 2005, 437, 656–663 CrossRef CAS PubMed.
- J. Wang, K.-W. Liu, L. Segatori and S. L. Biswal, J.
Phys. Chem. B, 2014, 118, 171–178 CrossRef CAS PubMed.
- C. A. Keller and B. Kasemo, Biophys. J., 1998, 75, 1397–1402 CrossRef CAS.
- C. A. Keller, K. Glasmastar, V. P. Zhdanov and B. Kasemo, Phys. Rev. Lett., 2000, 84, 5443–5446 CrossRef CAS.
- R. Richter, A. Mukhopadhyay and A. Brisson, Biophys. J., 2003, 85, 3035–3047 CrossRef CAS.
- S. Chah and R. N. Zare, Phys. Chem. Chem. Phys., 2008, 10, 3203–3208 RSC.
- K. Tawa and K. Morigaki, Biophys. J., 2005, 89, 2750–2758 CrossRef CAS PubMed.
- C. Y. Xing and R. Faller, J. Phys. Chem. B, 2008, 112, 7086–7094 CrossRef CAS PubMed.
- S. L. Biswal, D. Raorane, A. Chaiken, H. Birecki and A. Majumdar, Anal. Chem., 2006, 78, 7104–7109 CrossRef CAS PubMed.
- L. A. Pinnaduwage, V. I. Boiadjiev, J. E. Hawk, A. C. Gehl, G. W. Fernando and L. C. R. Wijewardhana, Nanotechnology, 2008, 19, 105501 CrossRef PubMed.
- F. Zhou, P. M. Biesheuvel, E. Y. Chol, W. Shu, R. Poetes, U. Steiner and W. T. S. Huck, Nano Lett., 2008, 8, 725–730 CrossRef PubMed.
- G. H. Wu, H. F. Ji, K. Hansen, T. Thundat, R. Datar, R. Cote, M. F. Hagan, A. K. Chakraborty and A. Majumdar, Proc. Natl. Acad. Sci. U. S. A., 2001, 98, 1560–1564 CrossRef CAS.
- M. Watari, J. Galbraith, H. P. Lang, M. Sousa, M. Hegner, C. Gerber, M. A. Horton and R. A. McKendry, J. Am. Chem. Soc., 2007, 129, 601–609 CrossRef CAS PubMed.
- R. M. A. Sullan, W. Shi, H. Chan, J. K. Li and G. C. Walker, Soft Matter, 2013, 9, 6245–6253 RSC.
- K.-W. Liu and S. L. Biswal, Anal. Chem., 2011, 83, 4794–4801 CrossRef CAS PubMed.
- A. A. Brian and H. M. McConnell, Proc. Natl. Acad. Sci. U. S. A., 1984, 81, 6159–6163 CrossRef CAS.
- Y. H. Kim, M. M. Rahman, Z. L. Zhang, N. Misawa, R. Tero and T. Urisu, Chem. Phys. Lett., 2006, 420, 569–573 CrossRef CAS PubMed.
- K.-W. Liu and S. L. Biswal, Anal. Chem., 2010, 82, 7527–7532 CrossRef CAS PubMed.
- G. G. Stoney, Proc. R. Soc. London, Ser. A, 1909, 82, 172–175 CrossRef CAS.
- J. Wang, M. J. Morton, C. T. Elliott, N. Karoonuthaisiri, L. Segatori and S. L. Biswal, Anal. Chem., 2014, 86, 1671–1678 CrossRef CAS PubMed.
- A. J. Diaz, F. Albertorio, S. Daniel and P. S. Cremer, Langmuir, 2008, 24, 6820–6826 CrossRef CAS PubMed.
- E. A. J. Reits and J. J. Neefjes, Nat. Cell Biol., 2001, 3, E145–E147 CrossRef CAS PubMed.
- Y. N. Xia and G. M. Whitesides, Annu. Rev. Mater. Sci., 1998, 28, 153–184 CrossRef CAS.
- G. C. Kini, J. Lai, M. S. Wong and S. L. Biswal, Langmuir, 2010, 26, 6650–6656 CrossRef CAS PubMed.
- K. Ma, J. Rivera, G. J. Hirasaki and S. L. Biswal, J. Colloid Interface Sci., 2011, 363, 371–378 CrossRef CAS PubMed.
- D. Axelrod, D. E. Koppel, J. Schlessinger, E. Elson and W. W. Webb, Biophys. J., 1976, 16, 1055–1069 CrossRef CAS.
- S. Velanki, S. Kelly, T. Thundat, D. A. Blake and H.-F. Ji, Ultramicroscopy, 2007, 107, 1123–1128 CrossRef CAS PubMed.
- K. Matsumoto, A. Torimaru, S. Ishitobi, T. Sakai, H. Ishikawa, K. Toko, N. Miura and T. Imato, Talanta, 2005, 68, 305–311 CrossRef CAS PubMed.
- G. Sakai, T. Saiki, T. Uda, N. Miura and N. Yamazoe, Sens. Actuators, B, 1997, 42, 89–94 CrossRef CAS.
- J. Wang, M. AlMakhaita, S. L. Biswal and L. Segatori, J. Biosens. Bioelectron., 2012, 3, 115 CAS.
- M. H. Cohen and D. Turnbull, J. Chem. Phys., 1959, 31, 1164–1169 CrossRef CAS PubMed.
- H. J. Galla, W. Hartmann, U. Theilen and E. Sackmann, J. Membr. Biol., 1979, 48, 215–236 CrossRef CAS.
- W. L. C. Vaz, R. M. Clegg and D. Hallmann, Biochemistry, 1985, 24, 781–786 CrossRef CAS.
- P. B. Macedo and T. A. Litovitz, J. Chem. Phys., 1965, 42, 245–256 CrossRef CAS PubMed.
- P. F. F. Almeida, W. L. C. Vaz and T. E. Thompson, Biochemistry, 1992, 31, 6739–6747 CrossRef CAS.
- D. E. Golan, M. R. Alecio, W. R. Veatch and R. R. Rando, Biochemistry, 1984, 23, 332–339 CrossRef CAS.
- R. Peters and K. Beck, Proc. Natl. Acad. Sci. U. S. A., 1983, 80, 7183–7187 CrossRef CAS.
- P. C. Ke and C. A. Naumann, Langmuir, 2001, 17, 5076–5081 CrossRef CAS.
- M. Gudmand, M. Fidorra, T. Bjornholm and T. Heimburg, Biophys. J., 2009, 96, 4598–4609 CrossRef CAS PubMed.
- S. A. Maskarinec, J. Hannig, R. C. Lee and K. Y. C. Lee, Biophys. J., 2002, 82, 1453–1459 CrossRef CAS.
Footnote |
| † Electronic supplementary information (ESI) available. See DOI: 10.1039/c4sm00928b |
|
| This journal is © The Royal Society of Chemistry 2014 |
Click here to see how this site uses Cookies. View our privacy policy here.  Open Access Article
![[thin space (1/6-em)]](https://www.rsc.org/images/entities/char_2009.gif) 000
000


 where p(a) is the Boltzmann distribution of a lipid with a minimum free surrounding area af, and p(E) is the probability that the activation energy, Ea, normalized to the thermal energy, kT, is sufficient. a(T) is the average lipid area, and a0 is the critical area of the lipid when it is closely packed. Thus, the average free area of lipids is af = a(T) – a0, where k is the Boltzmann constant. A detailed derivation of this model has been previously reported by Reits et al.45 In a two-dimensional SLB, the diffusion coefficient of lipids can be expressed as follows:


