 Open Access Article
Virus particle assembly into crystalline domains enabled by the coffee ring effect†
Ronald
Gebhardt‡
a,
Jean-Marie
Teulon
b,
Jean-Luc
Pellequer
b,
Manfred
Burghammer
ac,
Jacques-Philippe
Colletier
def and
Christian
Riekel
*a
aEuropean Synchrotron Radiation Facility, CS 40220, F-38043 Grenoble Cedex 9, France. E-mail: riekel@esrf.fr
bCEA, iBEB, Service de Biochimie et Toxicologie Nucléaire, F-30207 Bagnols sur Cèze, France
cDepartment of Analytical Chemistry Ghent University Krijgslaan 281, S12B-9000 Ghent, Belgium
dUniv. Grenoble Alpes, Institut de Biologie Structurale (IBS), F-38027 Grenoble, France
eCNRS, IBS, F-38027 Grenoble, France
fCEA, DSV, IBS, F-38027 Grenoble, France
First published on 8th May 2014
Abstract
Tobacco mosaic virus particles can be rapidly assembled into 3D-domains by capillary flow-driven alignment at the triple contact-line of an evaporating droplet. Virus particles of ∼150 Å diameter can be resolved within individual domains at the outer rim of the “coffee-ring” type residue by atomic force microscopy. The crystalline domains can also be probed by X-ray microdiffraction techniques. Both techniques reveal that the rod-like virus particles are oriented parallel to the rim. We further demonstrate the feasibility of collection of hk0 reflection intensities in GISAXS geometry and show it allows calculating a low-resolution electron density projection along the rod axis.
The evaporation of droplets on a wetting surface results in mass transport to the air-interface.1 The “coffee-ring” effect designates capillary-flow driven deposition of particles at the pinned contact-line of such droplets.1 Researchers have exploited the coffee-ring effect for evaporation-induced self-assembly (EISA) of hierarchical structures based on various types of colloidal and biological particles.2–6 Self-assembled thin layers and particles with well-defined shapes have been characterized in small volumes by imaging techniques such as TEM, SEM, AFM (transmission electron, scanning electron and atomic force microscopy).7–12 Yet, methodologies to structurally characterize fibrous supramolecular assemblies of anisotropic soft particles (e.g. filamentous virus particles) have been lacking so far. Such objects bear interesting potential for industrial and biotechnological purposes as they can serve as templates for the assembly of functional materials.13 Hence, our aim is developing methods to probe higher-order structures in fragile, coffee-ring induced self-assemblies. Here we show that the coffee-ring effect can be exploited to rapidly self-assemble and align tobacco mosaic virus (TMV) particles into crystalline domains.
TMV is a plant-virus forming filamentous structures.14 The ∼2.1 MDa, rod-like TMV particles have a length of ∼3000 Å, and a ∼180 Å diameter with a ∼40 Å cylindrical cavity.15 The TMV structure has been refined by X-ray fiber diffraction to 2.9 Å for highly oriented colloidal sols.16,17 Yet higher order crystallites, suitable for atomic level structure determination, were not obtained. Here, we report local microscopic evidence for the coffee-ring induced self-assembly of TMV particles into μm-scale crystalline domains, as demonstrated by AFM imaging and raster X-ray microdiffraction.18 Our results suggest that the coffee-ring effect could allow exploring the conditions of spontaneous structure formation of filamentous virus particles in small volumes.
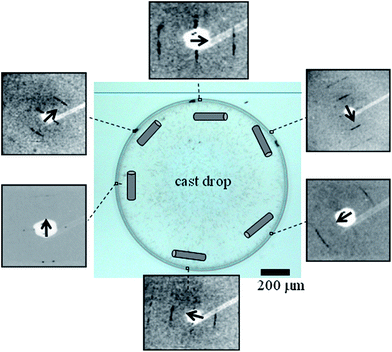
Evaporation of a ∼3 nM TMV solution droplet on a wetting glass substrate results in a ∼70 μm wide coffee-ring (Fig. 1 and ESI†).
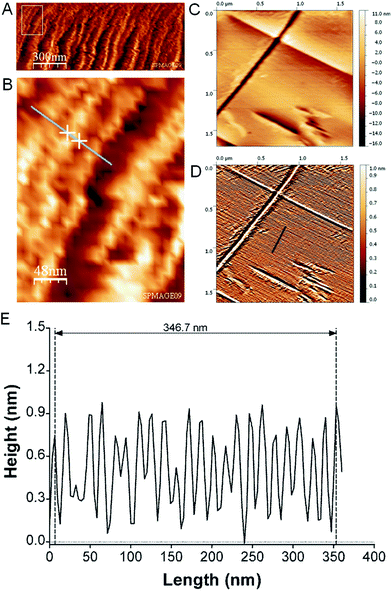
AFM imaging of the boundary-zone shows TMV rods lying flat on the substrate surface, with their long axis parallel to the exterior rim (Fig. 2A and B). The diameter of an individual rod is determined as 187 (±85; σ) Å from the horizontal extension of a single rod (Fig. 2B). We could image individual domains at a higher spatial resolution in the boundary-zone of a ∼44 nM TMV droplet residue (Fig. 2C and D). The processed image reveals lines due to highly packed TMV particles (Fig. 2D).19 The cross section shown in Fig. 2E corresponds to the dark blue lines in Fig. 2D. Over 23 peak-to-peak distances, the average regularity spacing is 150.7 (±15.4; σ) Å. This value is characteristic of highly packed TMV particles20 and also agrees with electron microscopy (EM) shadow-casting measurements which reported a spacing of 150 (±8) Å (ESI†).21
 | ||
| Fig. 2 (A) AFM image of boundary zone revealing an assembly of TMV-rods imaged in air in tapping mode. (B) Zoom of rectangular area in (A) used to determine the diameter of a TMV-rod from the distance of the two crosses as 187 (±85) Å. (C) Higher resolution AFM image and topography range of putative crystal of TMV particles imaged using contact mode in air. The raw AFM image was flattened using a polynomial function of 4th order. (D) Image after processing of raw image (C) using the enhanced dxy2 operation combined with histogram equalization procedure.19 The arbitrary topography range was scaled from 0 to 1. (E) Cross-section of processed AFM image along dark blue line in (D) with normalized height values. | ||
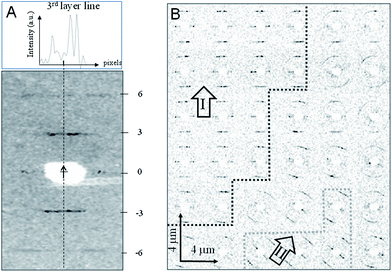
We used X-ray microdiffraction in transmission-geometry to map the residue with 4 μm raster-steps (Fig. 1, 3 and S3†). Data reveal an apparent fiber-texture with the local fiber-axis (c-axis) parallel to the boundary-zone (Fig. 1 and S3†) and with domains displaying homogeneous fiber-axis (c-axis) orientation (Fig. 3B and S3†) at its rim. Thus the X-ray data support the AFM data (Fig. 2A–E) and contrast with optical microscopy observations that suggested a normal orientation of the TMV particles at the 3-phase contact-line of the evaporating droplet.22 These domains show up to three layer-lines (n = 3, 6, 9). As the microbeam moves away from the rim boundary into the bulk, powder-like texture is appearing as evidenced by a bending of the layer-lines into arcs, presumably due to a randomization of fibrous domains (Fig. 3B and ESI†). We propose that the oriented domains result from rod-alignment at the boundary zone owing to weak convective forces, as suggested for β-type fibroin-domains prepared using a similar droplet deposition procedure.3 Local variations of layer-lines peak intensities suggest the presence of substructures within crystalline domains, which cannot be resolved by the 4 μm step raster-scan (Fig. S4 and S5†). The dimensions of these domains coincide with those of the domains observed by AFM (Fig. 2C and D).
 | ||
| Fig. 3 (A) Selected diffraction pattern recorded in transmission geometry with “idealized” fiber axis indicated by a dashed line and an arrow. The layer-lines are indexed for a 31 helical period. The upper inset shows the asymmetric intensity profile along the n = 3 layer-line (see also Fig. S4†). (B) Raster-diffraction scan with 4 μm step-increments displayed as composite diffraction image with individual “pixels” limited in angular-range to the n = +3/−3 layer lines. Zones of homogeneous orientation of patterns at the outer rim boundary reveal two domains (I and II) (see also Fig. S3A–C†). The overall orientation of the c-axes in each domain is indicated by an arrow. Domain boundary lines are only guides-to-the eye. A transition to powder-texture as evidenced by layer-line arcing is observed towards the edge of the domains. | ||
The diffraction patterns obtained from spontaneously grown TMV micro-crystals match the helical symmetry imposed by a right-handed helix formed by RNA and the coat protein (Fig. 3A). From the separation of the 3rd and 6th layer-lines, we derive a helical pitch of 22.43 (±0.03; fwhm) Å, a value close to that determined by X-ray diffraction from oriented TMV sols (22.92 (±0.03) Å).23 The small difference in helical pitch (>0.5 Å) is likely to be ascribed to differences in the hydration level of the TMV particles in crystallites and sols. Of note, a breakdown of fiber symmetry is observed, as indicated by isolated reflections and an asymmetric n = 3 layer-line intensity profile (Fig. 3A). The raster-mapping furthermore reveals local variations in the c-axis orientation, as well as in the number of observed layer-lines and their associated diffuse scattering. Thus, the micro-diffraction data indicate a loss of order at the edges of the crystallites.
That TMV-rods pack into 3D domains parallel to the rod-axis is also deducible from X-ray microdiffraction patterns obtained in low incidence angle reflection-geometry (GISAXS) (Fig. S2†). In this geometry, Bragg peaks are only observed when the microbeam aims at a domain within the boundary-rim (Fig. S6†). Evidently, previous GISAXS experiments on TMV multilayers with a 30 mm X-ray footprint12 did not allow resolving individual domains of the size observed in the present study.
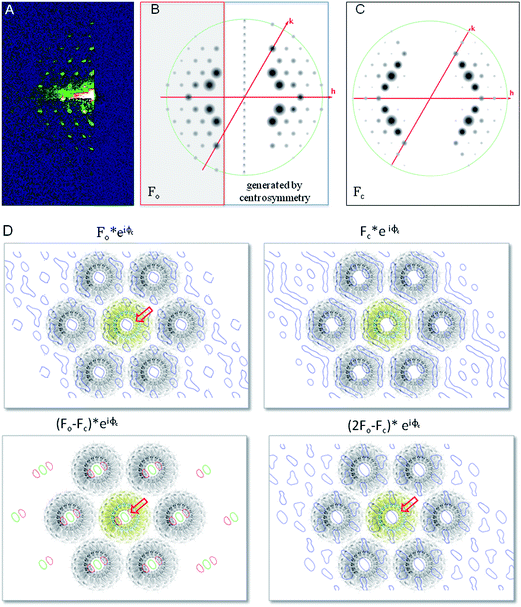
A selected pattern with a resolution limit of ∼16 Å was indexed as the hk0-plane of a primitive hexagonal cell with a = b = 172 (±0.5) Å, γ = 120° (Fig. 4B and C).
 | ||
| Fig. 4 (A) Low incidence angle reflection geometry (GISAXS) pattern. (B) Left: observed reflections represented as circles scaled to Fo = √io; right: reflections generated by centrosymmetric operation. (C) Calculated structure factors – Fc – represented as circles from PDB entry: 2TMV.16 the same map is obtained based on PDB id: 2OM3 (ESI†).29 (D) Electron density map, difference density map and composite map based on observed and calculated structure factor amplitudes (Fo, Fc) and phase angles (φc). (Displayed as P1 triclinic unit cell) the calculated values were derived from TMV fiber diffraction data (PDB entry: 2TMV16). Extra electron density in the central channel visible in the Fo and difference density maps is indicated by a red arrow; blue: electron density contoured at 0.8σ; green: positive difference electron density contoured at +2σ; red: negative difference electron density contoured at −2σ. | ||
The a-axis agrees to the minimum distance between TMV-rods determined by X-ray fiber diffraction,24 which implies that only one TMV microcrystal contributes to the observed diffraction and generates the unit cell, in agreement with cryo-TEM results.25 The pattern shown in Fig. 4A–C therefore results from the scattering of TMV-rods whose long axes are aligned along the substrate plane. The hexagonal close packed (HCP) lattice corresponds to a nearest neighbor distance of 149 (±0.4) Å (a![[thin space (1/6-em)]](https://www.rsc.org/images/entities/char_2009.gif) cos
cos![[thin space (1/6-em)]](https://www.rsc.org/images/entities/char_2009.gif) 30°), in excellent agreement with AFM measurements (150.7 (±15.4) Å – see above). The helical repeat (c-axis) of the unit-cell is 67.3 (±0.1) Å, as derived from the inter-peak distance measured on the pattern shown in Fig. 3D. The cell thus roughly corresponds to that reported for the biological unit of TMV in the structure solved by fiber-diffraction (PDB ID: 2TMV). From the radial width of the 2, 2, 0 reflection, we derive a particle size of about 2300 Å using Scherrer's equation,26 a value which roughly corresponds to 15 sheets of closely-packed TMV-rods. In that, our results differ from those obtained on uncorrelated 2D-assemblies or TMV-rafts generated by controlling the rod-interactions by ions27 or polymers.28
30°), in excellent agreement with AFM measurements (150.7 (±15.4) Å – see above). The helical repeat (c-axis) of the unit-cell is 67.3 (±0.1) Å, as derived from the inter-peak distance measured on the pattern shown in Fig. 3D. The cell thus roughly corresponds to that reported for the biological unit of TMV in the structure solved by fiber-diffraction (PDB ID: 2TMV). From the radial width of the 2, 2, 0 reflection, we derive a particle size of about 2300 Å using Scherrer's equation,26 a value which roughly corresponds to 15 sheets of closely-packed TMV-rods. In that, our results differ from those obtained on uncorrelated 2D-assemblies or TMV-rafts generated by controlling the rod-interactions by ions27 or polymers.28
In order to verify the goodness of our indexation and the accuracy of the measured structure-factor amplitudes, we computed low-resolution, projection electron-density maps using our subset of observed hk0 structure-factor amplitudes and calculated phases (Fo, φc) generated from published TMV structures (PDB entries: 2TMV, 2OM3).16,29 We then compared these maps to those generated using the same subset of calculated structures factors amplitudes and phases (Fc, φc). In both maps, the strongest contribution to the scattering comes from the proteinaceous shell of the virus. The RNA helix, around which the latter wraps, and the solvent channels regions both display weak electron densities. To evade phase bias as much as possible, 2Fo − Fc, φc and Fo − Fc, φc maps were produced (Fig. 4D). In both maps, a significant positive electron density peak was observed in the central channel of the TMV rod. The same observation was made when calculated structures factors were derived from the structure solved by cryo-TEM (Fig. S7†).29 This difference, which is likely at the origin of that observed between experimental (Fo) and calculated (Fc) structures factors amplitudes (Fig. 4D), can tentatively be ascribed to an increase in the salt concentration in the central channel of the virus, as the result of water evaporation at the contact line. Diffuse scattering on the layer lines is indicative of lattice disorder and indicates local variability within the crystallites (Fig. S6†). The presence of well defined bulk domain boundaries (Fig. 3B) and of individual reflections in the patterns (Fig. 3A and S4†) excludes, however, the model of an ideal paracrystal.30 It will be interesting exploring further whether 3D order and resolution can be improved by an optimization of parameters such as humidity, temperature, buffer concentration and speed of contact-line advancement. In addition, the use of X-ray nanobeams31 should allow probing smaller and therefore possibly more ordered domains.
In conclusion, our work demonstrates the possibility of filamentous virus crystallography from ultrasmall confined sample volumes. We propose that micro/nano X-ray diffraction techniques in conjunction with spontaneous crystallization using the coffee-ring effect could allow exploring crystalline domain formation in other fragile anisotropic macromolecular objects.
Experimental
More detailed information on the analytical and imaging techniques as well as the analysis of the diffraction patterns are provided in the ESI.†Acknowledgements
We thank Dr G. Schoehn (IBS-Grenoble, UMR5075 CEA-CNRS-UJF) for a gift of TMV sol, Dr O. Dhez for helping with the use of the AFM system and Dr C. Vendrely (LMGP-Grenoble) for assistance with the light scattering experiments. J.-P.C is a recipient of the Young International Scientist Fellowship from the Chinese Academy of Science.Notes and references
- R. D. Deegan, O. Bakajin, T. F. Dupont, G. Huber, S. R. Nagel and T. A. Witten, Nature, 1997, 389, 827–829 CrossRef CAS PubMed.
- L. Malaquin, T. Kraus, H. Schmid, E. Delamarche and H. Wolf, Langmuir, 2007, 23, 11513–11521 CrossRef CAS PubMed.
- R. Gebhardt, C. Vendrely, M. Burghammer and C. Riekel, Langmuir, 2009, 25, 6307–6311 CrossRef CAS PubMed.
- Y. Lin, Z. Su, G. Xiao, E. Balizan, G. Kaur, Z. Niu and Q. Wang, Langmuir, 2011, 27, 1398–1402 CrossRef CAS PubMed.
- C. Nobile, L. Carbone, A. Fiore, R. Cingolani, L. Manna and R. Krahne, J. Phys.: Condens. Matter, 2009, 21, 264013 CrossRef PubMed.
- K. Uetani and H. Yano, Soft Matter, 2013, 9, 3396–3401 RSC.
- R. Duggal, F. Hussain and M. Pasquali, Adv. Mater., 2006, 18, 29–34 CrossRef CAS.
- J. Xu, J. Xia and Z. Lin, Angew. Chem., Int. Ed., 2007, 46, 1860–1863 CrossRef CAS PubMed.
- T. Ming, X. Kou, H. Chen, T. Wang, H. L. Tam, K. W. Cheah, J. Y. Chen and J. Wang, Angew. Chem., Int. Ed., 2008, 47, 9685–9690 CrossRef CAS PubMed.
- L. J. Bonderer, A. R. Studart and L. J. Gauckler, Science, 2008, 319, 1069–1073 CrossRef CAS PubMed.
- T. K. Sau and C. J. Murphy, Langmuir, 2005, 21, 2923–2929 CrossRef CAS PubMed.
- S. P. Wargacki, B. Pate and R. A. Vaia, Langmuir, 2008, 24, 5439–5444 CrossRef CAS PubMed.
- A. Niu, J. Rong, L. A. Lee and Q. Wang, in Cellular and Biomolecular Recognition: Synthetic and Non-Biological Materials, ed. R. Jelinek, Wiley-VCH, Weinheim, 2009 Search PubMed.
- A. Kendall, M. McDonald, W. Bian, T. Bowles, S. C. Baumgarten, J. Shi, P. L. Stewart, E. Bullitt, D. Gore, T. Irving, W. M. Havens, S. A. Ghabrial, J. S. Wall and G. Stubbs, J. Virol., 2008, 82, 9546–9554 CrossRef CAS PubMed.
- A. Klug, Philos. Trans. R. Soc., B, 1999, 354, 531–535 CrossRef CAS PubMed.
- K. Namba, R. Pattanayek and G. Stubbs, J. Mol. Biol., 1989, 208, 307–325 CrossRef CAS.
- A. Kendall and G. Stubbs, J. Appl. Crystallogr., 2006, 39, 39–41 CrossRef CAS.
- C. Riekel, M. Burghammer, R. Davies, R. Gebhardt and D. Popov, in Applications of Synchrotron Light to Non-Crystalline Diffraction in Materials and Life Sciences, ed. M. García-Gutiérrez, A. Nogales, M. Gómez and T. A. Ezquerra, Springer, Heidelberg, 2008 Search PubMed.
- S.-W. W. Chen, M. Odorico, M. Meillan, L. Vellutini, J.-M. Teulon, P. Parot, B. Bennetau and J.-L. Pellequer, Nanoscale, 2013, 5, 10877–10886 RSC.
- M. H. Trinh, M. Odorico, L. Bellanger, M. Jacquemond, P. Parot and J. L. Pellequer, J. Mol. Recognit., 2011, 24, 503–510 CrossRef PubMed.
- I. Ohad, D. Danon and S. Hestrin, J. Cell Biol., 1963, 17, 321–326 CrossRef CAS.
- D. M. Kuncicky, R. R. Naik and O. D. Velev, Small, 2006, 2, 1462–1466 CrossRef CAS PubMed.
- A. Kendall, M. McDonald and G. Stubbs, Virology, 2007, 369, 226–227 CrossRef CAS PubMed.
- J. D. Bernal and I. Fankuchen, J. Gen. Physiol., 1941, 28, 111–165 CrossRef.
- J. H. Willison, J. Ultrastruct. Res., 1976, 54, 176–182 CrossRef CAS.
- H. P. Klug and L. E. Alexander, X-ray diffraction procedures for polycrystalline and amorphous materials, Wiley Interscience, New York, N.Y., 2nd edn, 1974 Search PubMed.
- L. Yang, S. T. Wang, M. Fukuto, A. Checco, Z. W. Niu and Q. Wang, Soft Matter, 2009, 5, 4951–4961 RSC.
- M. Imai, N. Urakami, A. Nakamura, R. Takada, R. Oikawa and Y. Sano, Langmuir, 2002, 18, 9918–9923 CrossRef CAS.
- C. Sachse, J. Z. Chen, P. D. Coureux, M. E. Stroupe, M. Faendrich and N. Grigorieff, J. Mol. Biol., 2007, 371, 812–835 CrossRef CAS PubMed.
- J. L. Eads and R. P. Millane, Acta Crystallogr., Sect. A: Found. Crystallogr., 2001, 57, 507–517 CrossRef CAS PubMed.
- C. G. Schroer, R. Boye, J. M. Feldkamp, J. Patommel, A. Schropp, A. Schwab, S. Stephan, M. Burghammer, S. Schoder and C. Riekel, Phys. Rev. Lett., 2008, 101, 090801 CrossRef CAS.
Footnotes |
| † Electronic supplementary information (ESI) available. See DOI: 10.1039/c4sm00414k |
| ‡ Current address: Chair for Food Process Engineering and Dairy Technology, Technische Universität München, Weihenstephaner Berg 1, 85354 Freising-Weihenstephan, Germany. |
| This journal is © The Royal Society of Chemistry 2014 |

