 Open Access Article
 This Open Access Article is licensed under a
 Creative Commons Attribution 3.0 Unported Licence
Nanostructuring of the conjugated polyelectrolyte poly[9,9-bis(4-sulfonylbutoxyphenyl)fluorene-2,7-diyl-2,2′-bithiophene] in liquid crystalline C12E4 in bulk water and aligned thin films†
M.
Knaapila
*a,
S. M.
Fonseca
b,
B.
Stewart
b,
M.
Torkkeli
c,
J.
Perlich
d,
S.
Pradhan
e,
U.
Scherf
e,
R. A. E.
Castro
f and
H. D.
Burrows
*b
aPhysics Department, Institute for Energy Technology, NO-2027 Kjeller, Norway. E-mail: matti.knaapila@ife.no
bDepartamento de Quimica, Universidade de Coimbra, 3004-535 Coimbra, Portugal. E-mail: burrows@ci.uc.pt
cDepartment of Physics, FI-00014 University of Helsinki, Finland
dDeutsches Electronen-Synchrotron DESY Photon Science, D-22607 Hamburg, Germany
eMacromolecular Chemistry Group, Bergische Universität Wuppertal, D-42119 Wuppertal, Germany
fCEF, Faculty of Pharmacy, University of Coimbra, Coimbra, 3000-295, Portugal
First published on 29th January 2014
Abstract
We report on the conjugated polyelectrolyte 12 mM poly[9,9-bis(4-sulfonylbutoxyphenyl) fluorene-2,7-diyl-2,2′-bithiophene] (PBS-PF2T) mixed in concentrated aqueous 680 mM tetraethylene glycol monododecyl ether (C12E4) in bulk and thin films. A blue-shift in the fluorescence spectrum demonstrates breakup of PBS-PF2T aggregates in bulk aqueous C12E4. Small-angle X-ray scattering data indicate that this mixture follows a very similar phase behaviour to binary mixtures of a pure surfactant with water, including a micellar phase below about 20 °C, a lamellar phase in between about 20 and 70 °C and a proposed coexistence of water and the liquid surfactant solution above 70 °C. Molecular dynamics simulations reproduce these transitions and suggest that PBS-PF2T is incorporated into the surfactant headgroup region, and is, on average, perpendicular to the alkyl chains. In wet thin films, grazing-incidence small-angle X-ray scattering shows that the phase window for the lamellar phase becomes much narrower, located at about 30–34 °C. Weakly ordered phases exist both below and above these temperatures. These phases are isotropic, but lamellae become aligned in a stacked manner on the surface whether approached from low or high temperatures. Dry films are disordered but can be reversibly ordered and disordered and aligned and misaligned by maintaining the temperature at 30–34 °C and switching relative outside humidity between 32% and 100%.
Introduction
Water soluble π-conjugated polyelectrolytes (CPEs)1,2 were introduced in the 1980s3 and their water solubility stems usually from hydrophilic side chains such as non-charged oligoethyleneoxide4,5 or charged alkylammonium groups6,7 incorporated into side chains. CPEs have been developed for diverse applications including charge transport and blocking layers,8,9 chemosensors10,11 and biosensors.12,13 A good control of water–polymer interaction is also required for CPE deposition by layer-by-layer14,15 and Langmuir–Blodgett16,17 processes.CPEs are not easily dissolved down to the single molecule level, and they tend to aggregate without precipitating.18 Several strategies have been introduced to control this aggregation, and thereby their optical and electronic properties. McCullough et al.19,20 first showed that bulky counterions disrupt aggregates of charged polythiophene and, with increasing counterion size, there is a change from a red aggregate phase to a yellow solution. Lavigne et al.21 extended this strategy to the sugar substituted poly(p-phenylene ethynylene) and showed that the colour change could be induced with a wide variety of ionic and nonionic surfactants, denoting this phenomenon as surfactochromism. Whitten et al.22 demonstrated another significant phenomenon, a fluorescence enhancement when a negatively charged poly(p-phenylene vinylene) polymer forms a complex with a cationic surfactant in water. Burrows et al.23 expanded this strategy and demonstrated fluorescence enhancement with anionic polyfluorenes and a nonionic surfactant, pentaethylene glycol monododecyl ether (C12E5). These strategies are based partly on the fact that water quenches CPE fluorescence, while the surfactant restores it to the level observed in organic solvents by forming an isolating layer between the polymer and water. In addition, the reduced fluorescence quantum yields in water may also be associated with π–π interactions between aromatic groups on neighbouring chains in ill-defined CPE clusters.24
By using diverse scattering methods we have shown in detail how the surfactant–CPE phenomenon can be understood structurally for systems showing surfactochromism25 or fluorescence enhancement.26 All these studies concern dilute surfactant phases with micellar behaviour. However, at higher surfactant concentrations, binary surfactant–water systems can show a variety of lyotropic liquid crystalline (LC) phases.27 The potential application of LC π-conjugated polymers for enhanced charge transport in plastic electronic devices has already been demonstrated.28 Indications that anionic CPEs may be incorporated within mesophases formed in the binary nonionic alkyloxyethylene surfactant–water systems come from their effects on the surfactant cloud points.29 We have, therefore, looked at the possibility of nanostructuring these anionic CPEs to spontaneously form anisotropic lamellar phases using the C12E4–water system.
Nanostructuring with surfactants is likely to be important for incorporation of CPEs into solid matrices such as mesoporous silica. CPE–silica nanocomposites show considerable potential for sensing and other applications,30 and for this surfactant–water LC phases show excellent potential for templating formation of mesoporous silica structures.31
Poly[9,9-bis(4-sulfonylbutoxyphenyl)fluorene-2,7-diyl-2,2′-bithiophene] (or PBS-PF2T) shown in Fig. 1 was chosen as a typical CPE. Fluorene-bithiophene alternating copolymers, such as poly(9,9-dioctylfluorene-co-bithiophene), are widely used in molecular electronic devices as charge transport layers,32 while the charged sulfonate groups, incorporated into side chains, provide solubility in polar solvents. In water it forms a clear transparent solution, yet small-angle scattering measurements indicate ribbon-like aggregates in ∼0.05–0.5% solutions.33 The length of the polymer is about 6 nm, while the thickness of ribbons is 2.5 nm with their lateral dimension reaching above 30 nm.
 | ||
| Fig. 1 Chemical structure of the PBS-PF2T polymer where n > 4. | ||
Tetraethylene glycol monododecyl ether (C12E4) is a classic nonionic surfactant. Aqueous C12E4 has a complicated, but well-studied, phase diagram,34 which is very similar to that of C12E5 used in our earlier studies, except that the phase boundaries are shifted to lower temperatures. This makes them experimentally easier to study in small angle X-ray scattering (SAXS) measurements.
Interest has been focused not only on the dilute surfactant phases but also on their LC behaviour when the surfactant concentration is high. This is strongly dependent on both composition and temperature, and can lead to micellar, lamellar, cubic and hexagonal phases. For example, when the surfactant fraction is ∼25% (v), a micellar solution (marked as L1) is obtained below about 20 °C, while a lamellar phase (Lα) is observed between about 20 and 60 °C. A coexistence of very dilute (miscible) surfactant solution and liquid surfactant (not fully miscible) solution (W + L2) occurs above 70 °C. C12E4 has been studied in associations with a rich variety of materials including alkanes (e.g. dodecane),35 ionic surfactants, such as sodium dodecyl sulphate (SDS),36 silver nanoparticles,37 gold nanoparticles,38 peptides39 and clay particles.40 In these studies, the phase structure has frequently been determined by X-ray scattering but relevant small-angle neutron scattering (SANS)41 studies also exist. Scattering studies show, moreover, that C12E4 can be aligned by shearing when in a lamellar phase42,43 or when forming multilamellar vesicles (so called onions).44 However, less attention has been paid to the spontaneous in-plane alignment in thin films.
In this paper we consider the PBS-PF2T polymer mixed with an aqueous C12E4 surfactant. As in previous studies33 we consider a low polymer fraction (12 mM = 1% (v)) but increase the surfactant fraction up to the level where LC phases start to form (680 mM = 26% (v)). UV-vis absorption and fluorescence spectral measurements indicate the breakdown of ribbon-like polymer aggregates, and suggest that the CPE is present as isolated chains. The SAXS data indicate that the bulk phase behaviour of the PBS-PF2T–C12E4 mixture follows that of an aqueous pure surfactant, including the presence of a lamellar (Lα) phase between 20 and 70 °C. This is supported by the observation of Maltese cross textures when observed through cross polarizers on a polarizing microscope. Fluorescence measurements imply that the polymer is not influenced when the mixture is transferred into thin films. However, the phase window for the lamellar phase becomes much narrower, being located between 30 and 34 °C. Moreover, the lamellae spontaneously become aligned in the stacked manner on the film substrate if approached either from low or high temperatures. The same phenomenon takes place if the relative humidity is raised from 32% to 100%. These findings demonstrate how PBS-PF2T can be incorporated into a standard surfactant at high mole fraction in bulk and thin films such that the polymer experiences similar optical changes to those in the low surfactant fraction, while the surfactant follows its characteristic LC behaviour. Molecular dynamics simulations have been used to model this behaviour and obtain information on how PBS-PF2T locates and aligns within the nanostructures.
Experimental section
Sample preparations
The synthesis of the PBS-PF2T copolymer has been described elsewhere.33 As discussed in this reference, the molecular weight was at least 3500 Daltons corresponding to a degree of polymerisation >4. Whilst it was not possible to accurately determine the PDI (polydispersity index), gel permeation chromatography (GPC) measurements suggest a relatively polydisperse, low molecular weight polymer. The surfactant was purchased from Sigma-Aldrich. The samples were prepared by mixing weighed amounts of the components such that PBS-PF2T was mixed with aqueous C12E4. Since the LC C12E4 is very viscous at room temperature, it was cooled into the isotropic phase to facilitate mixing. In the so obtained ternary system, the PBS-PF2T concentration was about 12 mM (with respect to the monomer) and the C12E4 concentration 680 mM (with respect to the molecule).For SAXS measurements these mixtures were used as is. For grazing-incidence small-angle X-ray scattering (GISAXS) measurements thin films of wet dispersion were spread on microscope slides using a doctor blade method with K Paint Applicator supplied by RK Print (Litlington, UK). The nominal film thickness was ∼10 μm and the spreading rate ∼1 m min−1. The lateral sample size was 1 inch.2 These films were subsequently dried and their water content was later controlled using a humidity chamber (vide infra).
Optical measurements
Absorption and fluorescence spectra were recorded on Shimadzu UV-2100 and Jobin-Ivon SPEX Fluorolog 3-22 spectrometers. Fluorescence spectra were registered with excitation at 411 nm and were corrected for the wavelength response of the system. When not being used for measurements, all samples were kept in dark.Thermomicroscopy experiments were performed with a Leica DMRB polarising microscope connected to a Sony image processing equipment composed of a CCD-IRIS/RGB video camera, hard disk video recorder and video monitor. Hot stage video microscopy analysis was performed using a Linkam system DSC 600 equipped with a liquid nitrogen pump. For image analysis, a Linkam system software with a Real Time Video Measurement System was used. A small amount (2 μl) of the PBS-PF2T–C12E4 mixtures was placed in a 7 mm diameter glass crucible used as cell, which was covered with a glass lid. The samples were heated and cooled between 0 and 90 °C at a scanning rate of 10 °C min−1.
SAXS measurements
SAXS measurements of isotropic samples were performed at the I711 beamline at MAX-lab in Lund (Sweden).45 The X-ray energy was 11.3 keV, the sample-to-detector distance 1325 mm and the employed q-range 0.015–0.2 Å−1. The beam size (horizontal × vertical) was 0.2 mm × 0.2 mm. The samples were measured as a function of temperature in glass capillaries, which had an inner diameter of about 1.5 mm and wall thickness of 10 micrometers, placed in a thermostated metal block placed in a vacuum chamber. The data were collected using a 165 mm MAR CCD detector. The exposure time was 120 seconds for each scattering curve.The temperature was controlled in a stepwise manner with approximate steps of 10 K. For each step the temperature rise occurred over a few minutes; the sample was left to reach equilibrium for five minutes before measurement. Recalling the exposure time, this means an effective heating rate of about 1 K min−1. The sample temperature was calibrated using an external thermocouple. The measurement was repeated using several parallel samples.
GISAXS measurements
One part of the GISAXS measurements of film samples was performed on the BW4 beamline of the DORIS III storage ring at HASYLAB.46 The X-ray energy was 9 keV, the sample-to-detector distance 443 mm, and the employed q-range 0.07–0.7 Å−1. The beam size (horizontal × vertical) was 30 μm × 22 μm. The incident angle was 0.14°. The samples were measured as a function of temperature in a thermally controlled humidity chamber at normal pressure. The data were collected using a 165 mm MAR CCD detector. The exposure time was typically 10 seconds for each scattering curve.The temperature was controlled stepwisely with approximate steps of 1 K. For each step the temperature rise occurred over a minute, and the sample was left to reach equilibrium for five minutes before measurement. This means an effective heating rate of ∼0.1 K min−1. The humidity chamber allowed switching measurement conditions between a relative humidity of 40–60% and a relative humidity of 100%. This switching was conducted by starting from a dry sample at 32% relative humidity as the initial measurement, switching to 100% humidity, and letting the sample reach equilibrium for five minutes before next measurement. A similar waiting time was used when switching relative humidity back to the room humidity. The measurement was repeated using several parallel samples.
The second part of the GISAXS measurements was performed at W1 beamline at HASYLAB. The X-ray energy was 10.5 keV and the sample-to-detector distance was 30.5 cm, yielding a usable q-range of 0.1–2 Å−1. The beam size (horizontal × vertical) was 0.2 mm × 0.1 mm and the incident angle 0.13°. The scattering patterns were measured with an image plate (Molecular Dynamics).
The samples were measured as in a thermally controlled humidity chamber at normal pressure exactly as at BW4 but the relative humidity was kept at 100%. In order to suppress radiation damage and scattering from air, moist helium was led to the humidity chamber.
Computational section
Molecular dynamics simulations were performed using the GROMACS software package with the standard GROMOS96 53a6 force field.47–49Structures for PBS-PF2T and C12E4 were built and minimized using the AVOGADRO molecular builder;50 protein databank files of minimised structures were then submitted to the Automated Topology Builder32 to generate the necessary topology files for simulations using GROMACS.
Two equivalents of PBS-PF2T were added to a cubic box of 10 nm × 10 nm × 10 nm to which 680 mM C12E4 was added. The remainder of the cell was taken up by water by employing the SPC solvation model51 which considers a simple 3 point charge model for water where the intramolecular degrees of freedom are frozen and the intermolecular interactions are described by a combination of Lennard-Jones and Coulombic potentials between sites of fixed point-charges. The box was then constrained in accordance with the LINCS algorithm.52 Simulations were carried out over a time frame of 20 ns with a step size of 2 fs. All visualisations and images were generated using VMD software.
The used SPC model represents, with accuracy, the properties of a bulk water environment under standard conditions, 300 K and 1 atmosphere pressure, and was selected although these systems involve an investigation of an increase of temperature. It has also been employed in the study of similar CPEs in aqueous environments.24
Results and discussions
Optical measurements
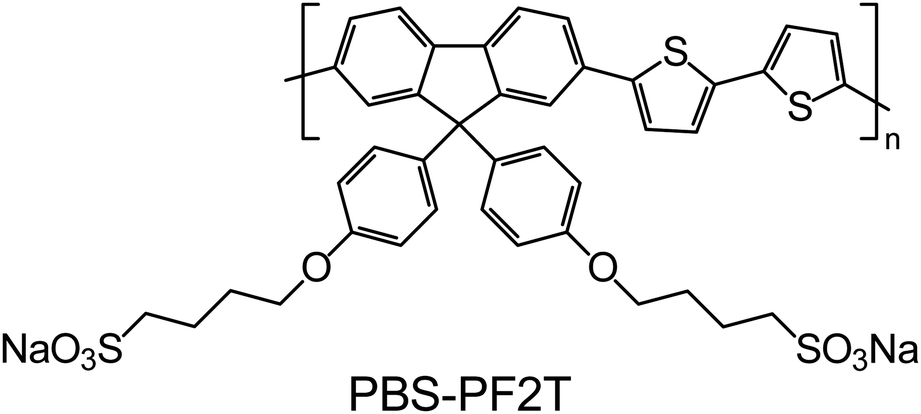
Fig. 2 plots the normalized fluorescence spectra of PBS-PF2T when mixed with aqueous C12E4 at selected temperatures in wet thin films. In this ternary system, the polymer and surfactant concentrations are 12 mM and 680 mM, respectively. The spectra of pure aqueous PBS-PF2T and its dilute 1 mM (0.04% (v)) C12E4 solution are shown for comparison. The spectra are normalised to show changes in the vibrational structure.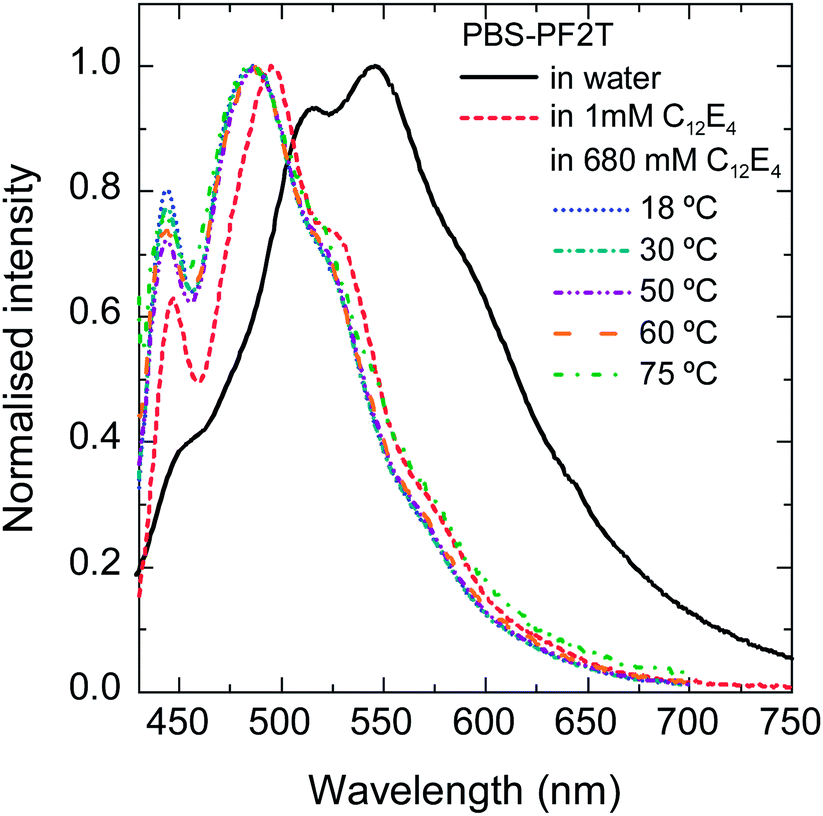 | ||
| Fig. 2 Normalised fluorescence spectra of aqueous PBS-PF2T and PBS-PF2T mixed with C12E4 at selected temperatures in thin wet films. The concentrations were 12 mM for PBS-PF2T and 1 mM or 680 mM for C12E4. | ||
The surfactant concentration 680 mM is within the LC range meaning that the system is so dense that long range order emerges. The surfactant concentration 1 mM is far below this range but still above the critical micelle concentration (CMC) 0.069 mM of binary aqueous C12E4.53
A small amount of surfactant (1 mM) leads to significant blue shift. The spectra are similar or slightly more shifted when the surfactant concentration is orders of magnitude higher (680 mM). No significant temperature dependence can be seen in the vibrational structure of the spectra. This implies that the polymer is predominantly molecularly dissolved not only in the micellar C12E5 solution but also in the LC C12E4. Due to intense light scattering, it was not possible to obtain good resolution absorption spectra.
Additional fluorescence spectra of PBS-PF2T mixed with aqueous C12E4 in thin wet films at selected temperatures are shown in the ESI†. In order to maintain constant humidity, the film was covered by a glass slide. The fluorescence intensity decreases with increasing temperature but no spectral shifts are observed.
Samples of PBS-PF2T mixed with aqueous C12E4 were also studied by video microscopy on the hot stage of a microscope. Upon heating, the phase transition from the micellar to the lamellar phase could be observed at about 22 °C and the transition to the coexistence of water and liquid surfactant solution was observed at 78 °C (Fig. S1 in the ESI†). These results are in agreement with the data obtained from the SAXS experiments (vide infra).
SAXS measurements
Fig. 3 shows the SAXS curves of the PBS-PF2T polymer (12 mM) mixed with aqueous C12E4 (680 mM) upon a heating–cooling cycle. With temperatures in the range of 10–20 °C, the curve shows a broad maximum between 0.09 and 0.1 Å−1. When the temperature is increased to 30 °C, a very sharp Bragg reflection appears between 0.05 and 0.06 Å−1 with a well-defined second order maximum between 0.1 and 0.12 Å−1. This is a clear signature of a lamellar structure. When the temperature is increased further to 79 °C, the Bragg reflection is replaced by a broad maximum at 0.045 Å−1. Essentially similar steps, with a hint of hysteresis, are observed during cooling. These observations point to the LC order with completely reversible apparent phase transitions. The transition behaviour is clearly seen in Fig. 4, which shows the nominal long periods estimated from the observed maxima. Dotted lines mark the positions of apparent phase transitions. The long period at about 10–11 nm observed for the lamellar phase between 20 and 60 °C corresponds to the surfactant bilayer, with the surfactant length being approximately 5 nm. The material is stable, and an identical result is observed if the measurement is repeated 24 h after the first cycle. | ||
| Fig. 3 SAXS patterns of the PBS-PF2T polymer (12 mM) mixed with the aqueous C12E4 surfactant (680 mM) during a heating–cooling cycle. The arrow shows the direction of the cycle. | ||
 | ||
| Fig. 4 Nominal long period of the PBS-PF2T polymer (12 mM) mixed with the aqueous C12E4 surfactant (680 mM) during a heating–cooling cycle estimated from the data shown in Fig. 3. The arrow shows the direction of the cycle. Dotted lines mark the points of apparent phase transitions. | ||
The data shown in Fig. 3 resemble closely those of the 680 mM aqueous (pure) C12E4 surfactant.34 At temperatures below about 20 °C an aqueous micellar C12E4 solution (marked as L1) occurs before changing into the lamellar phase (Lα) in between about 20 and 60 °C. At temperatures above 70 °C the Lα phase transforms into a very dilute solution of coexisting (miscible) surfactant and liquid surfactant (not fully miscible). This coexistence is marked as W + L2. A narrow regime of isotropic surfactant solution (L3) may exist between 60 and 70 °C.
These observations indicate that the polymer does not significantly influence the phase behaviour of the surfactant, which is consistent with the idea of a homogeneously distributed polymer within the layers. The position of the first lamellar peak in PBS-PF2T–C12E4 may be slightly higher (∼0.052–0.058 Å−1) than that reported for 23% (wt) aqueous C12E4 (∼0.051 Å−1).41 This may be understood considering that, for the given mass fraction, incorporating a polymer slightly increases the total fraction of surfactant. Thus, the long period is slightly smaller than the period of the pure lamellar surfactant phase in water. A similar behaviour has been reported elsewhere for clay–C12E4 systems.40
Perhaps more important is the fact that the position of the first lamellar peak is sensitive to the concentration, as shown elsewhere for C12E5,37 the peak moves towards higher q with increasing surfactant fraction. In our study, this shift appears significant, as shown in the room temperature examples in Fig. 6. In the first case, the PBS-PF2T polymer with 1360 mM (=50% (v)) aqueous C12E4 shows the first order lamellar peak at ∼0.11 Å−1. In the second case, the sample with nominally 680 mM C12E4 shows the first order peak at ∼0.14 Å−1. These peaks correspond to the lamellar long periods of ∼57 Å and ∼45 Å, respectively, and approximately match the length of the surfactant of ∼40–50 Å.
In previous studies, the long period of the lamellar C12E4 structure is reported to be influenced by three factors: water incorporated within the layer, other molecules or particles incorporated within the layer and the alignment process. This does not necessarily mean that the periodicity is modified, but rather that the contrast is changed, such that, for example, one only sees half a period surfactant layer instead of a bilayer.
We propose that the incorporation of the PBS-PF2T polymer into the lamellar surfactant structure does not noticeably change the observed periodicity. However, we see the half period for some data. Since large polymer ribbons are likely to influence a lamellar period, the constant period is consistent with the proposed breakdown of ribbon-like polymer aggregates as suggested by the fluorescence studies. This is completely consistent with the observation of Andersson et al.37 who synthesised silver nanoparticles from silver nitrate in aqueous C12E4. Based on the SAXS measurements they concluded that the particle formation does not noticeably affect the size or shape of microemulsion droplets.
 | ||
| Fig. 5 Examples of SAXS patterns of the PBS-PF2T polymer (12 mM) mixed with the aqueous C12E4 surfactant at room temperature. The surfactant concentration is 1360 mM (solid line) and 680 mM (dotted line). | ||
GISAXS measurements
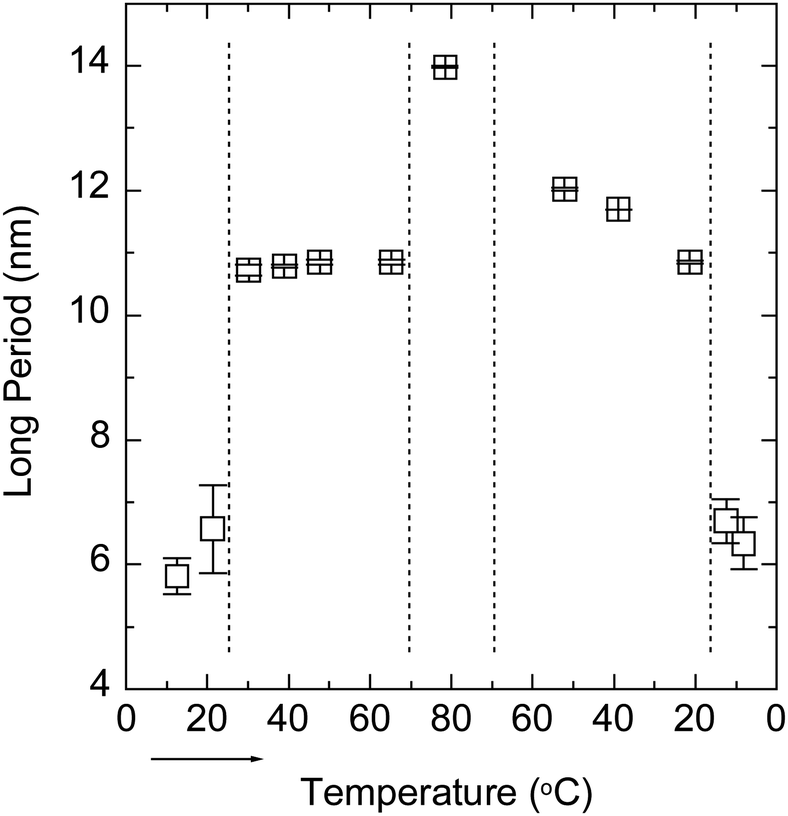
Fig. 6 shows the GISAXS curves out-of-plane and in-plane for the pure PBS-PF2T polymer and the PBS-PF2T polymer mixed with C12E4 at 35 °C in 10 μm thick films. The latter sample corresponds roughly to the one studied by SAXS above. Neither the polymer nor the dry PBS-PF2T–C12E4 film reveals any nanometer scaled periodicity when the relative atmospheric humidity is 32%. However, when the relative atmospheric humidity is raised up to 100%, the latter material becomes highly organized, and the GISAXS curve follows the above-described SAXS curve with two diffraction orders with twofold spacing, indicating lamellar order. However, this situation differs from the above described SAXS data, because the order is much higher out-of-plane than in-plane. This implies nanostructuring through alignment of the lamellar structure in a stacked manner on the film substrate in-plane.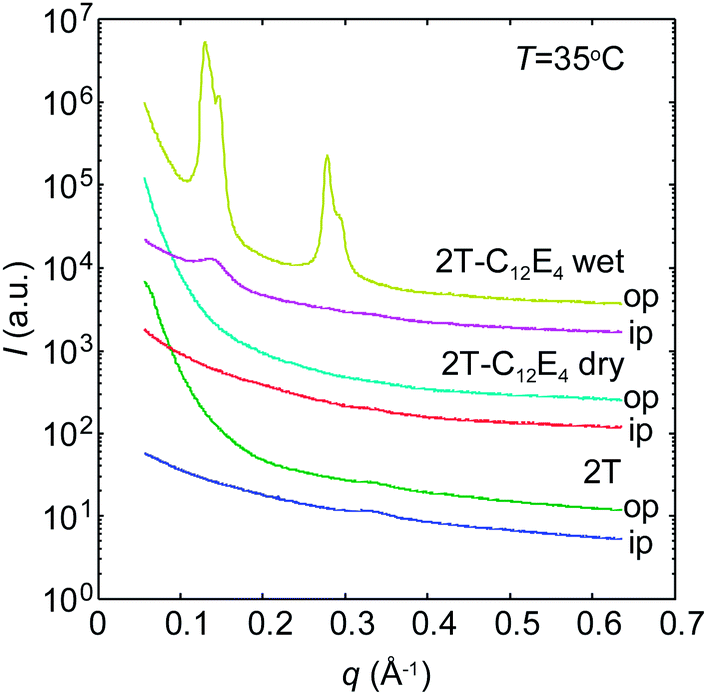 | ||
| Fig. 6 GISAXS patterns of the PBS-PF2T polymer and PBS-PF2T (12 mM) mixed with the aqueous C12E4 surfactant (680 mM) when the relative humidity is 32% (denoted as dry) and 100% (denoted as wet). The curves are 10° integrals in out-of-plane (op) and in-plane (ip) directions. The curves are shifted for clarity. T ∼ 35 °C. | ||
The first peak at 0.13–0.16 Å−1 corresponds to the peak shown in Fig. 5 rather than those shown in Fig. 3. Alternatively, it might be the second order maximum of the first order peak being shadowed by the beamstop. We note that the scattering pattern shows diffraction by both the incident and reflected beams, which leads to a shoulder off the first order peak.
Fig. 7 shows the PBS-PF2T polymer mixed with C12E4 in 10 μm thick films with heating (a and b) and cooling (c and d) around the 33 °C temperature transition, both out-of-plane (a and c) and in-plane (b and d). The data show a strong peak at ∼0.11 Å−1 resembling the bulk data shown in Fig. 5. However, the mixture shows stronger peaks out-of-plane than in-plane indicating layer alignment in a stacked manner (illustrated in the inset).
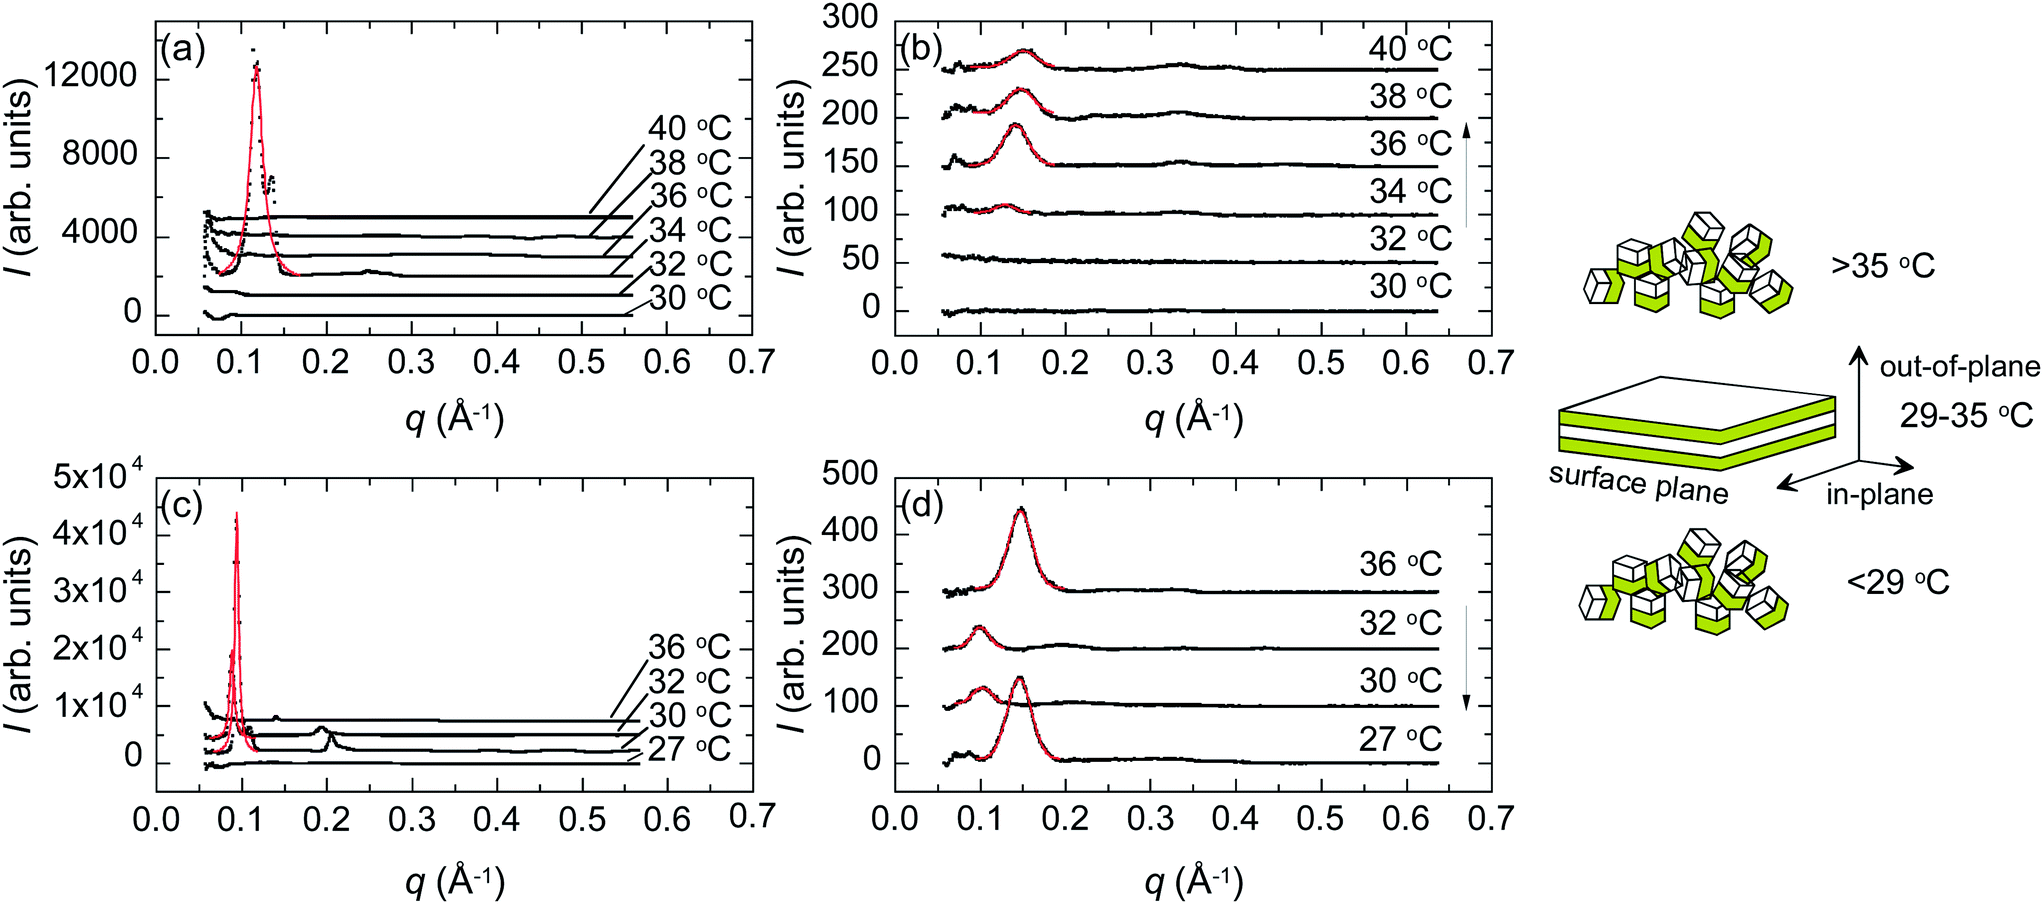 | ||
| Fig. 7 GISAXS data of the PBS-PF2T polymer (12 mM) mixed with the aqueous C12E4 surfactant (680 mM) during a heating (a and b)–cooling (c and d) cycle (black solid dots). These data are integrals from the 2D data out-of-plane (a and c) and in-plane (b and d). Also shown are best fits to the primary peaks (red solid curves). The relative atmospheric humidity was 100%. The arrow shows the direction of the cycle. The inset shows the interpreted material structure for three temperature regimes and defines the out-of-plane and in-plane directions. | ||
Interestingly, the ordered lamellar phase appears at a much narrower temperature interval than in the bulk, with the conspicuous out-of-plane peak appearing at 34 °C with heating and between 32 °C and 30 °C upon cooling. This limit is very sharp but varies from sample to sample. Additional 2D data showing an isotropic disordered structure at 28 °C are shown in the ESI.† The first order peak is seen at ∼0.14 Å−1 rather than at ∼0.11 Å−1.
Fig. 8 shows essential parameters deduced from the fits to the first order scattering peaks shown in Fig. 7. As expected, based on the peak intensities, the structure is rather different between 29 and 35 °C compared to the situation either below 29 °C or above 35 °C. The observed periodicity is higher and the structure much better ordered. The coherence length in the middle regime is about ∼100 nm as compared to ∼20 nm observed outside the regime. The degree or orientation is high. From the integrated intensities we estimate that the percentage of lamellae oriented parallel to the substrate is 99%.
 | ||
| Fig. 8 Analysis of the fits shown in Fig. 7 on heating (brown solid symbols) and subsequent cooling (blue open symbols) out-of-plane (up triangles) and in-plane (right triangles). (a) Peak position. (b) Lamellar period. (c) Peak width. (d) Integrated intensity. The range for the orientated lamellae is between vertical dashed lines. | ||
Computational studies
Further information on the interaction between PBS-PF2T and C12E4 was obtained by molecular dynamics simulations. A simulation cell of specifications described in Table 1 was used to demonstrate the effect of temperature on a solution of C12E4 which contained two equivalents of PBS-PF2T. Simulations were performed at temperatures 10 °C, 20 °C, 45 °C, 70 °C and 90 °C.| 1 | 2 | 3 | 4 | 5 | |
|---|---|---|---|---|---|
| PBS-PF2T | 2 | 2 | 2 | 2 | 2 |
| Water | 24033 | 24033 | 24033 | 24033 | 24033 |
| Na+ | 12 | 12 | 12 | 12 | 12 |
| C12E4 | 374 | 374 | 374 | 374 | 374 |
| Temperature | 10 °C | 20 °C | 45 °C | 60 °C | 90 °C |
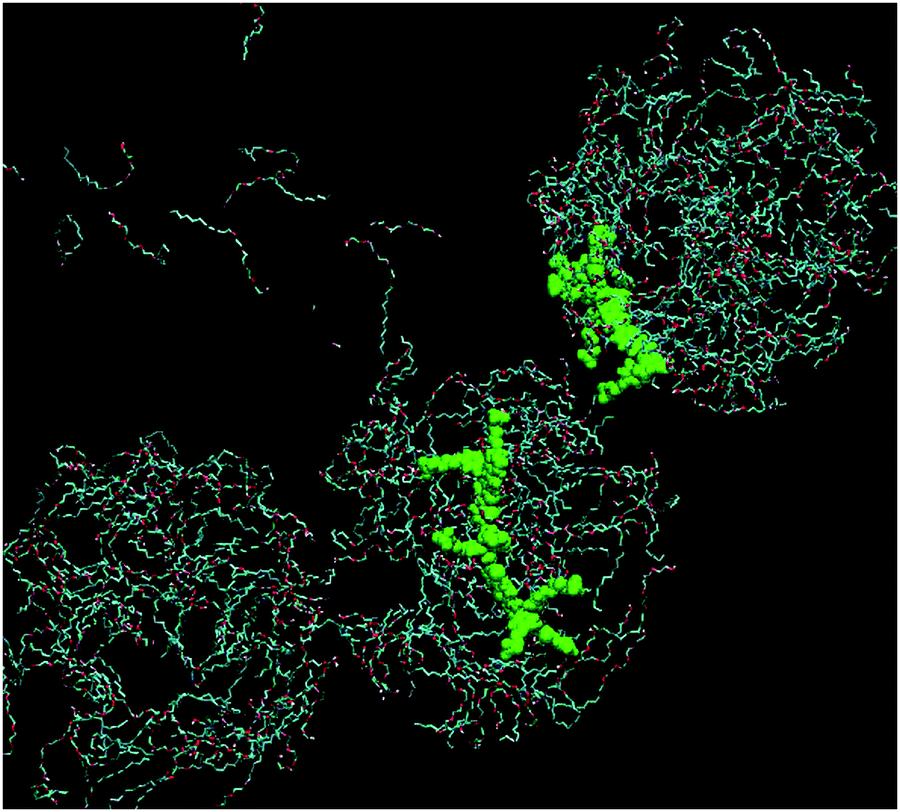
Fig. 9 shows the simulation cell after a run of 20 ns at 10 °C, and gives clear indications of micelle formation. At higher temperatures this transforms into a lamellar phase, which persists from 20 °C to 70 °C. Fig. 10 shows the lamellar phase formed at 45 °C.
 | ||
| Fig. 9 Simulation cell at 20 ns of 680 mM C12E4 with two equivalents of PBS-PF2T at 10 °C (PBS-PF2T shown in green and water molecules omitted for clarity). | ||
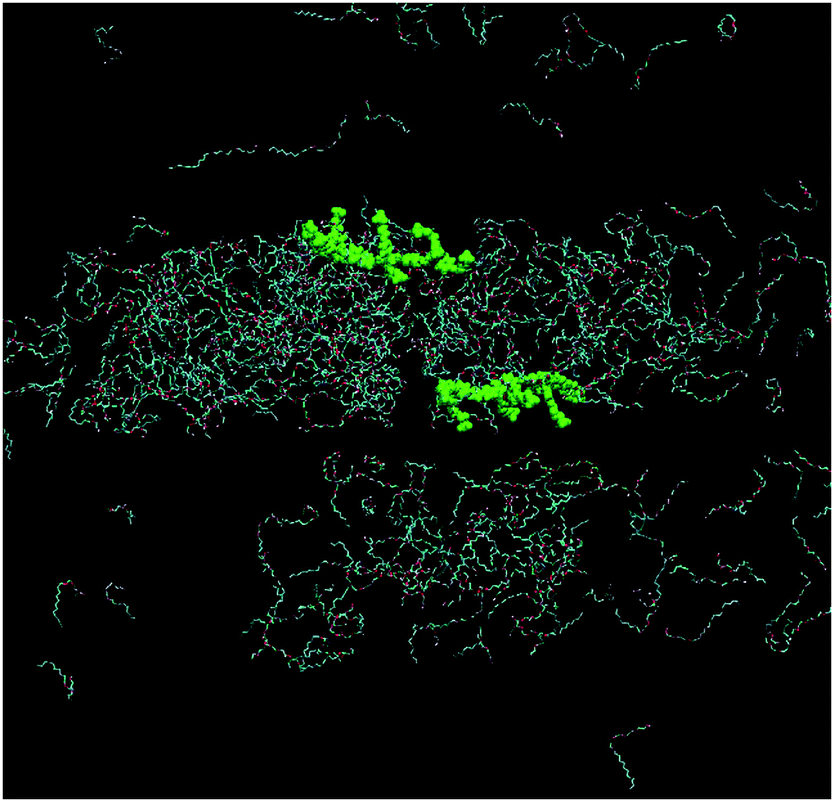 | ||
| Fig. 10 Simulation cell at 20 ns of 680 mM C12E4 with two equivalents of PBS-PF2T at 45 °C (PBS-PF2T shown in green and water molecules omitted for clarity). | ||
From Fig. 9 and 10 it can be observed that the two equivalent oligomers of PBS-PF2T do not form aggregates with each other (as shown in Fig. S4, ESI†) but instead form polymer–surfactant assemblies. In addition, the polymer is largely incorporated into the oxyethylene headgroup region and is orthogonal to the direction of the surfactant molecule.
In each case the charged side chains of the polymers maintain closest contact with the surrounding solvent (Table S1 and Fig. S7–S11, ESI†), whereas the polymer backbone remains closely associated with the surfactant.
The distances between the sidechains and solvent and also between the backbone and surfactant show a decrease.
Simulations are in agreement with both the fluorescence measurements presented herein where the blue shifted emission maximum implies inhibited aggregation of PBS-PF2T, and also with the SAXS measurements and visual observations, where at temperatures below 20 °C micelle formation is observed which leads to a lamellar phase upon heating to 70 °C. Although the lamellar phase still exists at both 70 °C and 90 °C, at these temperatures one of the two equivalents of PBS-PF2T present in the simulation is no longer associated with the polymer–surfactant aggregate and instead dissociates into the solvent environment suggesting a possible solubility of PBS-PF2T at high temperatures, (Fig. S5 and S6, ESI†). This is consistent with the phase separation observed at high temperatures.
Conclusions
This study indicates that PBS-PF2T aggregates are broken up in aqueous 680 mM C12E4, with PBS-PF2T dissolved at the molecular level. The mixture follows the LC phase behaviour of the surfactant–water mixtures, including a lamellar phase between 20 °C and 70 °C. This is in agreement with the polymers being homogeneously distributed within the surfactant assemblies. The process is fully reversible on heating and cooling and allows interconversion between isotropic and lamellar aligned structures. Molecular dynamics simulations suggest that PBS-PF2T is incorporated within the oxyethylene head group layer, and is orthogonal to the direction of the surfactant molecules. When the bulk mixture is transferred into thin films the polymer remains dissolved and the mixture still follows a similar phase behaviour but the ordered lamellar phase regime becomes much narrower being between 30 °C and 34 °C. The lamellae become aligned in-plane if approached either from low or high temperatures. The lamellar phase takes place only in wet films with the material remaining weakly ordered in dry films. If the temperature is kept constant between 30 °C and 34 °C, the weakly ordered and lamellar phases can be reversibly switched by switching relative outside humidity between 32% and 100%.Acknowledgements
The GISAXS experiments were supported by the European Community's Seventh Framework Programme (FP7/2007-2013) under grant agreement no. 226716. We thank W. Caliebe of HASYLAB for experimental assistance. S. M. F. and B. S. thank the Fundação para a Ciência e a Tecnologia (FCT), Portuguese agency for scientific research, for the postdoctoral grants SFRH/BPD/34703/2007 and SFRH/BPD/82396/2011. The Coimbra group thanks the FCT for financial support (PEst-C/QUI/UI0313/2011). We are also indebted to A. A. C. C. Pais and J. A. S. Almeida for valuable assistance and discussions on the simulations.Notes and references
- L. Bin and G. C. Bazan, Conjugated Polyeletrolytes – Fundamentals and Applications, Wiley-VCH, 2013 Search PubMed.
- H. Jiang, P. Taranekar, J. R. Reynolds and K. S. Schanze, Angew. Chem., Int. Ed., 2009, 48, 4300–4316 CrossRef CAS PubMed.
- A. O. Patil, Y. Ikenoue, F. Wudl and A. J. Heeger, J. Am. Chem. Soc., 1987, 109, 1858–1859 CrossRef CAS.
- G. D. Joly, L. Geiger, S. E. Kooi and T. M. Swager, Macromolecules, 2006, 39, 7175–7177 CrossRef CAS.
- B. L. Nguyen, J.-E. Jeong, I. H. Jung, B. Kim, V. S. Le, I. Kim, K. Khym and H. Y. Woo, Adv. Funct. Mater. DOI:10.1002/adfm.201301515.
- T. Wågberg, B. Liu, G. Orädd, B. Eliasson and L. Edman, Eur. Polym. J., 2009, 45, 3228–3233 CrossRef PubMed.
- H. Wang, P. Lu, B. Wang, S. Qiu, M. Liu, M. Hanif, G. Cheng, S. Liu and Y. Ma, Macromol. Rapid Commun., 2007, 28, 1645–1650 CrossRef CAS.
- C. Hoven, R. Yang, A. Garcia, A. J. Heeger, T.-Q. Nguyen and G. C. Bazan, J. Am. Chem. Soc., 2007, 129, 10976–10977 CrossRef CAS PubMed.
- J. H. Seo, A. Gutacker, Y. Sun, H. Wu, F. Huang, Y. Cao, U. Scherf, A. J. Heeger and G. C. Bazan, J. Am. Chem. Soc., 2011, 133, 8416–8419 CrossRef CAS PubMed.
- D. T. McQuade, A. E. Pullen and T. M. Swager, Chem. Rev., 2000, 100, 2537–2574 CrossRef CAS PubMed.
- S. W. Thomas III, G. D. Joly and T. M. Swager, Chem. Rev., 2007, 107, 1339–1386 CrossRef PubMed.
- M. Surin, P. G. A. Janssen, R. Lazzaroni, P. Leclere, E. W. Meijer and A. P. H. J. Schenning, Adv. Mater., 2009, 21, 1126–1130 CrossRef CAS.
- J. H. Wosnick, C. M. Mello and T. M. Swager, J. Am. Chem. Soc., 2005, 127, 3400–3405 CrossRef CAS PubMed.
- J. Lukkari, M. Salomäki, A. Viinikanoja, T. Ääritalo, J. Paukkunen, N. Kocharova and J. Kankare, J. Am. Chem. Soc., 2001, 123, 6083–6091 CrossRef CAS PubMed.
- J. L. Lutkenhaus and P. T. Hammond, Soft Matter, 2007, 3, 804–816 RSC.
- A. Bolognesi, G. Bajo, Z. Geng, W. Porzio and F. Speroni, Thin Solid Films, 1994, 243, 683–686 CrossRef CAS.
- N. Reitzel, D. R. Greve, K. Kjaer, P. B. Howes, M. Jayaraman, S. Savoy, R. D. McCullough, J. T. McDevitt and T. Bjørnholm, J. Am. Chem. Soc., 2000, 122, 5788–5800 CrossRef CAS.
- H. D. Burrows, M. Knaapila, S. M. Fonseca and T. Costa, in Conjugated Polyelectrolytes – Fundamentals and Applications, ed. L. Bin and G. C. Bazan, Wiley-VCH, Weinham, 2013, pp. 127–168 Search PubMed.
- R. D. McCullough and P. C. Ewbank, Synth. Met., 1997, 84, 311–312 CrossRef CAS.
- R. D. McCullough, P. C. Ewbank and R. S. Loewe, J. Am. Chem. Soc., 1997, 119, 633–634 CrossRef CAS.
- J. J. Lavigne, D. L. Broughton, J. N. Wilson, B. Erdogan and U. H. F. Bunz, Macromolecules, 2003, 36, 7409–7412 CrossRef CAS.
- L.-H. Chen, S. Xu, D. McBranch and D. Whitten, J. Am. Chem. Soc., 2000, 122, 9302–9303 CrossRef CAS.
- H. D. Burrows, V. M. M. Lobo, J. Pina, M. L. Ramos, J. S. de Melo, A. J. M. Valente, M. J. Tapia, S. Pradhan and U. Scherf, Macromolecules, 2004, 37, 7425–7427 CrossRef CAS.
- H. D. Burrows, S. M. Fonseca, C. L. Silva, A. A. C. C. Pais, M. J. Tapia, S. Pradhan and U. Scherf, Phys. Chem. Chem. Phys., 2008, 10, 4420–4428 RSC.
- M. Knaapila, R. C. Evans, A. Gutacker, V. M. Garamus, N. K. Székely, U. Scherf and H. D. Burrows, Soft Matter, 2011, 7, 6863–6872 RSC.
- M. Knaapila, L. Almásy, V. M. Garamus, C. Pearson, S. Pradhan, M. C. Petty, U. Scherf, H. D. Burrows and A. P. Monkman, J. Phys. Chem. B, 2006, 110, 10248–10257 CrossRef CAS PubMed.
- K. Holmberg, B. Jönsson, B. Kronberg and B. Lindman, Surfactants and Polymers in Aqueous Solutions, Wiley, Chichester, 2003 Search PubMed.
- B.-G. Kim, E. J. Jeong, J. W. Chung, S. Seo, B. Koo and J. Kim, Nat. Mater., 2013, 12, 659–664 CrossRef CAS PubMed.
- S. M. Fonseca, M. E. Eusebio, R. Castro, H. D. Burrows, M. J. Tapia and U. Olsson, J. Colloid Interface Sci., 2007, 315, 805–809 CrossRef CAS PubMed.
- R. C. Evans, A. G. Macedo, S. Pradhan, U. Scherf, L. D. Carlos and H. D. Burrows, Adv. Mater., 2010, 22, 3032–3037 CrossRef CAS PubMed.
- G. S. Attard, J. C. Glyde and C. G. Goltner, Nature, 1995, 378, 366–368 CrossRef CAS.
- Y. Deng and H. Sirringhaus, Phys. Rev. B: Condens. Matter Mater. Phys., 2005, 72, 045207 CrossRef.
- H. D. Burrows, M. J. Tapia, S. M. Fonseca, A. J. M. Valente, V. M. M. Lobo, L. L. G. Justino, S. Qiu, S. Pradhan, U. Scherf, N. Chattopadhyay, M. Knaapila and V. M. Garamus, ACS Appl. Mater. Interfaces, 2009, 1, 864–874 CAS.
- D. J. Mitchell, G. J. T. Tiddy, L. Waring, T. Bostock and M. P. McDonald, J. Chem. Soc., Faraday Trans. 1, 1983, 79, 975–1000 RSC.
- A. Merdas, M. Gindre, R. Ober, C. Nicot, W. Urbach and M. Waks, J. Phys. Chem., 1996, 100, 15180–15186 CrossRef CAS.
- N. Tsapis, R. Ober and T. Urbach, Langmuir, 2000, 16, 2968–2974 CrossRef CAS.
- M. Andersson, J. S. Pedersen and A. E. C. Palmqvist, Langmuir, 2005, 21, 11387–11396 CrossRef CAS PubMed.
- Z. Sun, X. Chen, L. Wang, G. Zhang and B. Jing, Colloids Surf., A, 2008, 326, 23–28 CrossRef CAS PubMed.
- N. Tsapis, R. Ober, A. Chaffotte, D. E. Warschawski, J. Everett, J. Kauffman, P. Kahn, M. Waks and W. Urbach, Langmuir, 2002, 18, 4384–4392 CrossRef CAS.
- I. Grillo, P. Levitz and T. Zemb, Eur. Phys. J. E, 2001, 5, 377–386 CrossRef CAS.
- F. Nettesheim, J. Zipfel, P. Lindner and W. Richtering, Colloids Surf., A, 2001, 183–185, 563–574 CrossRef CAS.
- S. Müller, C. Börschig, W. Gronski, C. Schmidt and D. Roux, Langmuir, 1999, 15, 7558–7564 CrossRef.
- R. Weigel, J. Lauger, W. Richtering and P. Lindner, J. Phys. II, 1996, 6, 529–542 CrossRef CAS.
- Y. Suganuma, M. Imai, T. Kato, U. Olsson and T. Takahashi, Langmuir, 2010, 26, 7988–7995 CrossRef CAS PubMed.
- M. Knaapila, C. Svensson, J. Barauskas, M. Zackrisson, S. S. Nielsen, K. N. Toft, B. Vestergaard, L. Arleth, U. Olsson, J. S. Pedersen and Y. Cerenius, J. Synchrotron Radiat., 2009, 16, 498–504 CrossRef CAS PubMed.
- J. Perlich, J. Rubeck, S. Botta, R. Gehrke, S. V. Roth, M. A. Ruderer, S. M. Prams, M. Rawolle, Q. Zhong, V. Körstgens and P. Müller-Buschbaum, Rev. Sci. Instrum., 2010, 81, 105105 CrossRef CAS PubMed.
- H. J. C. Berendsen, D. van der Spoel and R. van Drunen, Comput. Phys. Commun., 1995, 91, 43–56 CrossRef CAS.
- E. Lindahl, B. Hess and D. van der Spoel, J. Mol. Model., 2001, 7, 306–317 CAS.
- C. Oostenbrink, A. Villa, A. E. Mark and W. F. van Gunsteren, J. Comput. Chem., 2004, 25, 1656–1676 CrossRef CAS PubMed.
- M. D. Hanwell, D. E. Curtis, D. C. Lonie, T. Vandermeersch, E. Zurek and G. R. Hutchison, J. Cheminf., 2012, 4, 17 CAS.
- H. J. C. Berendsen, J. P. M. Postma, W. F. Van Gunsteren and J. Hermans, in Intermolecular Forces, ed. B. Bullman, Dordrecht, Reidel, 1981, pp. 331–342 Search PubMed.
- B. Hess, H. Bekker, H. J. C. Berendsen and J. G. E. M. Fraaije, J. Comput. Chem., 1997, 18, 1463–1472 CrossRef CAS.
- G. Fragneto, J. R. Lu, D. C. McDermott, R. K. Thomas, A. R. Rennie, P. D. Gallagher and S. K. Satija, Langmuir, 1996, 12, 477–486 CrossRef CAS.
Footnote |
| † Electronic supplementary information (ESI) available: Thermomicroscopy images of PBS-PF2T mixed with aqueous 680 mM C12E4 as well as additional absorption, scattering and computational studies. See DOI: 10.1039/c4sm00092g |
| This journal is © The Royal Society of Chemistry 2014 |