 Open Access Article
Creative Commons Attribution 3.0 Unported Licence
Microstructural, mechanical and mass transport properties of isotropic and capillary alginate gels
Erich
Schuster
ab,
Johanna
Eckardt
bc,
Anne-Marie
Hermansson
abd,
Anette
Larsson
bc,
Niklas
Lorén
ab,
Annika
Altskär
ab and
Anna
Ström
*bc
aDepartment of Structure and Material Design, The Swedish Institute for Food and Biotechnology, SIK, Göteborg, Sweden
bSuMo BIOMATERIALS, VINN Excellence Center, Chalmers University of Technology, Göteborg, Sweden. E-mail: anna.strom@chalmers.se
cPharmaceutical Technology, Department of Chemical and Biological Engineering, Chalmers University of Technology, Göteborg, Sweden
dDepartment of Applied Surface Chemistry, Chalmers University of Technology, Göteborg, Sweden
First published on 1st November 2013
Abstract
Macroscopically homogeneous and inhomogeneous calcium alginate gels are formed via internal or external addition of various amounts of calcium to an alginate solution. The externally formed gels contain parallel aligned capillary structures. The mechanical and mass transport properties and the microstructure of the differently set gels were characterized by rheological measurements, fluorescence recovery after photobleaching (FRAP) and transmission electron microscopy (TEM). TEM images show a zone of distorted anisotropic gel structure in the vicinity of the capillaries as well as indications of a lower degree of void connectivity. The diffusion rates of dextran at large distances from the capillaries were fast and capillary gels showed a plastic behaviour in comparison to the internally set gels. The results presented show large functional differences between the internally and externally set gels, which cannot be explained by the presence of capillaries alone.
Introduction
Alginate is used as a thickener and gelling agent in diverse fields such as food,1 pharmaceutics2–4 and waste water treatment.5 Besides its use as a thickener and stabilizer in food products, alginate gel is also particularly suitable for biomedical applications2,6 – such as tissue engineering7,8 and as a material for cell immobilisation and cell signalling9–11 – due to its high biocompatibility, low cost and a mild gelation process. Alginate has a strong affinity for di- and trivalent cations, and forms rapidly a gel in the presence of low concentrations of such ions (Mg2+ being an exception) at a range of pH values and temperatures. Alginate is mostly derived from brown algae but is also produced by bacteria. It is a charged and linear copolymer consisting of (1–4) linked β-D-mannuronic acid (M) and α-L-guluronic acid (G), whose ratio varies with the alginate source. The physical properties of the alginate depend on the M/G ratio as well as the distribution of the M and G units along the alginate chain. The ability of alginate to form networks in the presence of di-valent cations, where calcium has been specifically studied, is attributed to chelation of calcium between G units from different alginate chains via the so-called egg-box model.12The egg box model involves a two-step network formation mechanism where the first step is a dimerization process12 followed by dimer–dimer aggregation of G units and Ca2+, where the degree of aggregation is partly determined by total calcium concentration.13 It follows that the total amount of G units, and its distribution along the chain, is an important aspect for the ion induced gelation ability of alginate, where the high amount of G units and GG blocks are favourable.2 Further, it is believed that G-blocks of 6–10 residues are necessary in order to form stable crosslinked junctions with divalent counterions. Large deformation studies of calcium alginate gels have shown that fracture occurs when enough stress is applied to disrupt the junction zones. Generally, an increasing amount of calcium at a fixed alginate concentration leads to an increased modulus14,15 while the fracture strain is independent of both alginate and calcium concentration.15 Dependent on gel composition, large deformation of calcium alginate gels has shown strain hardening properties.16
Determination of the thickness of the network strands and the network structure has been done using small angle X-ray scattering (SAXS)13 and transmission electron microscopy (TEM).17 In general, increasing the amount of calcium leads to an increased modulus and strand thickness. However, SAXS and rheological studies of calcium alginate networks showed further that gels with a similar storage modulus for a given polymer concentration can be obtained using different alginates and calcium concentration combinations and that the strand thickness, or the local structure of alginate gels, varies considerably despite the similar gel modulus.13 Determination of strand thickness and the overall network structure of a given alginate concentration at increasing calcium concentrations did not reveal apparent network differences using TEM.17 Similar observations have been made for calcium pectin, where the network structures visualised using TEM were similarly independent of the calcium concentration despite a clear influence of calcium on the rheological properties of the final gel.18 This implies that the concentration of calcium influences molecular interactions within the network strands rather than the overall morphology of the network.19
The kinetics of calcium alginate chelation is fast, thus a slow introduction of calcium ions is typically required in order to reduce the risk of precipitation of calcium alginate particles upon addition of calcium or large inhomogeneities within the alginate gel. One common way to introduce calcium ions into the alginate solution is to disperse an insoluble calcium source in the alginate solution, followed by the addition of a slowly hydrolysed acid.13 As the acid gets deprotonated over time the calcium salt is solubilised forming a relatively homogeneous network.20 Such calcium alginate gels are known to be of isotropic character and the gelation methodology is typically referred to as the internal method.1,21 Alginate gelation has also been studied where the alginate solution is e.g. inserted in a dialysis membrane, allowing for diffusion of small molecules into the membrane but not of polymers out of the membrane. Ion-induced gelation performed in such a way revealed an increased concentration of both polymer and crosslinking ions towards the gel surface and a less concentrated polymer and ion concentration towards the center of the gel.22
A third gelation methodology involves the anchoring of alginate to the container surface and the creation of a top gelled alginate layer, over which an ion solution composed of ions enabling crosslinks is added. The ions in this way diffuse into the alginate solution, across the gelled membrane, creating highly inhomogeneous and anisotropic alginate gels. Gels formed via this external mechanism were found to form capillaries, from the top of the gel to the bottom. Thiele and co-workers,23 who first reported the tendency of alginate to form anisotropic and highly inhomogeneous structures with open capillaries, were intrigued by its resemblance to structures of the biological origin.7 The interest for these structures has been enduring due to its potential application in the area of tissue engineering.7,24,25
However, the mechanism of capillary formation is still not fully understood. The most developed approach in modelling the behaviour is by Kohler and co-workers,26,27 where a Rayleigh–Benard like instability is used to explain the existence and propagation of the capillaries as gel formation progresses. A recent magnetic resonance (MR) microscopy study provided further insights on the dynamics of gel formation and front propagation in the alginate capillary systems.28 MR allowed us to confirm that the gel front has a definite structure22 and that the reaction front position zF (t) can be described by a diffusion driven term plus a pseudo-advective velocity component: zF (t) ≈ (Dt)1/2 + vt.29,30 The ‘pseudoadvective’ component arises from stress relaxation due to polymer swelling in models of solvent diffusion into polymer. Further, Maneval et al.28 show that microscale flow processes near a gel front, where capillaries form, are complex and vary with time, and do not seem to support the details of a proposed front propagation and capillary formation model based on dissipative flow structures and Rayleigh–Benard instabilities. Rather, an alternative theoretical approach based on spinodal decomposition in the presence of anisotropic stress distribution in gels is suggested as a possible mechanism governing the capillary formation.31,32
While several studies have been conducted on the theory of the capillary formation and the effect of various crosslinking ions on the capillary formation (diameter and density), as well as the viability of live cells within the capillary alginate gels, no studies have actually investigated the microstructure of such gels and its potential impact on the functionality of the gel: e.g. diffusivity of certain compounds and mechanical strength – compared to the functionality of internally set (isotropic) calcium alginate gels.
For internally set gels both diffusion and mechanical properties have been studied to some extent. The diffusivity of proteins in isotropic alginate gels depends on the guluronic acid content, which is explained in terms of the difference in flexibility of the polymer backbone.33 Further techniques utilized in order to study solute diffusion in isotropic alginate gels are NMR diffusometry,17 and fluorescence correlation spectroscopy.34 Another complementary method for local diffusion measurements is fluorescence recovery after photobleaching (FRAP). In FRAP, the fluorescent molecules are first irreversibly bleached in a limited volume with a short high intensity pulse of light, which results in a local decrease of the fluorescence intensity. After bleaching, unbleached fluorescent molecules from the surroundings gradually diffuse into the bleached region while bleached fluorescent molecules diffuse out. The fluorescence intensity in the bleached region will recover at a rate that depends on the mobility of the molecules. With an appropriate mathematical model one can then extract quantitative information on the molecular dynamics by analyzing the fluorescence recovery. FRAP has established itself in the last decade as a powerful method of measuring the diffusion of fluorescently tagged microspheres, dendrimers, proteins, polysaccharides in soft matter systems,35–37 and is reviewed elsewhere.38
The aim of the study was to compare the functionality of alginate gels of same composition, but formed via the internal gelation method (leading to isotropic structure) or external addition of calcium. Gels formed via the external methodology form macroscopic pores or capillaries, hence these gels are addressed in due course as capillary gels. The mechanical strength of the gels was compared via stress relaxation and large deformation rupture measurements. The mass transport properties were evaluated via probe diffusion measurements on different molecular weight FITC-dextrans. Further, transmission electron microscopy (TEM) and image analysis were utilized to characterize the microstructure at the nanometre level. The measured mechanical and mass transport properties were related to the microstructure of the gels.
Experimental
Materials
The alginate, Protanal RF6650, was kindly provided by FMC Biopolymers, UK. The alginate contains 70% guluronate according to the supplier. CaCO3 with an average particle size of 10 μm![[thin space (1/6-em)]](https://www.rsc.org/images/entities/char_2009.gif) 39was obtained from Provencale SA, France. Glucono-δ-lactone (GDL) was obtained from Sigma – Aldrich, as was NaCl, CaCl2, HCl and NaOH. The fluorescent probes used were FITC-dextran with molecular weights (MWs) of 10 kDa, 70 kDa and 500 kDa (Invitrogen Molecular Probes, U.S.A.). Ruthenium Red was obtained from Sigma-Aldrich Nordic. The secure-seal spacers used were 120 μm thick and 9 mm in diameter (Invitrogen, U.S.A.).
39was obtained from Provencale SA, France. Glucono-δ-lactone (GDL) was obtained from Sigma – Aldrich, as was NaCl, CaCl2, HCl and NaOH. The fluorescent probes used were FITC-dextran with molecular weights (MWs) of 10 kDa, 70 kDa and 500 kDa (Invitrogen Molecular Probes, U.S.A.). Ruthenium Red was obtained from Sigma-Aldrich Nordic. The secure-seal spacers used were 120 μm thick and 9 mm in diameter (Invitrogen, U.S.A.).
Methods
Alginate solutions (2% w/w) were prepared by careful addition of alginate powder to deionised water at room temperature under vigorous stirring. The dispersion was thereafter heated to 353 K in a water bath and kept at this temperature for 30 minutes or until dissolution was obtained. The pH of the polymeric solution was adjusted from pH 7.3 to pH 7 using 0.1 M HCl. | (1) |
Externally set alginate gels were prepared by coating the internal wall of a glass beaker (V = 50 ml and d = 40 mm) with alginate by brushing the internal wall with alginate solution, which then was allowed to dry in an oven set at 383 K for 30 minutes. The proceeding was repeated three times. A volume of 20 ml alginate solution (1.8% w/w) at 293 K was poured into the glass beaker. The surface of the polymeric solution was sprayed with 0.5 M CaCl2 solution until a gel membrane was formed on top of the alginate solution. The gel membrane was left to set for 30 minutes after which CaCl2 solution at 293 K was carefully poured on top of the membrane. The CaCl2 solution was left to diffuse through the membrane and into the alginate solution for 48 h prior to the use of the gel. The R-value of the gels varied between 1 and 8. The R-value was varied by the addition of different volumes of CaCl2 solutions at a concentration of 0.5 M.
| σ = FH/A0H0 | (2) |
| γ = ln(H/H0) | (3) |
The free diffusion coefficients D0 of the probes in the absence of alginate were determined at 298 K. The probes were dissolved in CaCl2/CaCO3 + GDL solutions corresponding to the respective R-values. 7 μl of the probe solutions were placed into secure-seal spacer grids between two cover glass slides, and the FRAP measurements were carried out on such locked samples. Hydrodynamic radii (rH) – gained using Stokes–Einstein relation – of the used FITC-dextran probes range between rH ≈ 3.5 nm for 10 kDa, rH ≈ 8.5 nm for 70 kDa and rH ≈ 14 nm for 500 kDa MW.
To conduct FRAP measurements in the internally set gels corresponding amounts of FITC-dextran were introduced in the alginate solution before the addition of calcium to yield a probe concentration of 100 ppm in the gelled system. For the externally set gels the FITC-dextrans were introduced in two ways: (a) as described above by mixing it into the polymer solution; (b) FITC-dextrans were dispersed into the CaCl2 solution above the membrane and diffused into the alginate sol together with the cross-linking ions. The probe concentration was chosen to be in the linear regime of the fluorescence dependence on the concentration.41
As described above, the capillary gels were set during 2 days. The membrane above the formed capillary gel got removed, and a ca. 2 cm × 2 cm × 2 cm sized sample got cut out – centrally and directly under the membrane – to perform the FRAP measurement. The surface of the cube, cut perpendicular to the direction of capillary growth, got absorbed on a cover glass slide; then loaded on the microscope stage and FRAP measurements were carried out in the upright mode of the microscope at constant 298 K. At least 6 FRAP measurements have been performed on different spatial coordinates per sample. The ROIs' spatial locations have been chosen, such that in the whole field of view (≈200 μm × 200 μm) no capillary was present. This means that the diffusion in the bulk phase between the capillaries got tested. To test the reproducibility every sample has been remade at least once. All of the recorded recoveries were quick enough to yield Gaussian intensity distributions in the initial recovery images within the bleached area/ROI. Therefore the FRAP model called “most likelihood estimation for FRAP data with a Gaussian starting profile”41 is valid for evaluation of the data. A script provided by Jonasson et al.41 was utilized to analyze the data within this framework in Matlab, Mathworks, U.S.A.
![[thin space (1/6-em)]](https://www.rsc.org/images/entities/char_2009.gif) 000×.
000×.
Results and discussion
Macrostructure of calcium induced capillary gels
Several studies have been performed on the effect of the type of (heavy divalent) ions, ion concentration and M/G ratio of the alginate used on the diameter size of the capillary as well as on the capillary density.23,43 In general, an alginate with high G content gives rise to smaller capillaries and a higher capillary density compared to an alginate high in M units.7 Furthermore, while the capillary diameter and density will vary with the type of (heavy metal) ion added, increasing the concentration of ions leads to reduced capillary diameter and a higher capillary density.23 Fewer studies have been performed on capillary formation in alginate gels using calcium. However, the results obtained in this study show relatively well defined capillaries which are homogeneously distributed over the crosssection of the gel surface, as displayed in Fig. 1(a). Image analysis of such gels results in an initially reducing capillary diameter with increasing total amount of Ca2+, and thus increasing R-value, after which the capillary diameter appears to be less dependent on R. However, the capillary density increases consistently with the R value, at least for the values studied here (Fig. 1(b)). The R-value of the final gel is varied by adding different volumes of a fixed electrolyte solution (0.5 M CaCl2). The capillary diameter obtained varies between 60 and 110 μm depending on the final R-value. The capillary diameter of 60 to 70 μm that are obtained for the higher R-values of 4–8 is in relative agreement with the findings of Despang and co-workers of a capillary diameter of 43 μm using a high G alginate and 1 M CaCl2 as an electrolyte.7 It is worthwhile to note that no capillaries were formed below a R-value of 2, thus indicating that the capillary formation takes place only once excess Ca2+ is available – above crosslinking saturation of the alginate (R = 1).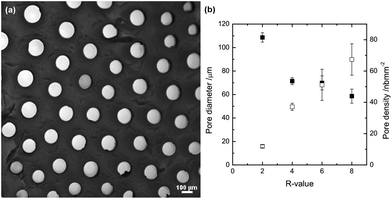 | ||
| Fig. 1 (a) Cross-section of a capillary gel dyed with ruthenium red at R = 2. (b) Pore diameter (solid symbols) and density (open symbols) as a function of the R-value; formed at 293 K. | ||
Rheological differences between isotropic and capillary gels
Stress relaxation tests have been performed on capillary and internally set calcium alginate gels of R = 2 and at room temperature. A fixed strain of 5, 10 and 20% was applied and the stress required to maintain the strain at the specific value was recorded over time, as depicted in Fig. 2. Both types of the gel show viscoelastic behaviour as the stress required to maintain a strain of 5, 10 and 20% respectively varies initially, while levelling out to a close to constant nonzero value14 at times >200 seconds. It is observed that less pressure is required in order to maintain the capillary gel at a given strain compared to the internally set gels. The modulus G of the material (G(t) = stress(t)/strain) indicates that the linear region for the modulus as a function of strain ends somewhere between 10 and 20% strain. This is in agreement with literature data reporting linearity up to at least 17% strain for internally set calcium alginate gels.14 Comparing the moduli, depicted in Fig. 2(c), of 38 ± 4 kPa obtained at 5 and 10% strain for the internally set gel of R = 2 shows reasonable agreement with previously reported values for high guluronate alginate in excess of calcium.14 The results show further that the moduli for the capillary gels of 6.2 ± 0.7 kPa at 5 and 10% strain are considerably lower compared to the internally set gels despite similar composition (calcium and alginate concentration) of the two types of gels. It should further be stated that additional stress relaxation tests at different strains should be done in order to specify the linear region for the capillary gels. Observing the tendency for the gels to recover their initial height, after the external load has been withdrawn, is displayed in Table 1. These data indicate a higher degree of plasticity for the capillary gels.| Compression/% | ||||||
|---|---|---|---|---|---|---|
| 5 | 10 | 20 | ||||
| Time | Random | Capillary | Random | Capillary | Random | Capillary |
| Immediately after removal of force | 100 | 91 | 96 | 92 | 91 | 84 |
| 2 Minutes after removal of force | 100 | 91 | 98 | 92 | 98 | 84 |
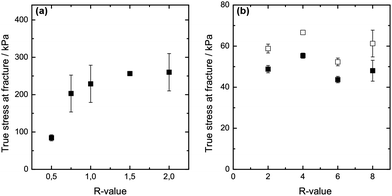
Rupture strength is additionally used to characterise the mechanical properties of the two differently set gels at varying R-values. Fig. 3(a) depicts the results obtained for the internally set gels. The isotropic calcium alginate gels show an increase in rupture strength as the R-value is increased to R = 1, above which the rupture strength levels out as R is increased to R = 2. It has been suggested that increasing calcium concentration for a fixed alginate concentration initially increases the length of the junction zones (up to R = 1), leading to an increase in rupture strength.14,15 Above the stoichiometric value of R = 1, no further junctions are formed, which could explain the apparent levelling out of rupture strength as R goes from 1 to 2 for the internally set gels. A similar explanation could be given for the capillary gels where no increase in rupture strength is observed as R is increased from 2 to 8.
The results show that the rupture strength of the internally set gel of R ≥ 2 is considerably higher compared to the rupture strength of the capillary gels (see Fig. 3(b)) at equal R and alginate concentration. It is further noticeable that accounting for only the actual gel area (thus subtracting the area of the capillary pores from the total area of the crosssection) only increases the rupture strength to a small extent. The capillary gel still has a low rupture strength compared to the internally set alginate gel. The rupture strength data follow the results from the stress relaxation test that the mechanical properties of the differently set gels vary considerably despite same composition. The large difference observed between the internally set gel and the capillary gel suggests that the gelation process as such introduces differences also within the microstructure of the gel, i.e. it is not only the macroscopic difference (presence of capillaries) that influences the mechanical properties of the two differently set gels. However, this needs to be confirmed further.
Probe-diffusion in isotropic and capillary gels
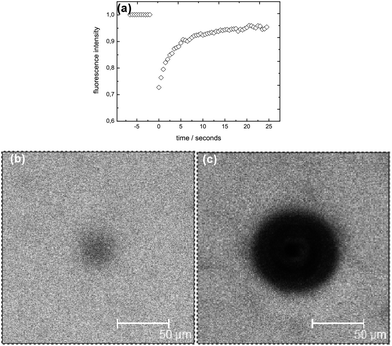
To study the diffusivity of different molecular weight FITC-dextrans in the bulk phase of internally and externally set alginate gels we performed a series of FRAP measurements. All studied networks have, as described above, the same effective polymer concentration (yielded by the subtraction of the pore areas) of 2% w/w. Fig. 4 displays a typical FRAP recovery, showing the time evolution of the fluorescent intensity. A microscopy image during a typical FRAP measurement on an externally set gel is shown in Fig. 4(b), and visualizes a homogeneous fluorescent distribution over the whole field of view of around 200 × 200 μm; that means that the capillaries are well separated from the spatial region of the measurement, and with probes sized >5 nm (and a self diffusion coefficient <70 μm2 s−1), will not influence the recovery curves recorded during the experiments in the time period of 25 s. In comparison, Fig. 4(c) illustrates how a typical capillary would be visualized during a FRAP measurement.Effect of available calcium
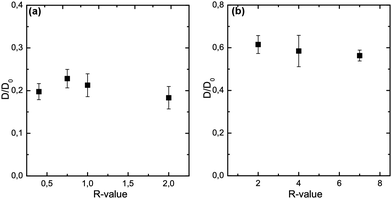
As seen above, varying the R-value results in gels of different strength and elasticity at values up to R = 1, and constant mechanical properties at R-values above 1. However, it appears that not only the R-value itself determines the rheology, but also the method of gelation – internal or external ion addition – influences the functionality strongly. Here, we investigate the influence of the R-value on the probe diffusion of 70 kDa FITC-dextran, a probe sized ≈17 nm (recalculated diameter from the hydrodynamic radius). Fig. 5 displays R-value sweeps and the corresponding normalized diffusion coefficients, for the calcium ranges in which gelation was possible. In internally set gels the diffusivity of the probes is reduced by 80% compared to the free diffusion coefficients D0 of the probes in the absence of alginate. Variations in the R-value between 0.4 and 2 did not cause significant changes in the probe diffusion. The bundle size of the network strands is known to be increasing for increasing R-values up to R = 1, when enough junction zone forming Ca2+ is available to incorporate all G units into aggregates via the egg-box mechanism.13 Our results indicate that although the network bundle size is increasing, the pore sizes being tested by FITC-dextran diffusion are not influenced by the strand thickness. However, the effect of polymer concentration seems to be the dominating factor for the diffusion. Similarly are the findings depicted in Fig. 5(b) for the externally set gels. No significant differences regarding the diffusivity of 70 kDa FITC-dextran could be found over the whole R-value range. We find a reduction of the diffusivity by 40% for 70 kDa FITC-dextran in externally set gels. Interestingly, testing the microstructure of alginate gels of the same effective polymer concentration with ≈17 nm sized probes a highly significant difference between the two gel setting methods is found. The externally set gels exhibit a diffusivity more than twice as big as for the internal set gels. These results suggest a different network microstructure and/or connectivity for the two respective gel setting methods.Effect of probe size
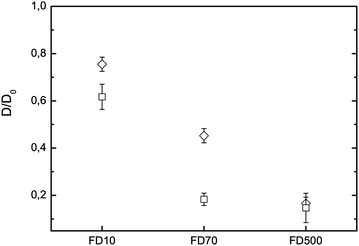
To elucidate the difference in diffusivity for the two types of gelation in more detail, we studied the diffusion of FITC-dextran of increasing molecular weight in externally and internally set gels at R = 2, a R-value at which both gelation methods coexist. This approach allows testing the obstruction properties and connectivity of the alginate networks, when penetrated by slightly smaller and larger probes than 70 kDa FITC-dextran. Fig. 6 shows the results of FRAP measurements on a molecular weight series in both types of alginate gels. For both gels same general trends are observed: increasing the molecular weight decreases the diffusivity, as probes of higher hydrodynamic radius do feel a stronger hindrance of their molecular motion. We find for 10 kDa FITC-dextran a reduction of the diffusivity by 25% and 35% for the external and internal methods, respectively. This means that 7 nm sized probes are not freely diffusing any more and are partly hindered by the network strands. This statement is true for both gelation methods, yet the internally set gel has a slightly higher sieving effect. For the largest probe, 500 kDa FITC-dextran, a strong retardation of the diffusivity of >80% is observed for both gel types. Also, the FRAP recovery was found not to reach the initial fluorescent intensity; and a corresponding immobile fraction of 50% is observed. This means that only 50% of the probes are mobile and contribute to the recovery, whereas the other probes are physically locked in and do not move in the time scale of the measurement (for 10 and 70 kDa FITC-dextran no immobile fraction is observed). For 500 kDa dextrans we do observe the same retardation and immobile fraction irrespective of the gelation method. This indicates that the probes are clogging up many pores of the network and the probe size of ≈28 nm is the dominating factor in 2% w/w alginate gels, irrespective of the gel setting method. The diffusivity for 70 kDa FITC-dextran yields the biggest difference for the two gelation methods. Utilizing this probe reduces the diffusivity by 80% for the internal gelation method, compared to reduction of only 55% via the external method. Thus, the differences in porosity and connectivity of the network structures are the strongest as examined by tracers sized ≈17 nm.Effect of probe introduction
Also, comparing the results for 70 kDa FITC-dextran in the externally set gel, depicted in Fig. 5 and 6, a deviation is found. This arises from the fact that for the set of experiments in Fig. 5 the fluorescent probes were added via the external method, together with the Ca2+-ions. In contrast, the measurements in Fig. 6 show the case in which probes were mixed in the alginate solution. Comparing the diffusivity of 70 kDa FITC-dextran in externally set gels at R = 2 a 15% stronger reduction is found compared to the case when the probes are added in the alginate solution. Dextrans mixed into the polymeric solution are homogeneously distributed throughout the sol, thus suggesting, as the gelation sets in and forms heterogeneous network structures, that probes will be equally likely located in tighter network structures as well as in more porous regions. Adding the probes via a diffusive mechanism during the gelation yields an overall faster diffusion in the set gels and indicates that the probes were not able to penetrate the whole network structure equally, and thereby weighted the diffusion in the open network structures excessively. However, both methods of probe introduction resulted in a significant difference in the diffusivity between the externally and internally set gels. The addition of the probes in the alginate solution should be preferred in future studies to gain well distributed tracers throughout all hierarchies of network structures.Microstructures of the bulk vs. capillary wall
Interesting information about differences and similarities between polysaccharide gels can be obtained via transmission electron microscopy (TEM).19,44 TEM micrographs of the bulk network structures of alginate gels at R = 2 are shown in Fig. 7. Similarly to the FRAP section, care is taken to image the gel phase in between the capillaries and not in their vicinity. For both gelation methodologies, we observe gel networks consisting of polymer strands (dark threads) and voids (light grey space), the latter being in the range of 50 nm and above. These structures are similar in character to other physical gels such as pectins and carrageenans.18,19 The micrographs for the externally and internally set gels have a heterogeneous network with a wide range of pore sizes, with largest pores in the range of 200 nm as well as dense network clusters. However, the gel network in the vicinity to the capillary walls is strongly affected by capillary formation and it could be hypothesised that such structures are formed due to a hydrodynamic flow field as suggested in the model by Treml and Kohler.45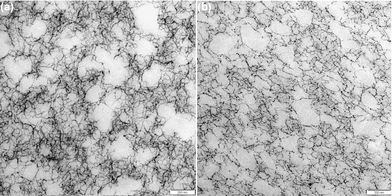 | ||
| Fig. 7 TEM micrographs of alginate gels at R = 2; (a) micrograph of the bulk network in an externally set gel and (b) internally set gel. | ||
Fig. 9 displays the microstructure in proximity to the capillary zones of an externally set gel at different magnifications. Here, some interesting features can be observed. The boundary area between the capillaries and the network is not sharp, thus there is no distinct interfacial layer. The interface between the network and the capillary consists of porous structures, and micron sized aggregates of dangling network chains reach into the capillary region. Further, the network in proximity of the capillary exhibits an anisotropic structure and chains seem to be elongated in the tangential direction of the macro-pore. This structure is distorted with a lower connectivity than the interior of the network as observed in Fig. 7. It reaches 5–10 micrometers into the structure and takes up considerable volume. This part of the structure will most likely contribute to the rheological properties of the gels and could be one of the reasons for the higher plasticity of the capillary gels.
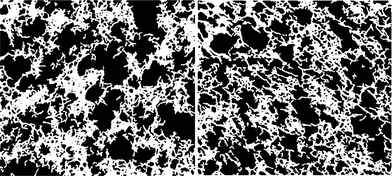 | ||
| Fig. 8 Binarized images of the TEM micrographs displayed in Fig. 7. (Left) externally set and (right) internally set. The images were cropped to not contain the scale bars during the image analysis. | ||
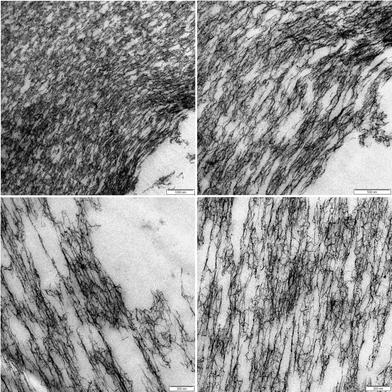 | ||
| Fig. 9 TEM micrograph of an externally set alginate gel at R = 2 in proximity to the capillary zones at different magnifications. | ||
Image analysis was performed to determine the pore sizes of the alginate gels on binarized TEM micrographs. Following the routine described in the materials and methods section, examples of such gained binary images are illustrated in Fig. 8. Analysing the volume weight mean volume of the pores in the bulk network structures of externally and internally set gels, we find pore volume values corresponding to spheres of diameter d for the externally set gel: dexternal = 59.5 ± 8.5 nm, and respectively dinternal = 56.8 ± 3.9 nm for internally set gel. Thus, the pore volumes gained via the image analysis of roughly 60 nm thin sections do not significantly differ for the two gelation methods. However, as pointed out the overall network morphology of many physical gels are similar even if the gelation mechanism and properties may differ.18,19 Here other features contribute to the properties such as the order and strength of the gel strands, interactions between strands as well as the connectivity and heterogeneity of the network.
The results presented show that the way alginate gels are prepared (via internal or external addition of calcium) do not only give rise to the intriguing differences in macroscopic appearance of the gels, by introducing open capillaries, but also changes the gel network structure between the capillaries. These changes give rise to a network structure that oppose less hindrance to FITC – dextrans of sizes 10 and 70 kDa compared to internally set gel. It is worthwhile to note that the differences introduced via the route of calcium addition is larger than what could be obtained by variation of the available amount of calcium below and above the stoichiometric amount, thus varying the number and length of junction zones as well as their degree of aggregation. The plasticity and lower moduli of the externally set alginate gels further suggest the presence of a network where the external force is suboptimally distributed and breakage or irreversible aggregation of the network occurs at lower strain. The distorted and anisotropic zone in the vicinity of the capillaries will certainly contribute to the rheological behaviour of the capillary gels but further studies will focus on other differences in the fine structures of the gel networks.
Conclusions
Starting with identical compounds – quantity of alginate and calcium – we are able to tune the elasticity/plasticity and the rupture strength of formed gels in one order of magnitude between 10s and 100s of Pa. Additionally we can tailor the mass transport of nanometre sized diffusants by the choice of the gelation methodology. The diffusivity for dextrans sized smaller than 20 nm, determined in the gel phase where the influence of capillaries is negligible, is higher in alginate gels formed via the external gel method compared to the internal methodology. Both gel types do hinder larger diffusants. The results indicate that the gelation methodology will not only influence the macroscopic structure, via the formation of parallel aligned capillaries as is the case of externally set alginate gels, but also the microstructure. The TEM images showed a 5–10 micrometer wide zone close to the capillary wall that had an anisotropic and distorted structure with a lower connectivity. This weaker structure can contribute to the higher plasticity and lower moduli of the capillary gels. The mean pore sizes found on the inner parts of the gels did not depend on external or internal addition of crosslinking ions. To explain the difference of diffusivity further studies of the fine structure and the connectivity of the gels in three dimensions will be needed.Acknowledgements
The authors thank Krassimir Velikov for encouragement and helpful discussions. We thank Linda Persson and Jonathan Jonson for supply with capillary gels and help with the rheological measurements. We are grateful for the financial support from SuMo Biomaterials and Vinnmer grant to A.S.References
- K. Draget, in Handbook of hydrocolloids, ed. G. O. Phillips and P. A. Williams, Woodhead Publishing Ltd, 2nd edn, 2009, pp. 807–828.
- M. Rinaudo, Polym. Int., 2008, 57, 397–430 CrossRef CAS.
- S. Thomas, J. Wound Care, 2000, 9, 56–60 CAS.
- H. L. Lai, A. Abu'Khalil and D. Q. Craig, Int. J. Pharm., 2003, 251, 175–181 CrossRef CAS.
- M. Figueira, B. Volesky, V. Ciminelli and F. A. Roddick, Water Res., 2000, 34, 196–204 CrossRef CAS.
- F. Lim and A. M. Sun, Science, 1980, 210, 908–910 CAS.
- F. Despang, A. Borner, R. Dittrich, G. Tomandl, W. Pompe and M. Gelinsky, Materialwiss. Werkstofftech., 2005, 36, 761–767 CrossRef CAS.
- G. Miralles, R. Baudoin, D. Dumas, D. Baptiste, P. Hubert, J. Stoltz, E. Dellacherie, D. Mainard, P. Netter and E. Payan, J. Biomed. Mater. Res., 2001, 57, 268–278 CrossRef CAS.
- K. Y. Lee and D. J. Mooney, Prog. Polym. Sci., 2012, 37, 106–126 CrossRef CAS PubMed.
- T. Andersen, J. E. Melvik, O. Gåserød, E. Alsberg and B. E. Christensen, Biomacromolecules, 2012, 13, 3703–3710 CrossRef CAS PubMed.
- Y. Cheng, X. Luo, G. F. Payne and G. W. Rubloff, J. Mater. Chem., 2012, 22, 7659–7666 RSC.
- E. R. Morris, D. A. Rees, D. Thom and J. Boyd, Carbohydr. Res., 1978, 66, 145–154 CrossRef CAS.
- B. T. Stokke, K. I. Draget, O. Smidsrød, Y. Yuguchi, H. Urakawa and K. Kajiwara, Macromolecules, 2000, 33, 1853–1863 CrossRef CAS.
- J. Mitchell and J. Blanshard, Journal Of Texture Study, 1976, 7, 219–234 CrossRef CAS.
- J. Zhang, C. R. Daubert and E. A. Foegeding, J. Food Sci., 2005, 70, e425–e431 CrossRef CAS.
- J. Zhang, C. R. Dauber and E. A. Foegeding, J. Food Eng., 2007, 80, 157–165 CrossRef CAS PubMed.
- D. Bernin, G. J. Goudappel, M. van Ruijven, A. Altskar, A. Strom, M. Rudemo, A. M. Hermansson and M. Nyden, Soft Matter, 2011, 7, 5711–5716 RSC.
- C. Löfgren, S. Guillotin and A.-M. Hermansson, Biomacromolecules, 2006, 7, 114–121 CrossRef PubMed.
- A. M. Hermansson, in Food materials science: principles and practice, ed. J. Aguilera and P. Lillford, Springer Verlag, 2008, Structuring water by gelation, ch. 13, pp. 255–280 Search PubMed.
- A. Strom and M. A. K. Williams, J. Phys. Chem. B, 2003, 107, 10995–10999 CrossRef.
- K. I. Draget, G. Skjåk-Bræk and O. Smidsrød, Int. J. Biol. Macromol., 1997, 21, 47–55 CrossRef CAS.
- A. Mikkelsen and A. Elgsaeter, Biopolymers, 1995, 36, 17–41 CrossRef CAS.
- H. Thiele and K. Hallich, Colloid Polym. Sci., 1957, 151, 1–12 CrossRef CAS.
- R. Dittrich, G. Tomandl, F. Despang, A. Bernhardt, T. Hanke, W. Pompe and M. Gelinsky, J. Am. Ceram. Soc., 2007, 90, 1703–1708 CrossRef CAS.
- F. Despang; R. Dittrich and M. Gelinsky, in Advances in Biomimetics, ed. A. George, InTech, Rijeka, 2011, Novel biomaterials with parallel aligned pore channels by directed ionotropic gelation of alginate: mimicking the anisotropic structure of bone tissue, ch. 17, pp. 349–72 Search PubMed.
- J. Thumbs and H.-H. Kohler, Chem. Phys., 1996, 208, 9–24 CrossRef CAS.
- H. Treml, S. Woelki and H.-H. Kohler, Chem. Phys., 2003, 293, 341–353 CrossRef CAS.
- J. E. Maneval, D. Bernin, H. T. Fabich, J. D. Seymour and S. L. Codd, Magn. Reson. Chem., 2011, 49, 627–640 CrossRef CAS PubMed.
- H. Frisch, T. Wang and T. Kwei, J. Polym. Sci., Part A-2, 1969, 7, 879–887 CrossRef CAS.
- I. Prigogine, Science, 1978, 201, 777–785 CAS.
- A. Onuki and S. Puri, Phys. Rev. E: Stat. Phys., Plasmas, Fluids, Relat. Interdiscip. Top., 1999, 59, R1331–R1334 CrossRef CAS.
- K. Furusawa, S. Sato, J.-i. Masumoto, Y. Hanazaki, Y. Maki, T. Dobashi, T. Yamamoto, A. Fukui and N. Sasaki, Biomacromolecules, 2011, 13, 29–39 CrossRef PubMed.
- B. Amsden and N. Turner, Biotechnol. Bioeng., 1999, 65, 605–610 CrossRef CAS.
- M. Golmohamadi and K. J. Wilkinson, Carbohydr. Polym., 2013, 94, 82–87 CrossRef CAS PubMed.
- Y. Cheng, R. K. Prud'homme and J. L. Thomas, Macromolecules, 2002, 35, 8111–8121 CrossRef CAS.
- S. Seiffert and W. Oppermann, Polymer, 2008, 49, 4115–4126 CrossRef CAS PubMed.
- J. Hagman, N. Loren and A.-M. Hermansson, Biomacromolecules, 2010, 11, 3359–3366 CrossRef CAS PubMed.
- J. Hagman, Structure Dynamics and Heterogeneity in Soft Materials Determined by FRAP, Ph.D. thesis, Chalmers University of Technology, 2012.
- A. Strom. Characterisation of pectin fine-structure and its effect on supramolecular properties. Ph.D. thesis, Cork University, 2006.
- K. Braeckmans, L. Peeters, N. Sanders, S. De Smedt and J. Demeester, Biophys. J., 2003, 85, 2240–2252 CrossRef CAS.
- J. K. Jonasson, N. Loren, P. Olofsson, M. Nyden and M. Rudemo, J. Microsc., 2008, 232, 260–269 CrossRef CAS PubMed.
- H. Gundersen, T. Bendtsen, L. Korbo, N. Marcussen, A. Møller, K. Nielsen, J. Nyengaard, B. Pakkenberg, F. Sørensen, A. Vesterby and M. West, APMIS, 1988, 96, 379–394 CrossRef CAS.
- K. S. Khairou, W. M. Al-Ghetami and R. Hassan, J. Membr. Sci., 2002, 209, 445–456 CrossRef CAS.
- A. M. Hermansson and M. Langton, in Physical Techniques for the study of food biopolymers, ed. S. Ross-Murphy, Chapman and Hall, 1994, Electron Microscopy, ch. 6, pp. 277–341 Search PubMed.
- H. Treml and H.-H. Kohler, Chem. Phys., 2000, 252, 199–208 CrossRef CAS.
| This journal is © The Royal Society of Chemistry 2014 |


