
 Open Access Article
 This Open Access Article is licensed under a
 Creative Commons Attribution 3.0 Unported Licence
Cobalt sulphide microtube array as cathode in photoelectrochemical water splitting with photoanodes†
Chia-Yu
Lin‡
,
Dirk
Mersch
,
David A.
Jefferson
and
Erwin
Reisner
*
Christian Doppler Laboratory for Sustainable SynGas Chemistry, Department of Chemistry, University of Cambridge, Lensfield Road, Cambridge CB2 1EW, UK. E-mail: reisner@ch.cam.ac.uk
First published on 15th August 2014
Abstract
We report on a cobalt sulphide (CoS) electrode prepared by simple and scalable chemical bath deposition (CBD), which performs as a highly efficient and robust electrocatalyst for the H2 evolution reaction (HER) in both neutral and pH 13 electrolyte solution at a small overpotential (η < 90 mV). At η = 390 mV, turnover frequencies of 38.8 ± 1.9 and 52.1 ± 2.0 mol H2 (mol Co)−1 h−1 were achieved with high stability (Faradaic efficiency >95% for at least 72 h) and turnover numbers of approximately 2600 and 3400 in neutral and basic electrolyte solution, respectively. The rate of HER per geometric area is further enhanced by employing a CoS microtube array (microCoS), which is prepared by sulphurisation of a cobalt hydroxide carbonate nanorod array template using CBD. MicroCoS shows excellent HER activity when it is coupled with a cadmium sulphide sensitised zinc oxide photoanode in the presence of sodium sulphide and a nanostructured hematite (α-Fe2O3) photoanode from photoelectrochemical water splitting in basic electrolyte solution.
Introduction
Photoelectrochemical (PEC) water splitting is a promising approach to convert intermittent sunlight into a storable and renewable chemical fuel, H2.1 The success of clean water splitting systems will not only rely on the development of a device consisting of robust, efficient, inexpensive, and environmentally benign components, but also on the compatibility of the catalysts and light absorbers in an integrated system. The earth-abundant light absorbers2 and water oxidation electrocatalysts3 developed so far are mainly functional in neutral or basic conditions, whereas most non-noble metal-based H2 evolution electrocatalysts (H2-cats)4 require acidic conditions. Although some inexpensive electrocatalysts, such as molybdenum boride/carbide,5 metal nitrides,4f have been reported as promising H2-cats at room temperature in alkaline solution, their preparation often involves costly and energy-intensive processes,4f which makes large-scale production and their integration into the photoelectrodes difficult. As a result, the development of an inexpensive, robust and highly efficient electrocatalyst pair, which operates under the same condition, is an essential challenge, and there is an urgent need for a scalable and inexpensive H2-cat that operates at pH ≥ 7.Cobalt based H2-cats, including metallic Co6 and molecular Co complexes,7 have been proposed as alternative electrocatalysts to noble metals for the hydrogen evolution reaction (HER). However, the requirement of a high overpotential to achieve a reasonable H2 evolution rate in neutral aqueous electrolyte solution or poor stability is an unsolved problem. Recently, a HER catalyst (H2-CoCat) composed of metallic cobalt nanoparticles with a cobalt-oxo/hydroxo-phosphate layer was prepared by prolonged electrodeposition of a cobalt salt in phosphate buffer.8 The H2-CoCat shows considerably higher activity than metallic cobalt in a pH neutral electrolyte solution (TOF of H2-CoCat ∼80 h−1 at η of 385 mV at pH 7),8 and to further explore H2-cats with better HER activity, we therefore decided to explore the HER activity of different cobalt species. Recently, cobalt sulphide has been explored as an effective electrocatalyst for the reduction of tri-iodide,9 poly sulphide,10 and oxygen.11 However, as compared with other metal sulphides,4a–e,12 the application of cobalt sulphide to HER received little attention,4d,13 which can be attributed to the facts that studies have often been carried out under strongly acidic conditions, where cobalt sulphide is prone to dissolution and generation of H2S.
In this study, the HER activity of cobalt sulphide (CoS), prepared by a simple and scalable chemical bath deposition (CBD) method, was thoroughly investigated under neutral and basic conditions. Subsequently, a CoS microtube array was prepared using CBD to further increase the H2 evolution rate per geometric surface area. Finally, we demonstrate that microCoS can be employed as a cathode in efficient PEC water splitting systems, where the use of alkaline electrolyte is often indispensable.
Experimental section
General considerations
Starting materials for the synthetic part of the work were purchased from commercial suppliers and of the highest available purity for the analytical work. Flouride-doped tin oxide (FTO) coated glass (sheet resistance 7 ohm sq−1, TEC Glass™ 7) substrates (1.0 × 3.0 cm2) were cleaned with an ammonia–hydrogen peroxide–deionised water mixture (volume ratio: 1![[thin space (1/6-em)]](https://www.rsc.org/images/entities/char_2009.gif) :1:5) at 70 °C for 20 min, followed by sonication in water for 15 min and drying at room temperature.
:1:5) at 70 °C for 20 min, followed by sonication in water for 15 min and drying at room temperature.
Preparation of CoS, Co3O4, and Co9S8 electrodes
CoS was deposited onto the FTO substrate (exposed area of 2.0 cm2) with epoxy tape (0.14 mm thickness) as spacer by using chemical bath deposition (CBD) in an aqueous solution (10 mL) containing urea (50 mM), CoCl2·6H2O (50 mM), and thioacetamide (0.1 M) at 90 °C for 4 h. The obtained electrode, designated as FTO|CoS, was rinsed with water and dried at room temperature. To prepare FTO|Co3O4 and FTO|Co9S8, FTO|CoS was annealed in air and nitrogen at 500 °C for 2 h, respectively. The film thickness of Co3O4, Co9S8, and CoS is approximately 150 nm. The amount of cobalt species on these electrodes was determined by UV-vis spectrophotometry (0.59 μmol cm−2, vide infra).Preparation of Co(OH)2 electrode
α-Co(OH)2 plates, with average film thickness of ∼5 μm, was deposited onto the FTO substrate (exposed area of 2.0 cm2) using CBD in an aqueous solution (10 mL) containing CoCl2·6H2O (50 mM) and hexamethylenetetramine (0.1 M) at 90 °C for 4 h. The amount of cobalt species was determined by UV-vis spectrophotometry (2.25 μmol cm−2, vide infra). The obtained electrode, designated as FTO|Co(OH)2 electrode, was rinsed with water and dried at room temperature.Preparation of metallic Co electrode
Electro-deposition of metallic cobalt was carried out following a published procedure.14 Briefly, metallic cobalt (∼0.5 μm) was electrodeposited onto the FTO substrate (exposed area of 1.0 cm2) from an aqueous solution (20 mL, pH 4.6) containing ammonium chloride (1 M) and CoCl2·6H2O (0.01 M) at −1.0 V vs. Ag/AgCl for 5 min. The averaged charge passed is 0.68 C cm−2. The amount of metallic cobalt was determined, by UV-vis spectrophotometry (1.59 μmol cm−2, vide infra), corresponding to a Faradaic efficiency of 45%. The obtained electrode, designated as FTO|Co electrode, was rinsed with water and dried at room temperature.Preparation of FTO|microCoS
CoS microtubes (with closed end) were grown on an FTO substrate by first growing layered hydroxide cobalt carbonate acicular nanorods (FTO|nanoLHCC), followed by the conversion of FTO|nanoLHCC into FTO|microCoS under CBD conditions. The FTO|nanoLHCC electrode was prepared following a previously reported procedure.15 The conversion of FTO|nanoLHCC into FTO|microCoS was achieved by immersing FTO|nanoLHCC into a bath solution containing urea (50 mM), CoCl2·6H2O (50 mM), and thioacetamide (0.1 M) at 90 °C for 6 h.Preparation of FTO|nanoZnO|CdSNP
This electrode consists of cadmium sulphide nanoparticles (CdSNP)-sensitised ZnO nanosheets (nanoZnO) on an FTO substrate. Firstly, layered hydroxide zinc carbonate nanosheets (nanoLHZC), ∼15 μm in thickness, were grown on the FTO substrate (2.0 cm2) with epoxy tape as spacer by using CBD in a solution containing urea (16.7 wt%) and zinc nitrate hexahydrate (0.15 M) at 90 °C for 4 h, followed by thermal conversion of nanoLHZC into nanoZnO at 300 °C in air for 30 min.16 The sensitisation of nanoZnO with CdSNP was achieved by using a procedure reported elsewhere.17 Briefly, the FTO|nanoZnO electrode (exposed area of 2.0 cm2) was immersed into a solution (10 mL) containing cadmium chloride (10 mM) and thioacetamide (10 mM) at room temperature for 90 min. Finally, the obtained electrode was rinsed with water and dried at room temperature.Preparation of FTO|nanoFe2O3
To prepare a tin doped α-Fe2O3 nanorod electrode (FTO|nanoFe2O3), β-FeOOH nanorods, with ∼600 nm in length and ∼50 nm in diameter, were firstly grown onto the FTO substrate (2.0 cm2) with epoxy tape as spacer by using CBD in a bath solution containing iron chloride hexahydrate (0.15 M) and urea (6.25 wt%) at 90 °C for 4 h. Thereafter, 20 μL of 20 mM SnCl4 ethanolic solution was drop-coated onto the β-FeOOH nanorods three times, followed by annealing at 750 °C for 30 min. Note that, to remove the excess SnO2, the annealed electrodes are treated in 1 M NaOH at room temperature for 12 h.18Physical characterisation
The surface morphology of the electrodes was characterised using a Phillips XL30-SFGE and a Hitachi SU-8010 scanning electron microscope (SEM). The nanoscale images of the microCoS tubes were obtained using a JEOL 3011 high resolution transmission electron microscope (HR-TEM) with samples made by scratching the film off the FTO substrate and dispersing the powder in acetone under ultrasonication for 5 min. X-ray diffraction (XRD) analyses were carried out using an X'Pert PRO (PANalytical B.V., The Netherlands) and an Ultima IV (Rigaku Co., Japan) X-ray diffractometer. To determine the amount of cobalt on the electrode, these cobalt species were dissolved to form [CoCl4]2− complex ions by ultrasonicating the electrodes (exposed area of 2 cm2) in a concentrated HCl solution (12 N, 10 mL) for 20 min. [CoCl4]2− ions were quantified by measuring the absorbance at 624 nm using a calibration curve of absorbance at 624 nm vs. concentration of [CoCl4]2−. The surface composition of the films was verified by X-ray photoelectron spectroscopy (XPS, PHI 5000 VersaProbe system, ULVAC-PHI, Chigasaki, Japan), using a microfocused (100 μm, 25 W) Al X-ray beam, with a photoelectron take off angle of 45°. The Ar ion source for XPS (FIG-5CE) was controlled by using a floating voltage of 0.2 kV. The binding energies obtained in the XPS analyses were corrected for specimen charging, by referencing the C 1s peak to 285.0 eV.Electrochemical and PEC measurements
Electrochemical experiments were performed with an Ivium CompactStat (Ivium Technologies B.V.) and an Autolab PGSTAT204 (Eco Chemie B.V.) at 25 °C and all potentials are reported against the reversible hydrogen electrode (RHE) by using the equation E (V vs. RHE) = E (V vs. Ag/AgCl) + 0.197 + 0.059 × pH.2e A conventional one-compartment three-electrode electrochemical cell was employed for linear sweep voltammetry (LSV) unless otherwise noted; FTO|CoS, FTO|CoS, FTO|Co(OH)2, FTO|Co3O4, or FTO|Co was used as the working electrode connected to a Pt foil counter electrode and a Ag/AgClsat reference electrode. The electrocatalytic activity of the electrodes (all with exposed area of 1.0 cm2) was evaluated using LSV at a scan rate of 0.05 mV s−1 either in an aqueous pH 7 solution containing triethanolamine (TEOA, 0.05 M) and sodium sulphate (0.1 M), in an aqueous pH 13 solution containing KOH (0.1 M) and sodium sulphate (0.1 M), or in an another basic solution at pH 12.5 with Na2S (0.1 M) and TEOA (0.05 M). Note that a TEOA buffer was used due to the irreversible oxidation of TEOA at the Pt counter electrode (preventing oxidation products to interfere with the reduction at the working electrode) and CoS is also stable in TEOA (in contrast to phosphate buffer; vide infra). When an aqueous basic electrolyte solution was used, the LSVs were carried out with three-electrodes in two-compartments separated by a Nafion® 117 film (note the formation of O2 in the anodic compartment). It is noted that the electrolyte solution was prepared under N2 when Na2S is used to avoid the possible formation of polysulphides.Controlled-potential electrolyses with FTO|CoS, FTO|Co, FTO|Co(OH)2, FTO|Co3O4, and FTO|Co9S8 working electrodes were performed at η = 390 mV to allow for quantitative H2 detection (vide infra). Measurements at low η resulted in correspondingly lower amounts of H2 produced and difficulty to determine the FE accurately.
PEC properties of FTO|nanoFe2O3 and FTO|nanoZnO|CdSNP (exposed area of 1.0 cm2) were examined in a two-compartment electrochemical cell with an aqueous basic electrolyte using LSV at a scan rate of 10 mV s−1 under illumination provided by a solar light simulator (Newport Oriel, 100 mW cm−2; calibrated with Newport High Power Detector equipped with a Newport 1916-R Handheld Optical Power Meter) equipped with an air mass 1.5 global filter and an IR water filter. FTO|nanoFe2O3 or FTO|nanoZnO|CdSNP was used as working electrode, whereas Pt foil or FTO|microCoS was used as counter electrode, and a Ag/AgClsat reference electrode was employed during LSV. The i–t transients and product measurements were carried out in a two-electrode configuration (electrode separation: ∼10 cm). A bias of 1.23 V was applied with the FTO|nanoFe2O3 based PEC water splitting system, whereas zero bias was applied with the FTO|nanoZnO|CdSNP PEC H2 generation system.
Hydrogen and oxygen measurements
The amount of O2 and H2 generated from the two-compartment two-electrode PEC systems was detected and quantified by headspace gas analysis with an Ocean Optics fluorescence O2 probe (FOSPOR-R) and an Agilent 7890A Series gas chromatography (GC) equipped with a 5 Å molecular sieve column (N2 carrier gas at a flow rate of approximately 3 mL min−1), respectively. The O2 probe was inserted in an anodic compartment through a tightly sealed septum and continuous O2 readings (O2 partial pressure) were recorded at 1 s intervals throughout the experiment. For H2 quantification, 20 μL aliquots of the headspace gas were removed from the cathodic compartment of the PEC cell for GC analysis at the end of the experiment. The GC oven holding the columns was kept at 40 °C, and a thermal conductivity detector was used. The two-compartment electrochemical cell was purged with 2% CH4 in N2 (methane acts as internal standard for H2 quantification by GC). The two-electrode PEC cell was kept in the dark for 30 min (control experiment), followed by 2 h standardised solar light illumination (100 mW cm−2) and another 30 min in the dark.Results and discussion
Electrocatalytic HER activity of FTO|CoS thin film
Coating of FTO with a thin film of CoS (FTO|CoS) was accomplished by CBD with CoCl2, urea and thioacetamide on FTO-coated glass in water at 90 °C for 4 h. For comparison, other cobalt species, including Co(OH)2, Co3O4, metallic Co, and Co9S8 were also prepared (see Experimental section). Physical characterisations, including XRD and SEM, of these five cobalt species confirm the identity of the different Co species (Fig. S1 and S2†). Fig. 1 shows LSV scans of the five cobalt species in a pH neutral electrolyte solution (50 mM TEOA and 0.1 M Na2SO4) at a scan rate of 0.05 mV s−1. The reduction of aqueous protons on FTO|CoS onsets at a relatively low overpotential (η) of approximately 20 mV, which is comparable to FTO|Co. FTO|CoS shows a catalytic current density of −1.0 mA cm−2 at an overpotential of 330 mV, which is only 120 mV more cathodic than that of a Pt electrode (Fig. 1a). The overpotential requirement for FTO|CoS to obtain −1.0 mA cm−2 is lower than that for FTO|Co (η ∼ 380 mV), FTO|Co(OH)2 (η ∼ 400 mV), FTO|Co3O4 (η ∼ 450 mV; all data uncorrected for i–R drop). FTO|Co9S8 exhibits the lowest electrocatalytic activity and −0.45 mA cm−2 were observed at η = 450 mV. The difference in the HER activity of these cobalt species could be attributed to the difference in chemical composition, amount of Co loaded on the electrode, and surface morphology (see Fig. S2†). At this electrochemical screening stage, however, we only investigated the effects of chemical composition in more detail.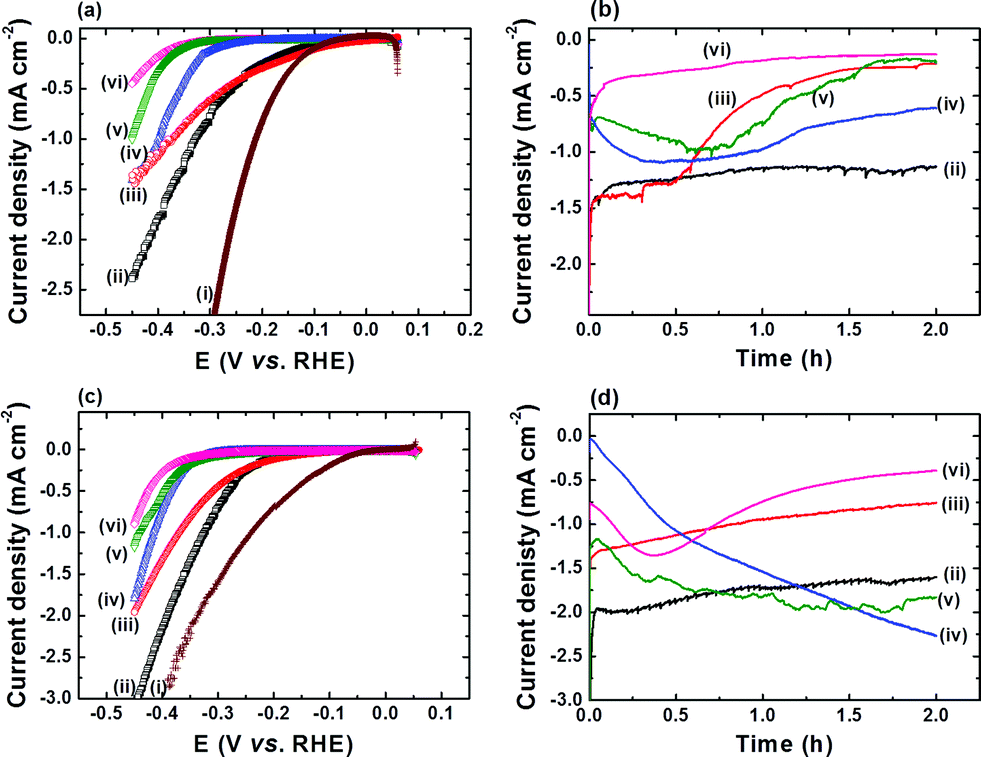 | ||
| Fig. 1 Linear sweep voltammetry (LSV) scans, recorded at 0.05 mV s−1, of cobalt species in (a) pH 7 and (c) pH 13 electrolyte solution (data not corrected for any uncompensated resistance losses). Chronoamperometric curves of the cobalt species at η = 390 mV in (b) pH 7 and (d) pH 13 solution. The neutral pH contains TEOA (50 mM) and Na2SO4 (0.1 M), whereas the pH 13 solution contains KOH (0.1 M) and Na2SO4 (0.1 M) in water. Samples (i) to (vi) are Pt foil (brown), FTO|CoS (black), FTO|Co (red), FTO|Co(OH)2 (blue), FTO|Co3O4 (green), and FTO|Co9S8 (pink trace), respectively. | ||
All cobalt species were subjected to 2 h electrolysis in pH neutral electrolyte solution. The chronoamperometric (i–t) traces at various η are shown in Fig. 1b and S3† the corresponding turnover frequency (TOF) and Faradaic efficiency (FE) at η = 390 mV in Table 1. FTO|CoS showed the highest stability and activity: a TOF of 38.8 ± 1.9 h−1 was reached after 2 h electrolysis and a turnover number (TON) of approximately 2600 with a FE of 96.2 ± 2.8% was observed after 72 h electrolysis at η = 390 mV (see Fig. S4†). FTO|Co showed a slightly lower catalytic onset potential than FTO|CoS, but it was unstable at η > 90 mV with a lower TOF and FE after 2 h electrolysis at η = 390 mV (see Table 1 and Fig. 1). The initial i–t transients of both FTO|Co(OH)2 and FTO|Co3O4 at η > 90 mV indicate low activity and accompanying electrochemical reaction processes (Fig. 1 and S3†). Reduction of Co(OH)2 to metallic Co was reported to occur prior to HER,19 and we therefore suggest that the initial increase in cathodic current results from the reduction of Co(OH)2 to metallic Co, which accompanies HER. FTO|Co3O4 shows two regions with an increasing cathodic current, which might be assigned to the regions where the reductions of Co3+ to Co2+ and Co2+ to Co0 occur.20 These side reactions would further reduce the FE of Co3O4 and Co(OH)2 towards HER. In addition, we observed that the Co3O4 and Co(OH)2 films detached from the electrode during electrolysis, which can be attributed to the surface stress from structural changes induced by the electrochemical reduction processes during the electrolysis, and therefore, Co3O4 and Co(OH)2 are unstable and their corresponding HER activity is lower than FTO|CoS (Table 1).
| Sample | TOFc (h−1) | FE (%) |
|---|---|---|
| a TEOA (0.05 M) and Na2SO4 (0.1 M). b KOH (0.1 M) and Na2SO4 (0.1 M). c Amount of Co was quantified by dissolving the film in concentrated HCl (∼12 M) and measuring the absorbance of [CoCl4]2− by UV-vis spectrophotometry. The TOF values were calculated taking all Co ions, including bulk Co, into account and are therefore an underestimated activity of these cobalt species. d A TON of approximately 2600 with a FE of 96.2 ± 2.8% was obtained at pH 7 and a TON of >3400 with a FE of 94.1 ± 4.8% after 72 h electrolysis at η = 390 mV at pH 13. | ||
| pH 7 | ||
| CoSd | 38.8 ± 1.9 | 99.1 ± 2.0 |
| Co | 8.2 ± 1.7 | 91.8 ± 2.5 |
| Co(OH)2 | 6.8 ± 0.9 | 83.4 ± 10.0 |
| Co3O4 | 15.1 ± 1.1 | 82.1 ± 1.0 |
| Co9S8 | 5.9 ± 0.8 | 72.6 ± 2.3 |
| pH 13 | ||
| CoSd | 52.1 ± 2.0 | 96.3 ± 3.7 |
| Co | 8.3 ± 1.5 | 92.0 ± 8.4 |
| Co(OH)2 | 8.4 ± 1.2 | 75.5 ± 1.2 |
| Co3O4 | 38.6 ± 3.7 | 74.6 ± 3.8 |
| Co9S8 | 28.4 ± 7.7 | 74.4 ± 4.2 |
Fig. 2 shows the XPS spectra of Co 2p and S 2p for the FTO|CoS electrodes before and after 2 h controlled-potential electrolysis at various η. The Co 2p and S 2p spectra display similar features for all measured samples. All Co 2p3/2 peaks appear at a binding energy of approximately 778.0 eV with Co 2p3/2–2p1/2 peak separation of ca. 15.0 eV (Fig. 2a), which is typical for metallic Co or cobalt sulphide.21 The S 2p3/2 peaks at binding energy of approximately 161.8 eV, and S 2p3/2 and 2p1/2 doublet separation of 1.18 eV (Fig. 2b), which corresponds to S2− of CoS.21 The integration of the S 2p and Co 2p3/2 peaks for samples (i) to (v) show that the loss of sulfur in CoS is minimal (<20%) after 2 h controlled-potential electrolysis. In addition, in prolonged electrolysis (24 h electrolysis at η = 390 mV), FTO|CoS kept its crystalline structure (Fig. S5†). The results are in agreement with a previous report, where CoS decomposed only when the applied potential was more negative than −1.0 V (vs. NHE, pH 6.1).22
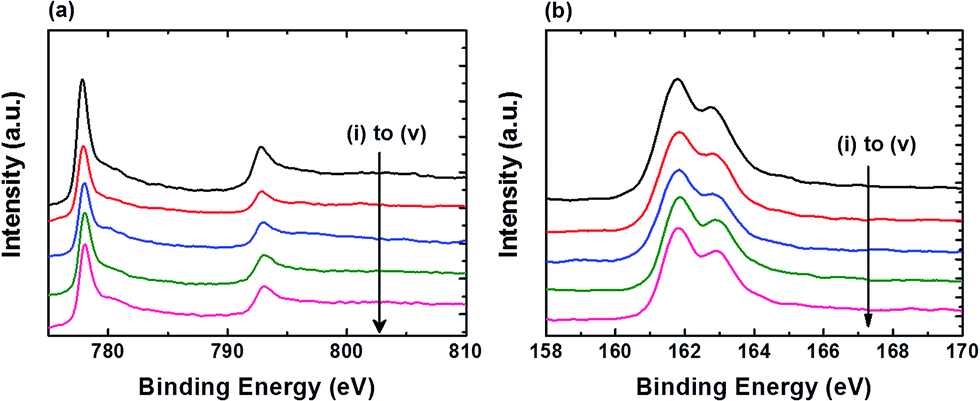 | ||
| Fig. 2 XPS spectra of FTO|CoS before electrolysis (i), and after 2 h electrolysis at (ii) η = 90 mV, (iii) η = 190 mV, (iv) η = 290 mV, (v) η = 390 mV in pH neutral solution (pH 7) containing TEOA (50 mM) and Na2SO4 (0.1 M). (a) Co 2p region. (b) S 2p region. | ||
Fig. 1c and d show the HER activity of all the cobalt species in basic electrolyte solution (0.1 M KOH and 0.1 M Na2SO4 at pH 13). The general trends are similar to pH 7, and FTO|CoS shows the highest HER activity and stability under basic conditions. The TOF and FE values after 2 h electrolysis at η = 390 mV for FTO|CoS, FTO|Co, FTO|Co(OH)2, FTO|Co3O4, and FTO|Co9S8 are given in Table 1. In addition, when the electrolysis at η = 390 mV was extended to 72 h (Fig. S4†), a TON of more than 3400 with an FE of 94.1 ± 4.8% demonstrates that CoS is an efficient and robust catalyst for HER not only in pH neutral, but also in strongly alkaline conditions, where many other state-of-the-art catalysts such as MoSx are not stable.5
CoS shows enhanced HER activity in phosphate buffer (Fig. S6†),23 but we note that employing CoS in phosphate buffer (0.5 M, pH 7) results in the conversion of CoS into a cobalt hydroxide phosphate species with P/Co/O ratio of 1:0.99:9.79 (Fig. S6†). A high HER activity was also reported for CoS2 (∼4 mA cm−2 at η = 225 mV) prepared from an expensive and energy-intensive e-beam evaporation and high temperature annealing process.13b However, HER activity of CoS2 was only examined under strongly acidic conditions (0.5 M H2SO4). In this study, we prepared CoS by a simple and scalable CBD method, whereas the synthesis of other metal sulphides, such as MoSx and WSx typically requires an inert atmosphere, tedious, costly and/or energy intensive procedures.4a,c–e,i,12,13 In addition, our studies show that CoS is highly active over a wide pH range (pH 7 and pH 13) with the cobalt sulphide structure remaining intact during the electrochemical experiments.
Electroactivity of CoS microtube array
We increased the surface roughness of CoS by micro-structuring to enhance the rate of HER per geometric area. An array of layered hydroxide cobalt carbonate acicular nanorods (FTO|nanoLHCC) was first grown onto an FTO substrate in water containing CoCl2 and urea at 90 °C for 4 h, followed by its conversion into a CoS microtube array (FTO|microCoS) via CBD at 90 °C for 6 h (see Experimental section). The conversion of FTO|nanoLHCC into FTO|microCoS was confirmed by XRD and XPS (Fig. S7†). As compared with the CoS thin film (Fig. S2a†), nanoLHCC has a tubular structure and its diameter increases with prolonged reaction time (Fig. 3a and b and S8†), indicating the growth of a CoS layer on nanoLHCC. TEM images (Fig. S9†) confirm that nanoLHCC has a solid interior, but polycrystalline shells and voids form when the sulphurisation process started. A tubular structure is formed after 6 h, which indicates the conversion process involves not only the deposition of CoS onto nanoLHCC from the reaction of Co2+ and S2− ions in the bulk solution, but also the reaction of Co2+ ions inside nanoLHCC with S2− ions close to the nanoLHCC|bath solution interface via the nanoscale Kirkendall effect.24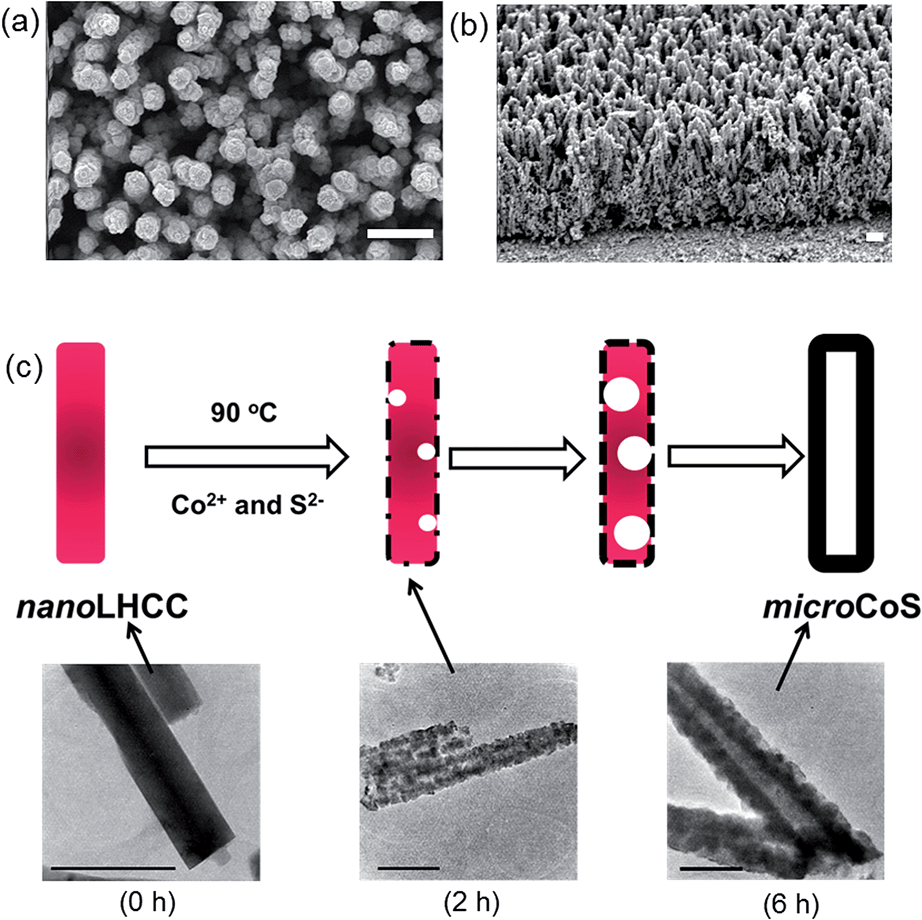 | ||
| Fig. 3 (a) Top-view and (b) tilted (45°) SEM images of FTO|microCoS after 6 h CBD sulphurisation of FTO|nanoLHCC. (c) Schematic illustration of the mechanism of microCoS formation with TEM images at different CBD sulphurisation stages (i.e., 0 h, 2 h, and 6 h, respectively). Scale bars in (a and b) and (c) are 1 and 0.5 μm, respectively. | ||
A possible mechanism for the formation of CoS microtubes is proposed as follows (Fig. 3c): first, S2− ions are released into the bath solution upon decomposition of thioacetamide at 90 °C and react with Co2+ ions and nanoLHCC, resulting in the formation of a CoS shell. The higher diffusivity of cobalt ions than that of sulphide ions results in voids close to the interface, and the thickness of the CoS shell along with the number of voids in the core of the tube increases with reaction time. Finally, the voids connect to each other and form the tubular CoS structure as shown in the TEM images in Fig. 3c and S9.†
The relative effective surface area between FTO|microCoS and FTO|CoS is determined by measuring double-layer capacitance using cyclic voltammetry.25 The results (Fig. S10†) reveal that the effective surface area, i.e., surface roughness, of FTO|microCoS is about 17 times higher than that of FTO|CoS. Fig. S11† shows the LSVs of FTO|microCoS in a basic electrolyte solution (pH 13) containing KOH (0.1 M) and Na2SO4 (0.1 M). It is found that the increased surface roughness indeed remarkably enhances the catalytic current per geometric area; FTO|microCoS shows a current density of −0.44 mA cm−2 at η = 190 mV, which is about six times higher than FTO|CoS (−0.08 mA cm−2, Fig. S11a†). However, the catalytic current of CoS does not scale proportionally with its surface area, i.e., the catalytic current density of FTO|microCoS is lower than that of FTO|CoS after normalisation with respect to the roughness factor (Fig. S11b†), which can be attributed to the loss by (i) increasing i–R drop with increasing current, and (ii) the semiconducting properties of CoS and the short charge carrier diffusion length in CoS.4i The same behaviour has also been observed in neutral electrolyte (50 mM TEOA and 0.1 M Na2SO4), where the average current density of FTO|microCoS during 24 h electrolysis at η = 390 mV is about −2.7 mA cm−2, which is only about 2.25 times higher than that of FTO|CoS (see Fig. S5a and S12a†). We note that FTO|nanoLHCC is inactive towards HER (see Fig. S13†), and the maximal HER activity of FTO|microCoS can therefore only be expected when nanoLHCC is completely converted into microCoS (6 h). FTO|microCoS also kept its crystalline structure after 24 h electrolysis as confirmed by XRD (Fig. S12b†). Nevertheless, the excellent geometric catalytic current of microCoS motivated us to employ FTO|microCoS as a cathode in PEC water splitting, where the use of alkaline electrolyte is often indispensable.
MicroCoS as cathode in PEC water splitting
Hematite (α-Fe2O3), an earth-abundant and chemically stable semiconductor, has a bandgap of 2.2 eV and a favourable valence band potential for water oxidation, which makes itself a promising photoanode material for PEC water oxidation.2e,f,26 The conduction band level of hematite is more positive than the potential of proton reduction, and an external bias is therefore required when it is combined with a H2 evolving cathode in a two-electrode PEC water splitting device.26 In addition, the use of a hematite photoanode requires an alkaline electrolyte solution, which in the past has limited the selection of cathode materials to noble metals such as Pt.2e,f Here, we demonstrate that FTO|microCoS can be used as an inexpensive alternative to Pt in this hematite based PEC water splitting system. A tin doped hematite nanorod (FTO|nanoFe2O3) photoanode is prepared by using a similar procedure reported previously (see Experimental section).27 Physical characterisations of FTO|nanoFe2O3 are shown in Fig. 4a and S14.† FTO|nanoFe2O3 (2 cm2) shows a photocurrent of approximately 0.6 mA at 1.23 V vs. RHE in a three-electrode, two compartment cell under standardised solar light irradiation (100 mW cm−2, AM 1.5G, Fig. 4b).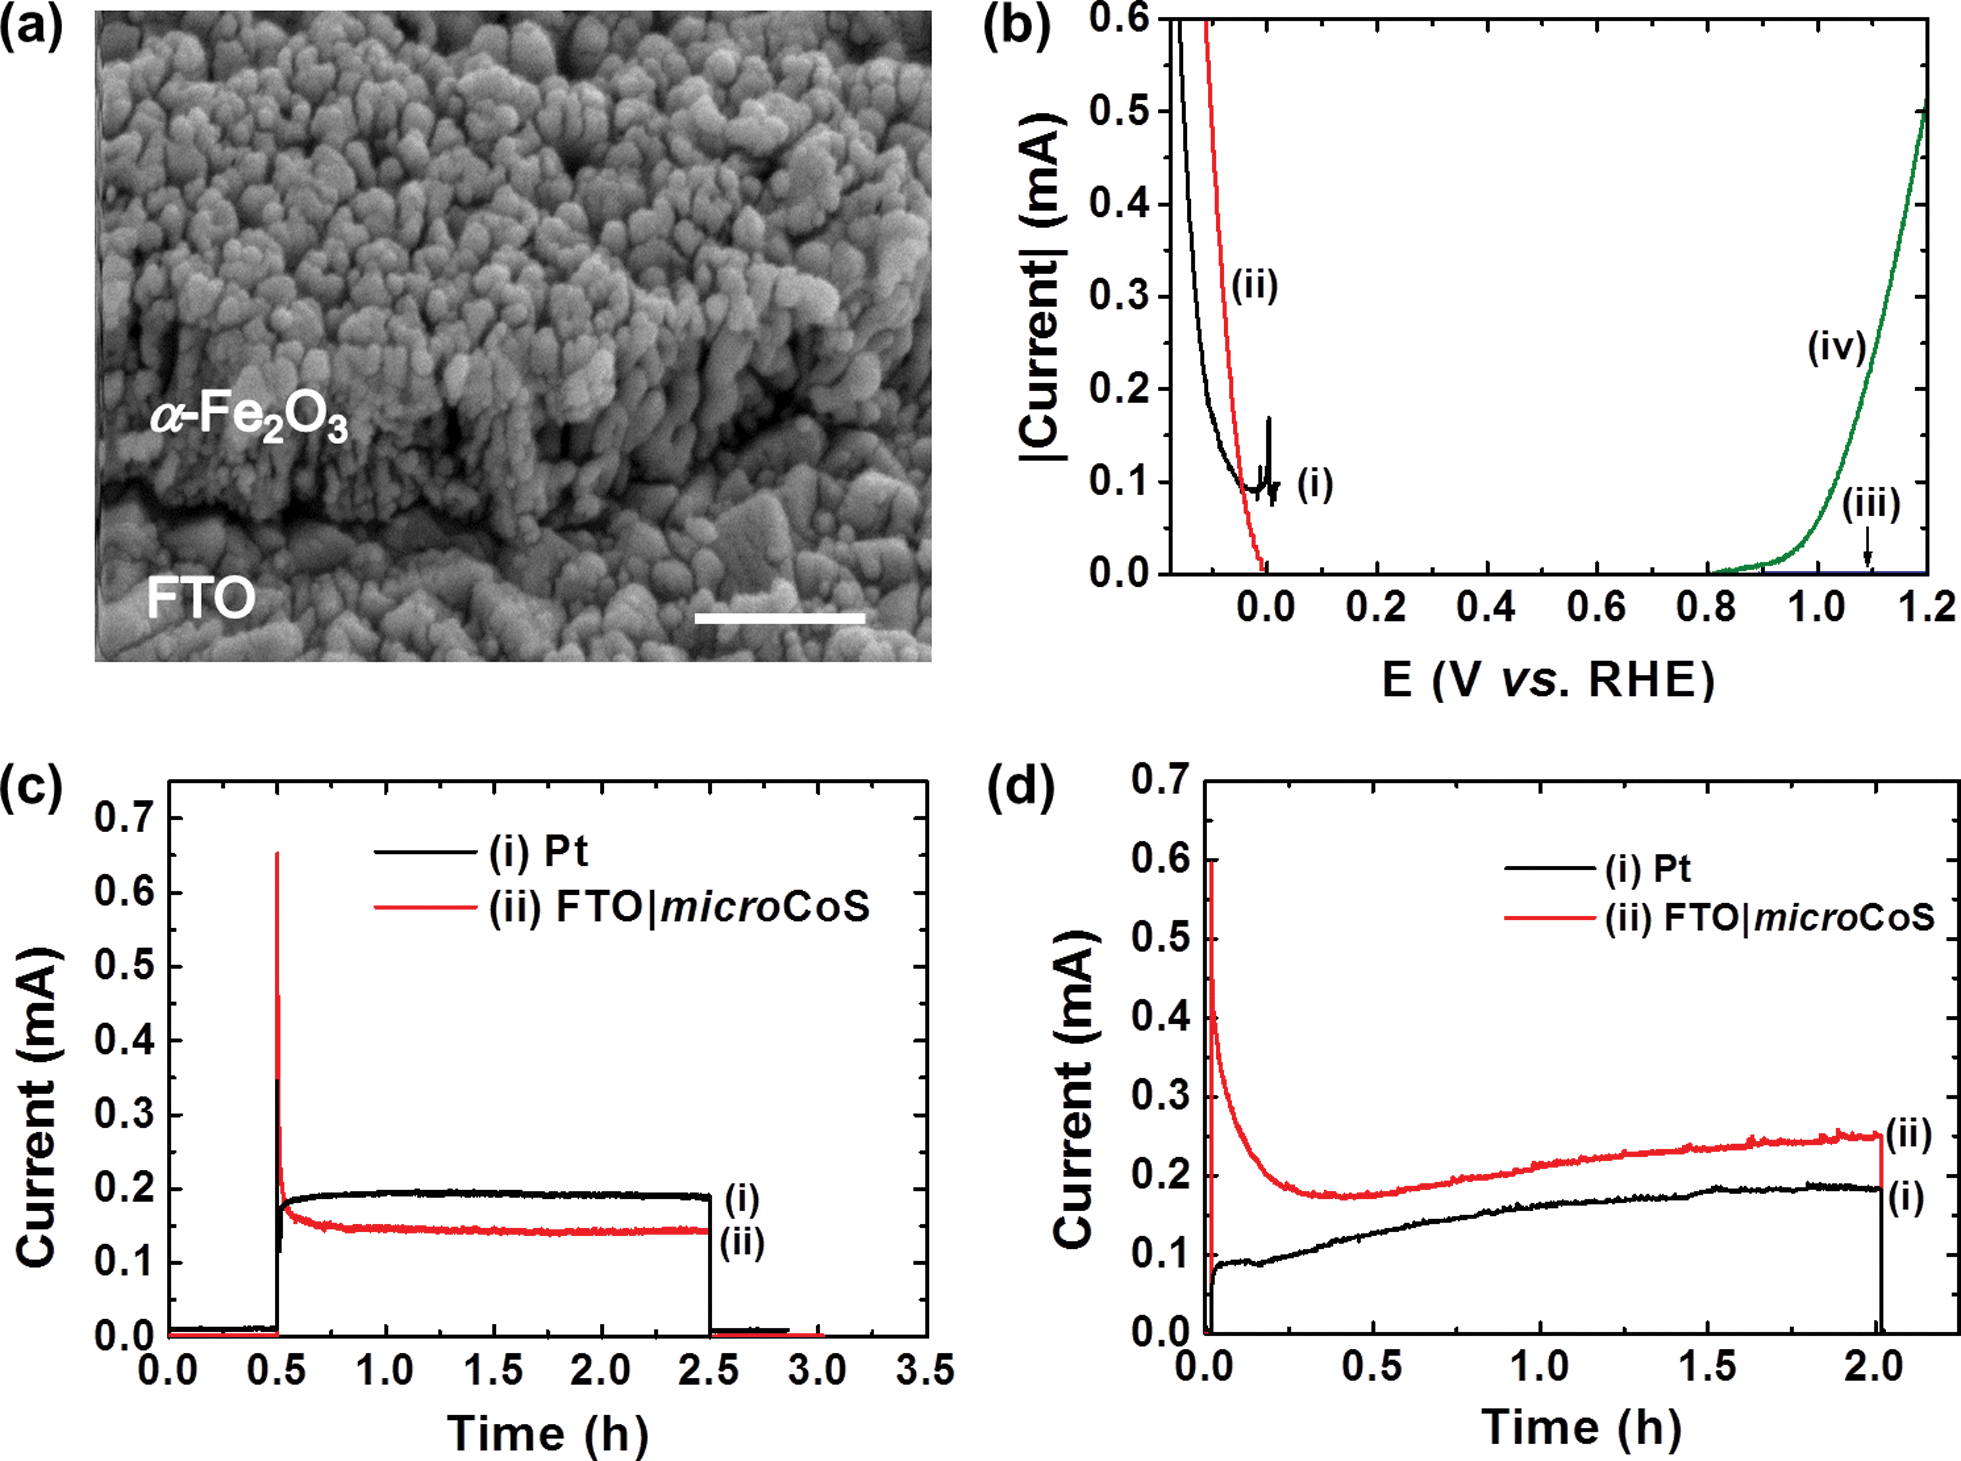 | ||
| Fig. 4 (a) SEM image of FTO|nanoFe2O3. Scale bar is 0.5 μm. (b) LSVs of FTO|microCoS (i, 2.5 cm2), Pt (ii, 2.5 cm2), and FTO|nanoFe2O3 (2.0 cm2) in the dark (iii) and during irradiation (iv). LSVs for FTO|microCoS and Pt were recorded at 0.05 mV s−1, whereas LSVs for FTO|nanoFe2O3 was recorded at 5 mV s−1. (c) Photocurrent transients of a two-electrode PEC cell with Pt or FTO|microCoS combined with FTO|nanoFe2O3 at 1.23 V bias under irradiation. The electrolyte used for b and c contains KOH (0.1 M) and Na2SO4 (0.1 M) at pH 13. (d) Photocurrent transients of a two-electrode PEC cell with Pt or FTO|microCoS combined with FTO|nanoZnO|CdSNP at short-circuit condition under irradiation at pH 12.5. Light intensity: 100 mW cm−2 (AM 1.5G). MicroCoS in (b) shows a 80 μA capacitive (non-Faradaic) current at 0 V vs. RHE in (curve i). The dark current shown in curve (ii) in (c) and (d) is negligible. | ||
FTO|nanoFe2O3 was subsequently combined with a Pt or FTO|microCoS cathode (2.5 cm2) in a two-electrode two-compartment PEC cell. A photocurrent of 0.15 to 0.20 mA was obtained at an external bias of 1.23 V (Fig. 4c). Note that the separation between photoanode and cathode is approximately 10 cm, and therefore, the loss in photocurrent by i–R drop is expected to be significant.28 The amount of H2 and O2 detected from PEC water splitting after 2 h irradiation (100 mW cm−2, AM 1.5G) was (i) 4.3 ± 0.4 μmol H2 and 2.3 ± 0.4 μmol O2 with a Pt foil and 2.7 ± 0.2 μmol H2 and 1.9 ± 0.2 μmol O2 with FTO|microCoS as cathode (Fig. S15†). FTO|microCoS therefore produces approximately 37% less H2 than Pt. The lower H2 production yield can be attributed to the additional 50 mV overpotential requirement for FTO|microCoS to show comparable catalytic current with Pt (Fig. 4b). We note that there was no obvious change in surface morphology (SEM) and surface composition (XPS) of FTO|nanoFe2O3 after 2 h PEC experiment, indicating FTO|nanoFe2O3 is stable during PEC conditions (Fig. S14e–i†).
Another demonstration (Fig. 4d and S16†) of FTO|microCoS in PEC H2 generation is its coupling with a cadmium sulphide (CdS) nanoparticle sensitised ZnO nanosheet photoanode (FTO|nanoZnO|CdSNP) in basic electrolyte (pH 12.5) containing TEOA (50 mM) and Na2S (0.1 M). CdS has received much attention due to its suitable bandgap (∼2.4 eV) and favourable conduction band position (−1.1 V vs. NHE, pH 7)29 for H2 generation. However, the use of a hole scavenger, such as Na2S, is necessary to prevent CdS from photocorrosion by the photo-generated holes in CdS, which is the reason why there is no O2 evolution in this system. The physical characterisation of FTO|nanoZnO|CdSNP is shown in Fig. S16a–d.† The highly porous ZnO nanosheet architecture, which is prepared by growing layered zinc hydroxide carbonate using CBD, followed by thermal annealing, not only provides high surface area for CdSNP loading, but also facilitates the diffusion of the sacrificial hole scavenger, resulting in a high photocurrent response with good stability. Fig. 4d shows that the photocurrent response of the PEC cell with FTO|microCoS, operated at short-circuit condition as cathode is higher than that with Pt foil as cathode, which can be attributed in part to poisoning of Pt by sulphur species.30 After 2 h irradiation, the PEC cell with Pt as cathode generated 3.1 ± 0.4 μmol H2, whereas FTO|microCoS produced 4.0 ± 0.9 μmol H2. As with FTO|nanoFe2O3, SEM and XPS analysis of FTO|nanoZnO|CdSNP showed no signs of changes in surface morphology and surface composition after 2 h PEC experiment (Fig. S16d–h†).
Conclusions
In this study, CoS has been selected from a series of different Co species as the most active and as a robust material in catalysing HER under both neutral (pH 7) and basic (pH 13) aqueous conditions. The three-dimensional morphology of microtubular CoS can easily be prepared by CBD and microCoS displays a substantially enhanced catalytic current per geometric area for H2 generation compared to flat CoS films. The microCoS array was employed as efficient cathode in combination with photoanodes such as a nanostructured α-Fe2O3 (hematite) photoanode, thereby allowing for water splitting in a PEC cell fully made of earth abundant elements.Acknowledgements
Financial support from EPSRC (EP/H00338X/2 and Cambridge Centre for Doctoral Training in Sustainable and Functional Nano), the Christian Doppler Research Association (Austrian Federal Ministry of Science, Research and Economy, and National Foundation for Research, Technology and Development) and the OMV Group is gratefully acknowledged. We also thank the Ministry of Science and Technology, and Ministry of Education, Taiwan (102-2218-E-006-014-MY2 and the Aim for the Top University Project to National Cheng Kung University, respectively).References
- N. S. Lewis and D. G. Nocera, Proc. Natl. Acad. Sci. U. S. A., 2006, 103, 15729–15735 CrossRef CAS PubMed.
- (a) C.-Y. Lin, Y.-H. Lai, D. Mersch and E. Reisner, Chem. Sci., 2012, 3, 3482–3487 RSC; (b) J. Su, L. Guo, N. Bao and C. A. Grimes, Nano Lett., 2011, 11, 1928–1933 CrossRef CAS PubMed; (c) Y. Lin, S. Zhou, S. W. Sheehan and D. Wang, J. Am. Chem. Soc., 2011, 133, 2398–2401 CrossRef CAS PubMed; (d) G. K. Mor, O. K. Varghese, R. H. T. Wilke, S. Sharma, K. Shankar, T. J. Latempa, K.-S. Choi and C. A. Grimes, Nano Lett., 2008, 8, 1906–1911 CrossRef CAS PubMed; (e) I. Cesar, A. Kay, J. A. G. Martinez and M. Grätzel, J. Am. Chem. Soc., 2006, 128, 4582–4583 CrossRef CAS PubMed; (f) K. Sivula, R. Zboril, F. Le Formal, R. Robert, A. Weidenkaff, J. Tucek, J. Frydrych and M. Grätzel, J. Am. Chem. Soc., 2010, 132, 7436–7444 CrossRef CAS PubMed.
- (a) J. A. Seabold and K.-S. Choi, J. Am. Chem. Soc., 2012, 134, 2186–2192 CrossRef CAS PubMed; (b) M. Dincă, Y. Surendranath and D. G. Nocera, Proc. Natl. Acad. Sci. U. S. A., 2010, 107, 10337–10341 CrossRef PubMed; (c) M. W. Kanan and D. G. Nocera, Science, 2008, 321, 1072–1075 CrossRef CAS PubMed; (d) G. L. Elizarova, G. M. Zhidomirov and V. N. Parmon, Catal. Today, 2000, 58, 71–88 CrossRef CAS; (e) R. E. Rocheleau, E. L. Miller and A. Misra, Energy Fuels, 1998, 12, 3–10 CrossRef CAS; (f) Y.-H. Lai, T. C. King, D. S. Wright and E. Reisner, Chem. – Eur. J., 2013, 19, 12943–12947 CrossRef CAS PubMed.
- (a) H. Vrubel, D. Merki and X. Hu, Energy Environ. Sci., 2012, 5, 6136–6144 RSC; (b) J. Kibsgaard, Z. Chen, B. N. Reinecke and T. F. Jaramillo, Nat. Mater., 2012, 11, 963–969 CrossRef CAS PubMed; (c) D. Merki, S. Fierro, H. Vrubel and X. Hu, Chem. Sci., 2011, 2, 1262–1267 RSC; (d) J. Bonde, P. G. Moses, T. F. Jaramillo, J. K. Nørskov and I. Chorkendorff, Faraday Discuss., 2008, 140, 219–231 RSC; (e) T. F. Jaramillo, K. P. Jørgensen, J. Bonde, J. H. Nielsen, S. Horch and I. Chorkendorff, Science, 2007, 317, 100–102 CrossRef CAS PubMed; (f) W.-F. Chen, K. Sasaki, C. Ma, A. I. Frenkel, N. Marinkovic, J. T. Muckerman, Y. Zhu and R. R. Adzic, Angew. Chem., Int. Ed., 2012, 51, 6131–6135 CrossRef CAS PubMed; (g) M. L. Helm, M. P. Stewart, R. M. Bullock, M. Rakowski DuBois and D. L. DuBois, Science, 2011, 333, 863–866 CrossRef CAS PubMed; (h) Y. Hou, B. L. Abrams, P. C. K. Vesborg, M. E. Björketun, K. Herbst, L. Bech, A. M. Setti, C. D. Damsgaard, T. Pedersen, O. Hansen, J. Rossmeisl, S. Dahl, J. K. Nørskov and I. Chorkendorff, Nat. Mater., 2011, 10, 434–438 CrossRef CAS PubMed; (i) D. Voiry, H. Yamaguchi, J. Li, R. Silva, D. C. B. Alves, T. Fujita, M. Chen, T. Asefa, V. B. Shenoy, G. Eda and M. Chhowalla, Nat. Mater., 2013, 12, 850–855 CrossRef CAS PubMed.
- H. Vrubel and X. Hu, Angew. Chem., Int. Ed., 2012, 51, 12703–12706 CrossRef CAS PubMed.
- P. D. Tran, L. Xi, S. K. Batabyal, L. H. Wong, J. Barber and J. S. C. Loo, Phys. Chem. Chem. Phys., 2012, 14, 11596–11599 RSC.
- (a) N. M. Muresan, J. Willkomm, D. Mersch, Y. Vaynzof and E. Reisner, Angew. Chem., Int. Ed., 2012, 51, 12749–12753 CrossRef CAS PubMed; (b) E. S. Andreiadis, P.-A. Jacques, P. D. Tran, A. Leyris, M. Chavarot-Kerlidou, B. Jousselme, M. Matheron, J. Pécaut, S. Palacin, M. Fontecave and V. Artero, Nat. Chem., 2013, 5, 48–53 CrossRef CAS PubMed.
- S. Cobo, J. Heidkamp, P.-A. Jacques, J. Fize, V. Fourmond, L. Guetaz, B. Jousselme, V. Ivanova, H. Dau, S. Palacin, M. Fontecave and V. Artero, Nat. Mater., 2012, 11, 802–807 CrossRef CAS PubMed.
- C.-W. Kung, H.-W. Chen, C.-Y. Lin, K.-C. Huang, R. Vittal and K.-C. Ho, ACS Nano, 2012, 6, 7016–7025 CrossRef CAS PubMed.
- Z. Yang, C.-Y. Chen, C.-W. Liu and H.-T. Chang, Chem. Commun., 2010, 46, 5485–5487 RSC.
- S. M. Ahmed, Int. J. Miner. Process., 1978, 5, 163–174 CrossRef CAS.
- P. D. Tran, M. Nguyen, S. S. Pramana, A. Bhattacharjee, S. Y. Chiam, J. Fize, M. J. Field, V. Artero, L. H. Wong, J. Loo and J. Barber, Energy Environ. Sci., 2012, 5, 8912–8916 CAS.
- (a) D. Merki, H. Vrubel, L. Rovelli, S. Fierro and X. Hu, Chem. Sci., 2012, 3, 2515–2525 RSC; (b) D. Kong, J. J. Cha, H. Wang, H. R. Lee and Y. Cui, Energy Environ. Sci., 2013, 6, 3553–3558 RSC.
- C. Q. Cui, S. P. Jiang and A. C. C. Tseung, J. Electrochem. Soc., 1990, 137, 3418–3423 CrossRef CAS PubMed.
- C.-W. Kung, C.-Y. Lin, Y.-H. Lai, R. Vittal and K. C. Ho, Biosens. Bioelectron., 2011, 27, 125–131 CrossRef CAS PubMed.
- C.-Y. Lin, Y.-H. Lai, H.-W. Chen, J.-G. Chen, C.-W. Kung, R. Vittal and K.-C. Ho, Energy Environ. Sci., 2011, 4, 3448–3455 CAS.
- E. D. Spoerke, M. T. Lloyd, Y.-j. Lee, T. N. Lambert, B. B. McKenzie, Y.-B. Jiang, D. C. Olson, T. L. Sounart, J. W. P. Hsu and J. A. Voigt, J. Phys. Chem. C, 2009, 113, 16329–16336 CAS.
- L. Xi, S. Y. Chiam, W. F. Mak, P. D. Tran, J. Barber, S. C. J. Loo and L. H. Wong, Chem. Sci., 2013, 4, 164–169 RSC.
- (a) A. Galtayries and J. Grimblot, J. Electron Spectrosc. Relat. Phenom., 1999, 98–99, 267–275 CrossRef CAS; (b) T. Baird, K. C. Campbell, P. J. Holliman, R. W. Hoyle, M. Huxam, D. Stirling, B. P. Williams and M. Morris, J. Mater. Chem., 1999, 9, 599–605 RSC.
- M. Pourbaix, Atlas of electrochemical equilibria in aqueous solutions, National Association of Corrosion Engineers, Huston, TX, 1974, pp. 324–325 Search PubMed.
- G. Valiulienė, A. Žielienė and J. Vinkevičius, J. Solid State Electrochem., 2002, 6, 396–402 CrossRef.
- P. Elumalai, H. N. Vasan and N. Munichandraiah, J. Power Sources, 2001, 93, 201–208 CrossRef CAS.
- Y. Sun, C. Liu, D. C. Grauer, J. Yano, J. R. Long, P. Yang and C. J. Chang, J. Am. Chem. Soc., 2013, 135, 17699–17702 CrossRef CAS PubMed.
- Y. Yin, R. M. Rioux, C. K. Erdonmez, S. Hughes, G. A. Somorjai and A. P. Alivisatos, Science, 2004, 304, 711–714 CrossRef CAS PubMed.
- S. Trasatti and O. A. Petrii, Pure Appl. Chem., 1991, 63, 711–734 CrossRef CAS.
- R. L. Spray, K. J. McDonald and K.-S. Choi, J. Phys. Chem. C, 2011, 115, 3497–3506 CAS.
- L. Xi, S. Y. Chiam, W. F. Mak, P. D. Tran, J. Barber, S. C. J. Loo and L. H. Wong, Chem. Sci., 2013, 4, 164–169 RSC.
- E. A. Hernández-Pagán, N. M. Vargas-Barbosa, T. Wang, Y. Zhao, E. S. Smotkin and T. E. Mallouk, Energy Environ. Sci., 2012, 5, 7582–7589 Search PubMed.
- J. Ran, J. Yu and M. Jaroniec, Green Chem., 2011, 13, 2708–2713 RSC.
- V. A. Sethuraman and J. W. Weidner, Electrochim. Acta, 2010, 55, 5683–5694 CrossRef CAS PubMed.
Footnotes |
| † Electronic supplementary information (ESI) available: Experimental details, crystallographic data and spectral data. See DOI: 10.1039/c4sc01811g |
| ‡ Current address: Department of Chemical Engineering, National Cheng Kung University, 1 University Road, Tainan City 70101, Taiwan. |
| This journal is © The Royal Society of Chemistry 2014 |