 Open Access Article
Creative Commons Attribution 3.0 Unported Licence
A solvent-resistant halogen bond†
Craig C.
Robertson
a,
Robin N.
Perutz
*b,
Lee
Brammer
*a and
Christopher A.
Hunter
*a
aDepartment of Chemistry, University of Sheffield, Brook Hill, Sheffield, S3 7HF, United Kingdom. E-mail: c.hunter@shef.ac.uk
bDepartment of Chemistry, University of York, Heslington, York, YO10 5DD, United Kingdom
First published on 30th July 2014
Abstract
The effect of solvent on the stabilities of complexes involving a single H-bond or halogen-bond (X-bond) has been quantified. Association constants for binary complexes of 4-(phenylazo)phenol, molecular iodine, tetramethylurea and tetramethylthiourea have been measured in fifteen different solvents by UV/vis absorption and 1H NMR titration experiments. The stabilities of the H-bonded complexes decrease by more than three orders of magnitude with increasing solvent polarity. In contrast, the X-bonded complex of molecular iodine with tetramethylthiourea is remarkably insensitive to the nature of the solvent (association constants measured in alkanes and alcohols are similar). The results suggest that, in contrast to H-bonds, where electrostatics determine thermodynamic stability, charge-transfer interactions make a major contribution to the stability of these X-bonded complexes rendering them resistant to increases in solvent polarity.
Introduction
A halogen bond (X-bond) is an attractive interaction between an electron-deficient halogen and a Lewis base or π-system.1–3 X-bonds were first reported over a century ago by Guthrie4 but have recently become a focus of attention in the fields of crystal engineering,5–10 protein–ligand interactions,11,12 catalysis13 and supramolecular and materials chemistry.14–20 Analysis of the geometries of X-bonds, D–X⋯A, in crystal structures reveal directional preferences that point to the role of the halogen “σ-hole” situated trans to the covalent D–X bond (DX and A are the X-bond donor and acceptor respectively). However, it is not clear whether this observation is due to the fact that (a) the σ-hole is the best site for an electrostatic interaction because the σ-hole is the most positive region on the molecular electrostatic potential surface, or (b) due to the fact that the σ-hole is the best site for a charge transfer interaction because the D–X σ* orbital is low in energy.21 Here we resolve this issue by investigating the effect of solvent on the thermodynamic stabilities of X-bonded complexes.The thermodynamic properties of X-bonds have been characterized for a wide range of complexes in non-polar organic solvents.22–24 Laurence et al. used experimentally determined association constants for 1![[thin space (1/6-em)]](https://www.rsc.org/images/entities/char_2009.gif) :
:![[thin space (1/6-em)]](https://www.rsc.org/images/entities/char_2009.gif) 1 complexes formed with molecular iodine in alkane solvents to develop a thermodynamic scale, pKBI2, to classify X-bond acceptor functional groups.22a The pKBI2 scale shows some parallels with the corresponding scale developed for H-bond interactions, pKBHX, which is based on experimentally determined association constants for formation of 1
1 complexes formed with molecular iodine in alkane solvents to develop a thermodynamic scale, pKBI2, to classify X-bond acceptor functional groups.22a The pKBI2 scale shows some parallels with the corresponding scale developed for H-bond interactions, pKBHX, which is based on experimentally determined association constants for formation of 1![[thin space (1/6-em)]](https://www.rsc.org/images/entities/char_2009.gif) :
:![[thin space (1/6-em)]](https://www.rsc.org/images/entities/char_2009.gif) 1 complexes with 4-fluorophenol in carbon tetrachloride.25 However, there are some clear differences between the two scales, which suggests that there are fundamental differences between the factors that govern the thermodynamic properties of X-bonds and H-bonds. X-bonds are generally weaker than H-bonds, so experimental studies have focused on non-polar solvents, but here we show that it is possible to quantify X-bond interactions in much more polar solvent environments, providing some unique insight into the fundamental nature of the interaction.
1 complexes with 4-fluorophenol in carbon tetrachloride.25 However, there are some clear differences between the two scales, which suggests that there are fundamental differences between the factors that govern the thermodynamic properties of X-bonds and H-bonds. X-bonds are generally weaker than H-bonds, so experimental studies have focused on non-polar solvents, but here we show that it is possible to quantify X-bond interactions in much more polar solvent environments, providing some unique insight into the fundamental nature of the interaction.
Fig. 1 illustrates the electrostatic solvent competition model that we have developed for H-bonding interactions.26 The energy of a pairwise intermolecular interaction is estimated using the H-bond parameters, α and β, and solution-phase free energy change for complexation is obtained by comparing stabilities of the four complexes in Fig. 1 (eqn (1)).
| ΔG°calc = −(α − αS) × (β − βS) + c | (1) |
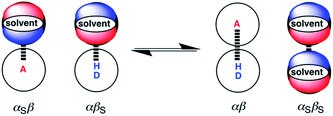 | ||
| Fig. 1 Formation of a complex between a H-bond donor (D–H) and a H-bond acceptor (A). The position of equilibrium is determined by the four interaction energies, which can be estimated using the H-bond parameters α, β, αS and βS (see eqn (1)).26 | ||
The parameters used in eqn (1) can be derived from molecular electrostatic potential surfaces calculated for the isolated molecules in the gas phase, so the thermodynamic properties of H-bonds can be estimated in a straightforward way from the chemical structures of the components.27 The validity of eqn (1) was confirmed by comparison of ΔG°calc with experimental measurements on a range of different complexes in different solvents.28eqn (1) implies that the solvent competes for interactions at specific sites on the solutes and that the bulk solvent properties do not play an important role. Studies of solvent effects therefore offer excellent opportunities to probe the nature of intermolecular interactions, and here we apply this approach to X-bonds.
The compounds used are shown in Scheme 1. The 1·3 H-bonded complex and the 2·4 X-bonded complex are both known to be very stable in non-polar solvents,26,29 so these systems are promising candidates for quantifying binding interactions in more competitive solvents. In addition, the interaction of molecular iodine with thiocarbonyl compounds has been extensively studied by a variety of spectroscopic methods, and characteristic signatures have been identified for the different covalent and non-covalent adducts that can be formed.30
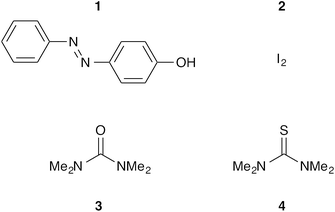 | ||
| Scheme 1 H-bond donor 4-(phenylazo)phenol 1 (α = 4.2), X-bond donor iodine 2 and acceptors 3 tetramethylurea (β = 8.8) and 4 tetramethylthiourea (β = 6.4).26 | ||
Results and discussion
UV/vis absorption titrations were carried out on the two H-bonded complexes, 1·3 and 1·4, and the two X-bonded complexes, 2·3 and 2·4, in fifteen different solvents. Typical results are illustrated in Fig. 2 (see ESI† for full details). The π–π* absorption band of 1 shifts from 336–342 nm to 350–354 nm on formation of a H-bond (Fig. 2a). Fitting the titration data to a 1![[thin space (1/6-em)]](https://www.rsc.org/images/entities/char_2009.gif) :
:![[thin space (1/6-em)]](https://www.rsc.org/images/entities/char_2009.gif) 1 binding isotherm gave the association constants recorded in Table 1. For some systems, absorption of the guest or the solvent obscured part of the UV/vis spectrum, so titrations were also carried out using 1H NMR spectroscopy. For systems where both UV/vis and NMR titrations were carried out, the results were consistent.
1 binding isotherm gave the association constants recorded in Table 1. For some systems, absorption of the guest or the solvent obscured part of the UV/vis spectrum, so titrations were also carried out using 1H NMR spectroscopy. For systems where both UV/vis and NMR titrations were carried out, the results were consistent.
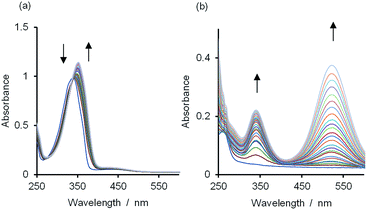 | ||
| Fig. 2 UV/vis spectra for titrations of (a) 3 into a 0.1 mM solution of 1 and (b) 2 into a 0.01 mM solution of 4 in n-octane at 298 K. | ||
| Solvent | H-bond | X-bond | ||
|---|---|---|---|---|
| 1·3 | 1·4 | 2·3 | 2·4 | |
| a See ESI for errors. In all cases, greater than 50% saturation of the binding isotherm was achieved. b Measured by 1H NMR titration. | ||||
| n-Octane | 2400 | 370 | 12 | 8800 |
| Carbon tetrachloride | 410 | 24b | 6 | 7300 |
| Toluene | 230 | 4 | 3 | 11![[thin space (1/6-em)]](https://www.rsc.org/images/entities/char_2009.gif) 000 000 |
| Diiodomethane | 210b | 6b | <1 | 37![[thin space (1/6-em)]](https://www.rsc.org/images/entities/char_2009.gif) 000 000 |
| Dibromomethane | 110 | <1 | <1 | 34![[thin space (1/6-em)]](https://www.rsc.org/images/entities/char_2009.gif) 000 000 |
| Dichloromethane | 90 | 9 | 2 | 58![[thin space (1/6-em)]](https://www.rsc.org/images/entities/char_2009.gif) 000b 000b |
| Chloroform | 52 | 2b | 1 | 20![[thin space (1/6-em)]](https://www.rsc.org/images/entities/char_2009.gif) 000 000 |
| 1,1,2,2-Tetrachloroethane | 35 | 6b | <1 | 55![[thin space (1/6-em)]](https://www.rsc.org/images/entities/char_2009.gif) 000 000 |
| Di-n-octyl ether | <1 | <1 | <1 | 1600 |
| Acetone | 2b | <1 | <1 | 1900b |
| Acetonitrile | 3b | <1 | <1 | 2800b |
| Nitromethane | 5b | <1 | <1 | 2100b |
| i-Propanol | <1 | <1 | <1 | 3600b |
| Ethanol | <1 | <1 | <1 | 3200b |
| Methanol | <1 | <1 | <1 | 2700b |
The 2·4 complex has a charge-transfer absorption band with λmax observed in the range 330–340 nm, depending on solvent (Fig. 2b; ESI Section 8†). In addition, the πg–σu absorption band of 2 shifts from λmax in the range 478–523 nm to 431–450 nm on formation of a X-bond. The latter blue-shifted band is more difficult to discern in the titration of 2 into 4 (Fig. 2b), but clearly evident in the titration of 3 into 2 (Fig. S37†). Fig. 3 shows the spectra for the fully bound X-bonded complexes 2·3 and 2·4.31 The charge-transfer band at 330–340 nm dominates in the 2·4 spectrum but is not present in the UV/vis spectrum of the 2·3 complex. The blue-shifted band for 2 at 431–450 nm is now clearly evident for both complexes. Thiocarbonyl compounds can react with molecular iodine to form a variety of different covalent adducts.30 However, the charge-transfer band observed in the 2·4 titrations is characteristic of a complex where the I–I bond is intact.32 In polar solvents, the 2·4 complex did react slowly to give new signals in the 1H NMR spectrum (see ESI†). Formation of these covalent adducts did not occur over the timescale of the titration experiments reported here.
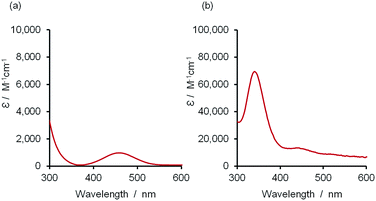 | ||
| Fig. 3 UV/vis spectra of (a) the 2·3 complex and (b) the 2·4 complex calculated from the UV/vis titration data in n-octane.31 | ||
The association constants measured for the H-bonded complexes, 1·3 and 1·4, span three orders of magnitude, and the values agree well with the free energy changes predicted by eqn (1) (Fig. 4, data in blue and red respectively). This implies that the stabilities of the complexes are determined simply by the relative polarities of the solutes and solvents: the complexes formed with 3 are more stable than the complexes formed with 4 in all solvents, because 3 is a more polar H-bond acceptor; the complexes are most stable in the least polar solvent, n-octane, and the stability decreases with solvent polarity, so that binding is too weak to measure in the most polar solvent, methanol.
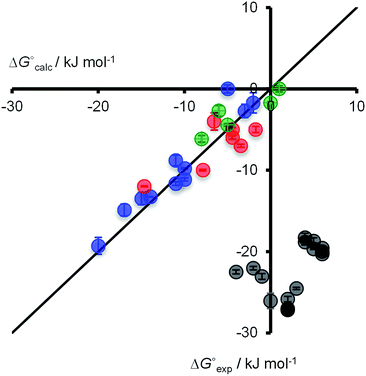 | ||
| Fig. 4 Comparison of experimental free energy changes on complexation (ΔG°exp) with the values calculated using eqn (1) (ΔG°calc) for H-bonded complexes (1·3 shown in blue and 1·4 in red) and X-bonded complexes (2·3 shown in green and 2·4 in grey). Experimental errors at the 95% confidence limit. The line represents ΔG°calc = ΔG°exp. | ||
The 2·3 X-bonded complex is the least stable of all four complexes studied. This complex is most stable in the least polar solvent, n-octane, and the stability decreases with solvent polarity, so that binding is too weak to measure in most solvents. In contrast, the 2·4 X-bonded complex is the most stable of the four complexes studied, and association constants could be measured in all fifteen solvents. The stability of this complex shows a remarkably different solvent-dependence from the other three complexes. The 2·4 association constant in the most polar solvent, methanol, decreases only 3-fold compared with the value determined in the least polar solvent, n-octane. This result was confirmed by measuring the stability of the 2·4 complex in different alcohols, ethanol and i-propanol, which gave very similar results to methanol.
The association constants for the 2·3 X-bonded complex show a similar solvent-dependence to the H-bonded complexes, which suggests that an effective value of α for molecular iodine can be estimated for 2 using eqn (1) (Fig. 4). A fit of the experimental data for the 2·3 complex to eqn (1) yields α = 2.8 (data in green). However, this value of α (or any other) fails to predict the properties of the 2·4 complex (Fig. 4, data in gray). The electrostatic solvent competition model illustrated in Fig. 1 is clearly not suitable for describing solvent effects on the stability of the 2·4 X-bonded complex.
An investigation of the interaction of solvent with 2 was carried out by measuring association constants for all 2·solvent complexes in n-octane. The association constants in all cases are small (Ka ≤ 2 ± 1 M−1, Table S2†) and showed no correlation with the stability of the 2·4 complex in these solvents. In addition, there is no correlation between the association constant for the 2·4 complex and bulk solvent properties (see Fig S78†). UV/vis absorption titrations carried out in mixtures of n-octane and 1,1,2,2-tetrachloroethane (TCE) show that ΔG°expt is a linear function of the concentration of TCE, and there is no evidence of preferential solvation of the 2·4 complex that would lead to stabilization of the complex in halogenated solvents (see Fig S77†).
The results in Table 1 and Fig. 4 indicate that the factors that govern the stability of the 2·4 X-bond are quite different from the other three complexes. For example, the association constants for the 1·4, 1·3 and 2·3 complexes are more than an order of magnitude lower in TCE than in n-octane, whereas the 2·4 complex is 6 times more stable in TCE than in n-octane. The UV/vis spectrum of the 2·4 complex is also different from the other three complexes in that there is a strong charge-transfer absorption band. The wavelength (330–340 nm) and extinction coefficient (30![[thin space (1/6-em)]](https://www.rsc.org/images/entities/char_2009.gif) 000–55
000–55![[thin space (1/6-em)]](https://www.rsc.org/images/entities/char_2009.gif) 000 M−1 cm−1) of this band are similar in all solvents where values could be measured (see ESI†). Crystal structures of complexes between molecular iodine and thiocarbonyl compounds exhibit geometries with short S⋯I distances (2.49–3.13 Å, RSI 0.66–0.83) and elongated I–I distances (2.75–3.15 Å, compared with 2.70 Å in molecular iodine).33,34 The S⋯I and I–I distances are inversely correlated (Fig. 5), indicating a significant charge transfer component to these interactions. Laurence has suggested that the degree to which a base can transfer electrons into the I–I σ* orbital is responsible for the extent of elongation of the I–I bond and has reported a correlation between the change in diiodine bond length in the solid state and solution-phase binding constants.34
000 M−1 cm−1) of this band are similar in all solvents where values could be measured (see ESI†). Crystal structures of complexes between molecular iodine and thiocarbonyl compounds exhibit geometries with short S⋯I distances (2.49–3.13 Å, RSI 0.66–0.83) and elongated I–I distances (2.75–3.15 Å, compared with 2.70 Å in molecular iodine).33,34 The S⋯I and I–I distances are inversely correlated (Fig. 5), indicating a significant charge transfer component to these interactions. Laurence has suggested that the degree to which a base can transfer electrons into the I–I σ* orbital is responsible for the extent of elongation of the I–I bond and has reported a correlation between the change in diiodine bond length in the solid state and solution-phase binding constants.34
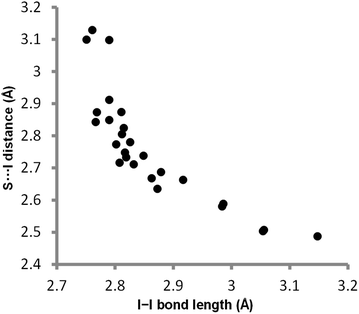 | ||
| Fig. 5 Plot of S⋯I distance versus I–I bond length in iodine–thiocarbonyl complexes in the Cambridge Structural Database (see Table S3 for details†). | ||
Conclusions
The X-bond formed between tetramethylthiourea (4) and molecular iodine (2) is stable in a wide range of different solvents. In contrast to H-bonds, which are very sensitive to solvent polarity, this X-bond is not disrupted even by polar alcohol solvents. The H-bonds formed by 4 to (4-phenylazo)phenol 1 and the X-bonds formed by molecular iodine to tetramethylurea 3 exhibited the expected sensitivity to solvent. These results indicate that the thermodynamic properties of X-bonds cannot be explained by simple electrostatic arguments or the solvent competition model in Fig. 1. We conclude that charge transfer interactions make a significant contribution to the stability of the 2·4 complex and that these interactions are remarkably insensitive to the nature of the solvent.The X-bonds formed by molecular iodine are significantly stronger than X-bonds formed by organic iodine compounds.23,24 However, if the unusual stability the 2·4 complex in polar solvents were a general feature of X-bonded complexes, it should be possible to find combinations of organic X-bond donor and acceptor that show high affinities in polar solvents. Indeed, thermodynamic studies of X-bonded complexes involving organic iodine compounds suggest that stability is not dictated by simple electrostatic considerations.23a,35–37 Such effects have implications for the application of these non-covalent interactions in water and may provide the opportunity to exploit X-bonding in drug design.
Acknowledgements
The EPSRC (grants EP/J012998/1 and EP/J012955/1) provided support for this work.Notes and references
- For a provisional IUPAC definition, under review, see http://www.iupac.org/home/publications/provisional-recommendations/published/published-container/definition-of-the-halogen-bond.html.
- P. Metrangolo, H. Neukirch, T. Pilati and G. Resnati, Acc. Chem. Res., 2005, 38, 386 CrossRef CAS PubMed.
- A. C. Legon, Phys. Chem. Chem. Phys., 2010, 12, 7736 RSC.
- F. Guthrie, J. Chem. Soc., 1863, 16, 239 RSC.
- L. Brammer, G. Mínguez Espallargas and S. Libri, CrystEngComm, 2008, 10, 1712 RSC.
- K. Rissanen, CrystEngComm, 2008, 10, 1107 RSC.
- (a) G. Mínguez Espallargas, L. Brammer and P. Sherwood, Angew. Chem., Int. Ed., 2006, 45, 435 CrossRef PubMed; (b) G. Mínguez Espallargas, F. Zordan, L. Arroyo Marín, H. Adams, K. Shankland, J. van de Streek and L. Brammer, Chem.–Eur. J., 2009, 15, 7554 CrossRef PubMed.
- (a) C. B. Aakeröy, M. Fasulo, N. Schultheiss, J. Desper and C. Moore, J. Am. Chem. Soc., 2007, 129, 13772 CrossRef PubMed; (b) C. B. Aakeröy, M. Baldrighi, J. Desper, P. Metrangolo and G. Resnati, Chem.–Eur. J., 2013, 19, 16240–16247 CrossRef PubMed.
- (a) J.-Y. Questel, C. Laurence and J. Graton, CrystEngComm, 2013, 15, 3212 RSC; (b) C. Perkins, S. Libri, H. Adams and L. Brammer, CrystEngComm, 2012, 14, 3033 RSC.
- A. W. Sun, J. W. Lauher and N. S. Goroff, Science, 2006, 312, 1030 CrossRef CAS PubMed.
- (a) P. Auffinger, F. A. Hays, E. Westhof and P. S. Ho, Proc. Nat. Acad. Sci., 2004, 101, 16789 CrossRef CAS PubMed; (b) E. Parisini, P. Metrangolo, T. Pilati, G. Resnati and G. Terraneo, Chem. Soc. Rev., 2011, 40, 2267 RSC.
- (a) Y. Lu, T. Shi, Y. Wang, H. Yang, X. Yan, X. Luo, H. Jiang and W. Zhu, J. Med. Chem., 2009, 52, 2854 CrossRef CAS PubMed; (b) R. Wilcken, X. Liu, M. O. Zimmermann, T. J. Rutherford, A. R. Fersht, A. C. Joerger and F. M. Boeckler, J. Am. Chem. Soc., 2012, 134, 6810 CrossRef CAS PubMed.
- (a) S. M. Walter, F. Kniep, E. Herdtweck and S. M. Huber, Angew. Chem., Int. Ed., 2011, 50, 7187 CrossRef CAS PubMed; (b) F. Kniep, S. H. Jungbauer, Q. Zhang, S. M. Walter, S. Schindler, I. Schnapperelle, E. Herdtweck and S. M. Huber, Angew. Chem., Int. Ed., 2013, 52, 7028 CrossRef CAS PubMed.
- (a) N. L. Kilah, M. D. Wise, C. J. Serpell, A. L. Thompson, N. G. White, K. E. Christensen and P. D. Beer, J. Am. Chem. Soc., 2010, 132, 11893 CrossRef CAS PubMed; (b) C. L. Gilday, T. Lang, A. Caballero, P. J. Costa, V. Felix and P. D. Beer, Angew. Chem., Int. Ed., 2013, 52, 4356 CrossRef PubMed.
- A. V. Jentzsch, A. Henning, J. Mareda and S. Matile, Acc. Chem. Res., 2013, 46, 2791 CrossRef PubMed.
- S. M. Walter, F. Kneip, L. Rout, F. P. Schmidtchen, E. Herdtweck and S. M. Huber, J. Am. Chem. Soc., 2012, 134, 8507 CrossRef CAS PubMed.
- (a) M. Fourmigué and P. Batail, Chem. Rev., 2004, 104, 5379 CrossRef PubMed; (b) H. M. Yamamoto, Y. Kosaka, R. Maeda, J. Yamaura, A. Nakao, T. Nakamura and R. Kato, ACS Nano, 2008, 2, 143 CrossRef CAS PubMed.
- T. Shirman, T. Arad and M. E. van der Boom, Angew. Chem., Int. Ed., 2010, 49, 926 CrossRef CAS PubMed.
- L. Meazza, J. A. Foster, K. Fucke, P. Metrangolo, G. Resnati and J. W. Steed, Nat. Chem., 2012, 5, 42 CrossRef PubMed.
- D. W. Bruce, P. Metrangolo, F. Meyer, T. Pilati, C. Präsang, G. Resnati, G. Terraneo, S. G. Wainwright and A. C. Whitwood, Chem.–Eur. J., 2010, 16, 9511 CrossRef CAS PubMed.
- (a) T. Clark, M. Hennemann, J. Murray and P. Politzer, J. Mol. Model., 2007, 13, 291 CrossRef CAS PubMed; (b) F. Zordan, L. Brammer and P. Sherwood, J. Am. Chem. Soc., 2005, 127, 5979 CrossRef CAS PubMed.
- (a) C. Laurence, J. Graton, M. Berthelot and M. El Ghomari, Chem.–Eur. J., 2011, 17, 10431 CrossRef CAS PubMed; (b) W. J. McKinney and A. I. Popov, J. Am. Chem. Soc., 1969, 91, 5215 CrossRef CAS.
- (a) R. Cabot and C. A. Hunter, Chem. Commun., 2009, 15, 2005 RSC; (b) T. M. Beale, M. G. Chudzinski, M. G. Sarwar and M. S. Taylor, Chem. Soc. Rev., 2013, 42, 1667 RSC.
- (a) T. Beweries, L. Brammer, N. A. Jasim, J. E. McGrady, R. N. Perutz and A. C. Whitwood, J. Am. Chem. Soc., 2011, 133, 14338 CrossRef CAS PubMed; (b) D. A. Smith, L. Brammer, C. A. Hunter and R. N. Perutz, J. Am. Chem. Soc., 2014, 136, 1288 CrossRef CAS PubMed.
- C. Laurence and J. F. Gal, Lewis Basicity and Affinity Scales, John Wiley & Sons, 2010, pp. 111–227 Search PubMed.
- C. A. Hunter, Angew. Chem., Int. Ed., 2004, 43, 5310 CrossRef CAS PubMed.
- C. S. Calero, J. Farwer, E. J. Gardiner, C. A. Hunter, M. Mackey, S. Scuderi, S. Thompson and J. G. Vinter, Phys. Chem. Chem. Phys., 2013, 15, 18262 RSC.
- J. L. Cook, C. A. Hunter, C. M. R. Low, A. Perez-Velasco and J. G. Vinter, Angew. Chem., Int. Ed., 2007, 46, 3706 CrossRef CAS PubMed.
- M. C. Aragoni, M. Arca, F. A. Devillanova, A. Garau, F. Isaia, V. Lippolis and G. Verani, Coord. Chem. Rev., 1999, 184, 271 CrossRef CAS.
- (a) R. P. Lang, J. Am. Chem. Soc., 1962, 84, 1185 CrossRef CAS; (b) C. C. Thompson and P. A. D. De Maine, J. Am. Chem. Soc., 1963, 85, 3096 CrossRef CAS; (c) K. R. Bhaskar, R. K. Gosavi and C. N. R. Rao, Trans. Faraday Soc., 1966, 62, 29 RSC; (d) A. Rogstad and E. Augdahl, Acta Chem. Scand., 1971, 25, 225 CrossRef CAS PubMed; (e) A.-G. El-Kourashy, Spectrochim. Acta, Part A, 1981, 6, 339 Search PubMed; (f) A. Suszka, J. Chem. Soc., Perkin Trans. 2, 1985, 531 RSC; (g) F. Bigoli, P. Deplano, M. L. Mercuri, M. A. Pellinghelli, A. Sabatini, E. F. Trogu and A. Vacca, J. Chem. Soc., Dalton Trans., 1996, 3583 RSC; (h) P. Deplano, J. R. Ferraro, M. L. Mercuri and E. F. Trogu, Coord. Chem. Rev., 1999, 188, 71 CrossRef CAS.
- R. A. Binstead, A. D. Zuberbühler and B. Jung, SpecFit/32 (V3.0.34), Spectrum Software Associates, 2003 Search PubMed.
- F. Bigoli, P. Deplano, A. Ienco, C. Mealli, M. L. Mercuri, M. A. Pellinghelli, G. Pintus, G. Saba and E. F. Trogu, Inorg. Chem., 1999, 38, 4626 CrossRef CAS PubMed.
- (a) See ESI† for list of crystal structures. RSI = d(S⋯I)/(rS + rI), where rS and rI are the van der Waals radii33b of sulfur and iodine, following the definition of Lommerse et al.33c; (b) A. Bondi, J. Phys. Chem., 1964, 68, 441 CrossRef CAS; (c) J. P. M. Lommerse, A. J. Stone, R. Taylor and F. H. Allen, J. Am. Chem. Soc., 1996, 118, 3108 CrossRef CAS.
- C. Ouvrard, J.-Y. Le Questel, M. Berthelot and C. Laurence, Acta Crystallogr., Sect. B: Struct. Sci., 2003, B59, 512 CrossRef CAS PubMed.
- M. G. Chudzinski and M. S. Taylor, J. Org. Chem., 2012, 77, 3483 CrossRef CAS PubMed.
- M. G. Sarwar, B. Dragisic, L. J. Salsberg, C. Gouliaras and M. S. Taylor, J. Am. Chem. Soc., 2010, 132, 1646 CrossRef CAS PubMed.
- L. J. McAllister, D. W. Bruce and P. B. Karadakov, J. Phys. Chem. A, 2012, 116, 10621 CrossRef CAS PubMed.
Footnote |
| † Electronic Supplementary Information (ESI) available: Titration methods and data. See DOI: 10.1039/c4sc01746c |
| This journal is © The Royal Society of Chemistry 2014 |
