 Open Access Article
Ferroelectric hexagonal and rhombic monolayer ice phases†
Wen-Hui
Zhao
a,
Jaeil
Bai
b,
Lan-Feng
Yuan
*a,
Jinlong
Yang
a and
Xiao Cheng
Zeng
*b
aDepartment of Chemical Physics, Hefei National Laboratory for Physical Sciences at Microscale, University of Science and Technology of China, Hefei, Anhui 230026, China. E-mail: yuanlf@ustc.edu.cn
bDepartment of Chemistry and Nebraska Center for Materials and Nanoscience, University of Nebraska-Lincoln, Lincoln, Nebraska 68588, USA. E-mail: xzeng1@unl.edu
First published on 7th January 2014
Abstract
Two new phases of water, the mid-density hexagonal monolayer ice and the high-density flat rhombic monolayer ice, are observed in our molecular dynamics simulations of monolayer water confined between two smooth hydrophobic walls. These are in addition to the two monolayer ices reported previously, namely, the low-density 4·82 monolayer ice and the high-density puckered rhombic monolayer ice (HD-pRMI). Stabilities of the structures are confirmed by ab initio computation. Importantly, both new phases and the HD-pRMI are predicted to be ferroelectric. An in-plane external electric field can further stabilize these ferroelectric monolayer ices.
Introduction
The phase behavior of water is a topic of perpetual interest due to its intriguing properties and important implications to biological sciences, geoscience, nanoscience, etc. Since a water molecule has permanent dipole moment, an especially interesting research topic is the quest for ferroelectric ice structures. Among at least fifteen crystalline polymorphs of bulk ice, only one, i.e., ice XI, is ferroelectric with proton-ordered arrangement, and it can only be produced in the laboratory through quenching a dilute KOH solution. Adsorbed ices are more likely to become ferroelectric. For example, thin ice films deposited on a platinum surface, with ∼30 layers of water molecules, exhibit ferroelectric alignment.1,2The highly confined environment disrupts the hydrogen bonding network in bulk water, leading to a variety of one-dimensional (1D) and two-dimensional (2D) structures. A number of theoretical3–8 and experimental9–13 studies have shown that water confined in carbon nanotubes (CNTs) can form ice nanotubes (ice-NTs). Moreover, molecular dynamics (MD) simulations reveal that the ice-NTs with an odd number of sides can be ferroelectric.14 Recently, a 1D ferroelectric water wire within a supramolecular architecture was observed in experiments and simulations.15 In 2D, about a dozen ice polymorphs have been predicted via simulations or observed in experiments, including trilayer hexagonal and rhombic ices,16 bilayer hexagonal, rhombic, amorphous, very-high-density amorphous, and quasi-crystalline ices,17–24 and the monolayer Archimedean 4·82 truncated square tiling,25,26 rhombic26–29 and flat hexagonal30 ices. However, regarding ferroelectricity in 2D ices, the most relevant report is a “probably ferroelectric” monolayer ice formed epitaxially on mica and observed via atomic force microscopy (AFM).31 To date, a definite report of ferroelectric 2D ice is still lacking.
In this paper, we report two new monolayer ices via MD simulations, namely, a mid-density hexagonal monolayer ice (MD-HMI) and a high-density flat rhombic monolayer ice (HD-fRMI). Also studied are two known monolayer ices, namely, the low-density 4·82 monolayer ice (LD-48MI)26 and the HD-pRMI.26–29 The three phases of MD-HMI, HD-fRMI and HD-pRMI are observed to show spontaneous polarization and ferroelectric hysteresis, therefore, we validate them as 2D ferroelectric ices.
Methods
The simulation system consists of 400 water molecules confined between two hydrophobic planar walls. The wall separation D is set within the range of 0.51 to 0.65 nm, in which only one layer of water can be accommodated. The TIP5P potential32 is used to describe water–water interaction, as used previously by Zangi and Mark16 to simulate electrofreezing of a water slab under an in-plane electric field (5 V nm−1) and by Qiu and Guo33 to study the electromelting of confined monolayer ice. The water–wall interactions are described by the Lennard-Jones (L-J) 9-3 potential function with the parameters σo–wl = 0.25 nm and εo–wl = 1.25 kJ mol−1 (following ref. 20 and 28), namely, the integral of the L-J 12-6 potential for a structureless wall. This is because our previous study demonstrates that the formation of LD-48MI is insensitive to the atomic structure of the wall surface by using two structureless walls and two single graphene layers,26 and our new MD simulations reinforce this point (see Fig. S1† in ESI for detail). All the MD simulations are performed in the constant lateral pressure (PL) and constant temperature (T) ensemble with periodic boundary conditions in the lateral directions (x and y), using the GROMACS 4.5 package.34 Temperature and pressure are controlled by the Nosé–Hoover thermostat35 and Parrinello–Rahman barostat,36 respectively. A cutoff of 1 nm is used for the LJ interactions, and the long-range electrostatic interactions are treated by the slab-adapted Ewald sum method.37Results and discussion
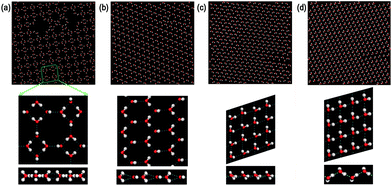
First, we performed molecular dynamics simulations for a given D = 0.557 nm, a value used in previous molecular dynamics simulations of monolayer water but with a switching function to cut off all interaction at 0.875 nm.26,29 The confined water was cooled from 320 K to 210 K at PL = 1 MPa in a step of 10 K. At each temperature, the simulation lasted 20 ns. Then the system was equilibrated at 200 K and PL = −50 MPa for 60 ns. A monolayer crystalline structure consisting of tetragons and octagons (with some voids) formed spontaneously, which is LD-48MI (with some voids). Fig. 1a displays its inherent structure (obtained by applying the steepest-descent method to the final configuration of the system18).Taking the LD-48MI at D = 0.557 nm as the initial configuration, thirteen additional independent simulations were performed for D = 0.51, 0.52, 0.53, 0.54, 0.55, 0.57, 0.58, 0.59, 0.6, 0.62, 0.63, 0.64, and 0.65 nm, all at PL = −50 MPa and T = 200 K. The LD-48MI structure is still intact in most cases except for at D = 0.64 and 0.65 nm, at which the LD-48MI melts into a monolayer liquid (MLiq). Next, for all fourteen D values, we compressed isothermally the monolayer water stepwise from −50 to 800 MPa, scanning through 11–14 state points of PL (20 ns for each state point). In these sequential simulations, three other monolayer crystalline phases were attained, including the two new structures MD-HMI (Fig. 1b) and HD-fRMI (Fig. 1c), and the known structure HD-pRMI (Fig. 1d). Structural features and properties of these monolayer ices are discussed below.
Fig. 2 shows the area density ρ of monolayer water as PL increases for various given D at 200 K. Based on the number of phase transitions in every isotherm, the change in ρ and the corresponding phase behavior can be classified into three types for three ranges of D: (1) for 0.51 nm ≤ D ≤ 0.58 nm, three phase transitions take place in sequence. As PL increases from −50 MPa to 50–100 MPa, the LD-48MI transforms into the mid-density hexagonal monolayer ice, i.e. MD-HMI (Fig. 1b). The transition from LD-48MI to MD-HMI exhibits the Oswald staging phenomenon, namely, an unstable intermediate liquid state during the solid-to-solid transition (Movie S1†). Interestingly, a stable monolayer liquid (MLiq) can also be observed by increasing the PL to 300–400 MPa. The lateral diffusion constant of MLiq is DL ≈ 6 × 10⁻⁶ cm2 s−1, which is about 30% of the diffusion constant of bulk water under ambient conditions (2.2 × 10⁻⁵ cm2 s−1), but much greater than those of the four monolayer solids (LD-48MI, DL ≈ 1 × 10⁻⁸ cm2 s−1; MD-HMI, DL ≈ 7 × 10⁻⁸ cm2 s−1; HD-fRMI, DL ≈ 1 × 10⁻⁷ cm2 s−1; and HD-pRMI, DL ≈ 1 × 10⁻⁹ cm2 s−1). As PL reaches 500–600 MPa, the MLiq freezes into one of the two rhombic structures: either HD-fRMI (Fig. 1c) for 0.51 nm ≤ D ≤ 0.57 nm or HD-pRMI (Fig. 1d) for D = 0.58 nm. Also, importantly, the pressure range in which MD-HMI is stable shrinks with the increase of D. For D = 0.58 nm, MD-HMI appears only in the pressure range of 60 MPa ≤ PL ≤ 90 MPa (we examine more pressure states for this case). In a wider nanoslit (D ≥ 0.59 nm), the MD-HMI is no longer stable.
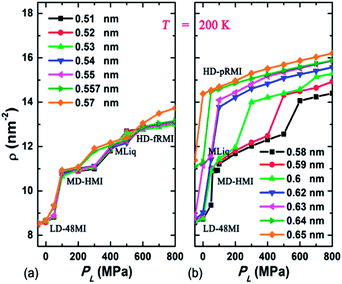 | ||
| Fig. 2 The area density ρ of monolayer water versus the lateral pressure PL for various given D at 200 K. | ||
(2) For 0.59 nm ≤ D ≤ 0.63 nm, two phase transitions take place in sequence as PL increases, namely, from LD-48MI to MLiq and then to HD-pRMI. Compared to (1), the MD-HMI phase is bypassed. (3) For 0.64 nm ≤ D ≤ 0.65 nm, only one phase transition takes place as PL increases. Here, the state below PL = −50 MPa is MLiq rather than LD-48MI. As PL increases, the MLiq crystallizes into HD-pRMI.
An approximate PL–D phase diagram of monolayer water (under zero external electric field) is plotted based on results of the MD simulations (Fig. 3a). We use the two-phase coexistence simulation method with the NPLT ensemble to determine the phase boundaries (see ESI†). More accurate phase boundaries can be achieved via the multibaric-multithermal ensemble approach that involves an anisotropic pressure control.38 A conspicuous feature is that a MLiq domain fully separates two solid phases. On the left side of the MLiq domain, the MD-HMI phase arises in the higher PL region; while on the right side of the MLiq domain, the HD-pRMI phase arises in the larger D region. There exist two triple points: one for LD-48MI, MLiq, and MD-HMI, and the other for HD-fRMI, MLiq, and HD-pRMI.
In the inherent structure of LD-48MI (Fig. 1a), it can be seen that the molecular plane of each water molecule is perpendicular to the molecular plane of its nearest-neighbor molecules. Each water molecule has three nearest-neighbors, but entails four hydrogen bonds; namely, LD-48MI satisfies the ice rule. This is because the molecule whose molecular plane is perpendicular to the two walls acts as a “double donor to a single acceptor”, i.e., its two O–H arms are obliquely oriented towards one O atom in its nearest-neighbor in-plane water molecule, forming two weak hydrogen bonds. Meanwhile, as a “double acceptor of double donors”, this molecule forms two strong hydrogen bonds with its two other nearest-neighbor molecules. An in-plane water molecule entails two strong and two weak hydrogen bonds as well, but as a “double donor to double acceptors” and a “double acceptor of a single donor”. In a plot of the distribution of O–H⋯O angles of hydrogen bonds (Fig. 4a), the two peaks around 164° and 115° (for D ≤ 0.55 nm) correspond to the strong and weak hydrogen bonds, respectively. With the increase of D, the libration of the two O–H bonds involved in the weak hydrogen bonds with the same O atom becomes stronger. Thus, the peak around 115° is lowered and gradually becomes a shoulder peak.
 | ||
| Fig. 4 Hydrogen-bond angle distributions at T = 200 K for (a) LD-48MI at PL = −50 MPa, (b) MD-HMI at PL = 100 MPa, and (c) HD-fRMI and HD-pRMI at PL = 800 MPa, respectively. | ||
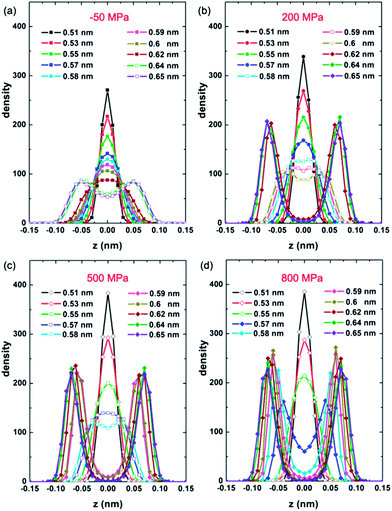
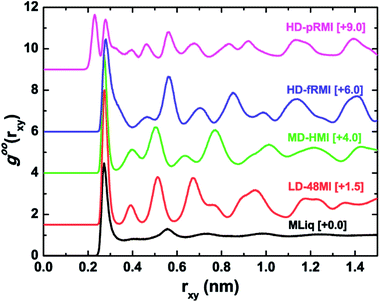
The density distribution of oxygen atoms in the z direction (normal to the walls), i.e. the transverse density profile of LD-48MI (PL = −50 MPa, for 0.51 nm ≤ D ≤ 0.63 nm), is unimodal, as shown in Fig. 5a. As a measure of the planarity of monolayer ices, the width of the unimodal peak is less than 0.05 nm. This width increases with D, and as D reaches 0.64 nm, the distribution becomes bimodal, corresponding to the MLiq. As shown by the lateral oxygen–oxygen radial distribution function (RDF) goo(rxy) in Fig. 6, the nearest neighbor O–O distance in LD-48MI is 0.28 nm, close to the nearest neighbor distance for the bulk water. The second peak is at 0.39 nm, corresponding to the diagonal distance of a tetragon (√2 × 0.28 nm). The third peak is at 0.51 nm, corresponding to the distance between a molecule and its second nearest-neighbor in an octagon (2 × sin(135°/2) × 0.28 nm). Because each molecule has a para-position in a tetragon and two meta-positions in an octagon, the height of the third peak is about twice of that of the second peak. The position and height of the following peaks can be also understood based on the Archimedean 4·82 truncated square tiling.
Second, we focus on the new monolayer ice structure MD-HMI. Like LD-48MI, every water molecule in MD-HMI also has three nearest-neighbors, and the plane of each water molecule is also perpendicular to those of its three nearest-neighbor molecules (Fig. 1b). Interestingly, the hexagonal framework still meets the ice rule in the same fashion as LD-48MI, i.e., every molecule acts as either a “double donor to a single acceptor” or as a “double acceptor of a single donor”, forming two weak and two strong hydrogen bonds (with O–H⋯O angles around 106° and 164° as shown in Fig. 4b).
Despite many similarities in the hydrogen bonding networks of MD-HMI and LD-48MI, there is a fundamental distinction on their global polarizations. In LD-48MI, the dipole moments of water molecules offset one another, resulting in zero total dipole. On the other hand, the dipole vectors of all the molecules in MD-HMI are all parallel to the longest diagonal of a hexagon, i.e., MD-HMI exhibits spontaneous polarization. For D = 0.52 nm, its polarization is 15 μC cm−2. A strong hysteresis loop for the MD-HMI is also observed from additional MD simulations, confirming the MD-HMI as being ferroelectric (Fig. 7a).
 | ||
| Fig. 7 Hysteresis loops of polarization, Px, per water molecule for MD-HMI, HD-fRMI, and HD-pRMI. The electric field E was applied along the x axis. The closed squares are the initial polarization. The green line (2.29 D) denotes the permanent electric dipole moment of TIP5P water.32 | ||
We also performed ab initio computation using the CASTEP program39 to test the stabilities and polarization of the monolayer ices (see ESI† for more detail). As shown in Fig. 8, a monolayer ice confined between two graphene monolayers with a separation of D′ = 0.47 nm is identical to the MD-HMI, whose polarization is 20 μC cm−2, whereas a free-standing LD-48MI is stable with the same structural features as observed from our classical MD simulations, and its polarization is 0.
As Fig. 5b shows, the transverse density profile of the MD-HMI (at PL = 200 MPa) is also characterized by a Gaussian-like distribution with a width <0.05 nm, and this width also increases with D. For D = 0.58 nm, the MD-HMI melts into MLiq, and the density distribution starts to develop two peaks, while the value of the density profile at z = 0 (the central plane parallel to the two walls) is still significant. For D = 0.62 nm, the value at z = 0 drops to almost zero, reflecting a phase transition from MLiq to HD-pRMI. The first peak in the lateral O–O RDF of the MD-HMI is at ∼0.27 nm (Fig. 6), a value again close to that of the nearest-neighbor distance in bulk water.
Third, we turn our attention to the two high-density monolayer ices HD-fRMI and HD-pRMI. As shown in Fig. 1c and d, both HD-fRMI and HD-pRMI are composed of rhombic rings. The primary structural distinction between them can be seen from the side view shown in Fig. 1c and d: the oxygen atoms of the HD-fRMI are essentially in the same plane parallel to the walls, while those of the HD-pRMI are in alternate ridges with different z coordinates. As shown in Fig. 5c and d, the transverse density profile of the HD-fRMI is unimodal, while that of the HD-pRMI is bimodal, which is why we name this ice as “puckered”. Still, one may wonder whether both ice structures belong to the same phase. To address this question, we carried out an additional 32 independent molecular dynamics simulations at PL = 800 MPa and T = 200 K for increasing D stepwise from 0.55 nm (HD-fRMI) to 0.58 nm (HD-pRMI) and then for the reverse (decreasing D) process. As shown in Fig. 9, when D increases, the potential energy U first slowly decreases and then drops steeply by about 1.5 kJ mol−1 for D from 0.570 nm to 0.574 nm. Meanwhile, the area density ρ first increases gradually, and then jumps up by about 0.8 nm−2. Upon decreasing D, U and ρ also show abrupt changes in the reverse process, but with a clear hysteresis. So we conclude that the HD-fRMI is a new phase different from the HD-pRMI, and the transition between the two phases is first-order upon changing D.
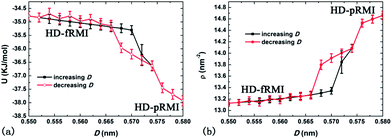 | ||
| Fig. 9 The potential energy U (a) and area density ρ (b) at PL = 800 MPa and T = 200 K with increasing D first, followed by the decreasing D process. | ||
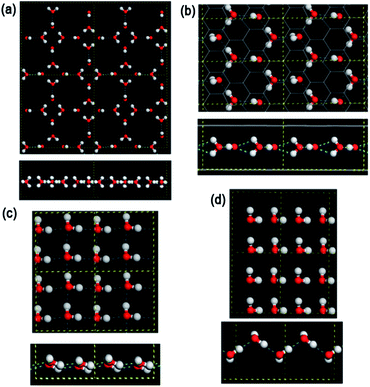
Why is such a transition first order? To answer the question, we analyze the hydrogen-bonding networks of the two high-density ice phases. Note that the coordination number of every water molecule in the HD-fRMI and HD-pRMI is four, as opposed to three in the LD-48MI and MD-HMI. As such, it seems that water molecules can meet the ice rule more easily without invoking the “double donor to a single acceptor” mechanism. Nevertheless, another issue arises: the O–H⋯O angles of the hydrogen bonds, i.e., where the H atoms between the two O atoms of neighboring molecules are located. Normally, the strength of a hydrogen bond increases with its O–H⋯O angle, and a linear hydrogen bond would be the most ideal. The HD-fRMI can make a stable hydrogen-bonding network by arranging all atoms of every water molecule in the same plane and the two H atoms of each molecule roughly in two lines connecting with its own O atom and with its two neighbor O atoms, respectively (we call this arrangement as “all-atom planar structure”). As the H–O–H bond angle of water molecules (104.5°) is close to the inner rhombus angle of HD-fRMI (108°), all the O–H⋯O angles would be close to 180°. However, analysis of the electronic structure indicates that this all-atom planar arrangement is unfavorable. The O atom in water molecule is sp3 hybridized, and its four molecular-orbital lobes yield two covalent bonds and two lone electron pairs. When forming hydrogen bonds, the two lone pairs of the O atom act as H acceptor. As such, the two O–H covalent bonds and associated two O⋯H vectors of the hydrogen bonds tend to point to the four vertexes of a tetrahedron centered from the O atom. If the hydrogen bonds are in the same plane as the covalent bonds, they would cause too large an energy penalty. Our ab initio density-functional calculations indeed show that the all-atom planar structure is unstable.
An ideal hydrogen-bonding network of water should satisfy the three requirements simultaneously: (1) four hydrogen bonds for every water molecule, (2) tetrahedral orientation for the four hydrogen bonds, as well as (3) nearly linear hydrogen bonds. Ice structures with the coordination number of three cannot meet the first and the third requirement at the same time. Hence, both LD-48MI and MD-HMI favor the first and the second requirements while compromise on the third requirement, resulting in two nearly linear and two bent hydrogen bonds for each water molecule.
In the HD-fRMI, the geometric constraints to meet the three requirements are even stronger. Suppose there are three O atoms in a linear row (O0, O1, and O2 where O1 is between O0 and O2) with distance being ∼0.28 nm between O1 and its two neighbour O atoms, forming a linear hydrogen bond O0–H1–O1 (ESI Fig. S3†). Under the requirement of tetrahedral orientation, we now consider the geometry of the other hydrogen bond O1–H2–O2. Since the H1O1H2 angle is ∼109.5°, the H2O1O2 angle must be ∼70.5°. The distance from O2 to the line O1H2 is ∼0.28 nm × sin(70.5°) = 0.26 nm. This value is much larger than the O–H bond length of a water molecule (∼0.096 nm), therefore H2 cannot make a covalent bond with O2. In other words, O1 must be the proton-donor. So the O1H2 length is ∼0.096 nm, the O2H2 length is ∼0.263 nm, and the O1H2O2 angle is ∼88°. However, the latter two values do not satisfy the definition of normal hydrogen bonding. Therefore, we can draw a rather general conclusion that linear hydrogen bonds are highly unlikely to exist within a linear row of O atoms.
In the LD-48MI and MD-HMI, there is no such a linear row, and the angle between two linear hydrogen bonds of an O atom is around 90°. In the HD-fRMI, however, every nearest neighbor O–O pair is in a linear row, so there is no room for a single linear hydrogen bond. In other words, the hydrogen bonding in the HD-fRMI is highly frustrated. This behavior is reflected in the broad and featureless distribution of hydrogen bond angles (Fig. 4c): most O–H⋯O angles are in the range from 120° to 150°. In the HD-pRMI, the ridges are still linear rows, but the O atoms aligned in the direction normal to the ridges form zigzag lines instead of linear rows. Therefore, a half number of hydrogen bonds between nearest-neighboring ridges can be nearly linear (and they are indeed so), leading to notable energy drop (Fig. 9a), while the other half number of hydrogen bonds along the ridges are still frustrated. The latter feature can be seen from the snapshot (Fig. 1d) and the hydrogen-bond angle distribution (Fig. 4c), which shows two peaks around 169° and 138°. This is the reason for the first-order transition between the two rhombic monolayer ices.
Besides the TIP5P model, we have also examined several other three-site and four-site water models (SPC,40 SPC/E,41 TIP3P,42 TIP4P43 and TIP4P/200544). Additional simulations show that all these models give rise to the all-atom planar structure. Our analysis above and results of ab initio calculations demonstrate that the frustrated HD-fRMI structure is more sensible, whereas the all-atom planar structure appears to be unphysical. The key difference between the TIP5P and other models considered may lie in their representation to the electronic structure of O atoms. The TIP5P model entails two negative charge centers in the directions of the two lone pairs, thus mimicking the sp3 hybridization. Other three-site and four-site models lack the similar feature, and therefore the planar arrangement of four H atoms around an O atom results in no energy penalty. This might be a reason why previous simulations on this system did not yield the new structures presented here. One may question why other models can still predict the tetrahedral structure of bulk ice, even though they incur no energy penalty for the flat geometry. An answer is that for the study of bulk ice, the tetrahedral ice is compared with an imaginary structure of all-atom planar layers with no hydrogen bonding between them. Both structures have the same number of near-linear hydrogen bonds (4 per molecule), so the imaginary structure has no advantage in stability. Thus, even without invoking the energy penalty, the tetrahedral ice still wins out because it is more closely packed than the imaginary structure. However, under the highly confined environment such as in the case of the monolayer water, the all-atom planar structure gains a huge advantage in stability over the tetrahedral orientation due to the greater number of near-linear hydrogen bonds (4 versus 0). Hence, overlooking the energy penalty in the water model would inevitably lead to the all-atom planar structure. In other words, to capture correct physical chemistry in low-dimensional water and ice, inclusion of the sp3 feature into the water model is fundamentally important.
As shown in Fig. 1c, water molecules in HD-fRMI exhibit two distinct orientations, both tilted to the walls. The orientation of each molecule is different from that of its four neighbors, rendering the 2D network chessboard-like. Nevertheless, the molecular dipoles with the two orientations result in a net total dipole parallel to the longer diagonal of a rhombus. In HD-pRMI, again there are two orientations, while the molecules with the same height have the same orientation. The two orientations are also tilted, and also result in a net total dipole parallel to the longer diagonal of a rhombus. Their polarizations are 18 μC cm−2 (HD-fRMI, D = 0.52 nm) and 19 μC cm−2 (HD-pRMI, D = 0.59 nm) and the corresponding ab initio values are 22 μC cm−2 (D′ = 0.52 nm) and 23 μC cm−2 (D′ = 0.59 nm), respectively (Fig. 8). The ferroelectricities of HD-fRMI and HD-pRMI are also confirmed by the strong ferroelectric hysteresis loops (Fig. 7b and c). Also, importantly, the “probably ferroelectric” monolayer ice upon an exposed mica surface observed by Spagnoli et al.31 using atomic force microscopy, which appears to exist in a puckered film arrangement, and is consistent with this HD-pRMI.
To study effect of an in-plane electric field on the phase behavior of monolayer water, we perform the same series of simulations for the system subject to a lateral electric field with strength EL = 0.01, 0.1, 0.4, 1, and 10 V nm−1, respectively. These values are comparable to those experienced by water within the crevices of polar crystals,45 from the surfaces of biopolymers46,47 or nanoelectrodes.48Fig. 3b–f show the PL–D phase diagrams with different EL, or 2D cross-sections of the 3D PL–D–EL phase diagram. The corresponding raw data are given in Fig. S4 as the ρ–PL curves.†
For EL = 0.01 V nm−1, the topology of the phase domains is the same as that in Fig. 3a, but the phase boundaries are relocated. For EL = 0.1 V nm−1, the phase boundaries are moved further away. A qualitative change occurs for EL = 0.4 V nm−1: the domain of MLiq becomes an “island-like” region, and can no longer separate the two solid-phase regions. For D ≤ 0.557 nm or D ≥ 0.59 nm, MD-HMI can directly transform into either HD-fRMI or HD-pRMI (movies S2 and S3†). The domain of LD-48MI is now fully separated from the MLiq phase by MD-HMI. For EL = 1 V nm−1, both MLiq and LD-48 ML domains disappear, and only the three ferroelectric phases remain. At EL = 10 V nm−1, only the two high-density rhombic phases survive. Obviously, the reason for these behaviors is that the polarization energy under electric field stabilizes the ferroelectric phases.
For given D and EL, increasing PL favors phases with higher area density ρ. The order of ρ (LD-48MI < MD-HMI < MLiq < HD-fRMI < HD-pRMI) is indeed a general sequence of phases in the PL direction. Moreover, the area density of the monolayer structure is positively correlated with its coordination number (NC). The NC is 3 for LD-48MI and MD-HMI, 4 for HD-fRMI and HD-pRMI, and about 3.5 for MLiq. Hence, the two solids with NC = 3 arise at a low pressure region and are next to one another, while the two solids with NC = 4 arise at a high pressure region and are next to one another. The MLiq separates the two groups. Because the difference in ρ between HD-fRMI and HD-pRMI is very small, the phase boundary line between them is quite flat.
Among the five 2D phases, three are flat (LD-48MI, MD-HMI, and HD-fRMI), and two are nonplanar (MLiq and HD-pRMI). When increasing D while fixing PL and EL, each phase would rearrange its structure to lower its free energy, and the nonplanar phases have more flexibility than the planar phases in the structural relaxation. Hence, the domain of HD-pRMI is above that of HD-fRMI. Moreover, since both LD-48MI and MD-HMI are relatively less sensitive to change in D, their boundary is nearly vertical. Because MLiq is nonplanar, increasing D would widen its domain in both directions of PL. Therefore, the slopes of the (MD-HMI)-MLiq and MLiq-(HD-fRMI) boundaries are negative and positive, respectively. In the two nonplanar phases, HD-pRMI is more favorable with increasing D due to its long-range ordering, so the slope of the phase boundary is negative. Thus, the MLiq-(HD-fRMI)-(HD-pRMI) triple point is the turning point of the two liquid–solid lines.
Conclusions
In conclusion, four monolayer ice phases, including two new ones, are predicted based on molecular dynamics simulations. Moreover, both new phases (MD-HMI and HD-fRMI) and the HD-pRMI are predicted to be ferroelectric. The latter appears to be relevant to the prediction of “probable ferroelectricity” from experiment.31 Stabilities and ferroelectricities of the 2D monolayer ices are supported by the ab initio density-functional theory calculations, as well as by the strong tendency of satisfying the ice rule in a monolayer of water. Both evidences suggest that the existence of 2D ferroelectric ices is highly plausible and thus warrants future experimental confirmation and more simulations with improved water models (e.g. WAIL water model49). Finally, we find that an in-plane external electric field can stabilize the ferroelectric phases and eliminate the nonpolarized phases. In contrast, a perpendicular external electric field can melt the monolayer ice.33 Thus, an external electric field may be useful to modify phase behavior of confined water.Acknowledgements
This work is supported by MOST (2011CB921400), by NSFC (20603032, 20733004, 91021004, 20933006, 21121003, 2123307), by the Fundamental Research Funds for the Central Universities (WK2340000006, WK2060140005, WK2060030012), by CAS (XDB01020300), and by USTCSCC. JB is supported by a grant from UNL Research Council. XCZ is supported by grants from the NSF (CBET-1066947, CHE-1306326), ARL (W911NF1020099), the Nebraska Research Initiative, and a grant from USTC for (1000plan) Qianren-B summer research.Notes and references
- X. Su, L. Lianos, Y. R. Shen and G. A. Somorjai, Phys. Rev. Lett., 1998, 80, 1533 CrossRef CAS.
- M. J. Iedema, M. J. Dresser, D. L. Doering, J. B. Rowland, W. P. Hess, A. A. Tsekouras and J. P. Cowin, J. Phys. Chem. B, 1998, 102, 9203 CrossRef CAS.
- K. Koga, G. T. Gao, H. Tanaka and X. C. Zeng, Nature, 2001, 412, 802 CrossRef CAS PubMed.
- R. J. Mashl, S. Joseph, N. R. Aluru and E. Jakobsson, Nano Lett., 2003, 3, 589 CrossRef CAS.
- J. Bai, C.-R. Su, R. D. Parra, X. C. Zeng, H. Tanaka, K. Koga and J.-M. Li, J. Chem. Phys., 2003, 118, 3913 CrossRef CAS PubMed.
- J. Bai, J. Wang and X. C. Zeng, Proc. Natl. Acad. Sci. U. S. A., 2006, 103, 19664 CrossRef CAS PubMed.
- D. Takaiwa, I. Hatano, K. Koga and H. Tanaka, Proc. Natl. Acad. Sci. U. S. A., 2008, 105, 39 CrossRef CAS PubMed.
- R. M. Kumar, M. Elango, R. Parthasarathi and V. Subramanian, J. Phys. Chem. A, 2011, 115, 12841 CrossRef CAS PubMed.
- Y. Maniwa, H. Kataura, M. Abe, S. Suzuki, Y. Achiba, H. Kira and K. Matsuda, J. Phys. Soc. Jpn., 2002, 71, 2863 CrossRef CAS.
- Y. Maniwa, H. Kataura, M. Abe, A. Udaka, S. Suzuki, Y. Achiba, H. Kira, K. Matsuda, H. Kadowaki and Y. Okabe, Chem. Phys. Lett., 2005, 401, 534 CrossRef CAS PubMed.
- S. Ghosh, K. V. Ramanathan and A. K. Sood, Europhys. Lett., 2004, 65, 678 CrossRef CAS.
- A. I. Kolesnikov, J. M. Zanotti, C. K. Loong, P. Thiyagarajan, A. P. Moravsky, R. O. Loutfy and C. J. Burnham, Phys. Rev. Lett., 2004, 93, 035503 CrossRef.
- O. Byl, J. C. Liu, Y. Wang, W. L. Yim, J. K. Johnson and J. T. Yates, J. Am. Chem. Soc., 2006, 128, 12090 CrossRef CAS PubMed.
- C. Luo, W. Fa, J. Zhou, J. Dong and X. C. Zeng, Nano Lett., 2008, 8, 2607 CrossRef CAS PubMed.
- H.-X. Zhao, X.-J. Kong, H. Li, Y.-C. Jin, L.-S. Long, X. C. Zeng, R.-B. Huang and L.-S. Zheng, Proc. Natl. Acad. Sci. U. S. A., 2011, 108, 3481 CrossRef CAS PubMed.
- R. Zangi and A. E. Mark, J. Chem. Phys., 2004, 120, 7123 CrossRef CAS PubMed.
- K. Koga, X. C. Zeng and H. Tanaka, Phys. Rev. Lett., 1997, 79, 5262 CrossRef CAS.
- K. Koga, H. Tanaka and X. C. Zeng, Nature, 2000, 408, 564 CrossRef CAS PubMed.
- R. Zangi and A. E. Mark, J. Chem. Phys., 2003, 119, 1694 CrossRef CAS PubMed.
- S. Han, M. Y. Choi, P. Kumar and H. E. Stanley, Nat. Phys., 2010, 6, 685 CrossRef CAS.
- J. C. Johnston, N. Kastelowitz and V. Molinero, J. Chem. Phys., 2010, 133, 154516 CrossRef PubMed.
- J. Bai and X. C. Zeng, Proc. Natl. Acad. Sci. U. S. A., 2012, 109, 21240 CrossRef CAS PubMed.
- N. Giovambattista, P. J. Rossky and P. G. Debenedetti, Phys. Rev. Lett., 2009, 102, 050603 CrossRef.
- G. A. Kimmel, J. Matthiesen, M. Baer, C. J. Mundy, N. G. Petrik, R. S. Smith, Z. Dohnalek and B. D. Kay, J. Am. Chem. Soc., 2009, 131, 12838 CrossRef CAS PubMed.
- J. Yang, S. Meng, L. F. Xu and E. G. Wang, Phys. Rev. Lett., 2004, 92, 146102 CrossRef.
- J. Bai, C. A. Angell and X. C. Zeng, Proc. Natl. Acad. Sci. U. S. A., 2010, 107, 5718 CrossRef PubMed.
- R. Zangi and A. E. Mark, Phys. Rev. Lett., 2003, 91, 025502 CrossRef.
- P. Kumar, S. V. Buldyrev, F. W. Starr, N. Giovambattista and H. E. Stanley, Phys. Rev. E: Stat., Nonlinear, Soft Matter Phys., 2005, 72, 051503 CrossRef.
- K. Koga and H. Tanaka, J. Chem. Phys., 2005, 122, 104711 CrossRef PubMed.
- A. L. Ferguson, N. Giovambattista, P. J. Rossky, A. Z. Panagiotopoulos and P. G. Debenedetti, J. Chem. Phys., 2012, 137, 144501 CrossRef PubMed.
- C. Spagnoli, K. Loos, A. Ulman and M. K. Cowman, J. Am. Chem. Soc., 2003, 125, 7124 CrossRef CAS PubMed.
- M. W. Mahoney and W. L. Jorgensen, J. Chem. Phys., 2000, 112, 8910 CrossRef CAS PubMed.
- H. Qiu and W. Guo, Phys. Rev. Lett., 2013, 110, 195701 CrossRef.
- B. Hess, C. Kutzner, D. van der Spoel and E. Lindahl, J. Chem. Theory Comput., 2008, 4, 435 CrossRef CAS.
- S. Nosé and M. L. Klein, Mol. Phys., 1983, 50, 1055 CrossRef; W. G. Hoover, Phys. Rev. A, 1985, 31, 1695 CrossRef.
- M. Parrinello and A. Rahman, J. Appl. Phys., 1981, 52, 7182 CrossRef CAS PubMed.
- I. C. Yeh and M. L. Berkowitz, J. Chem. Phys., 1999, 111, 3155 CrossRef CAS PubMed.
- T. Kaneko, J. Bai, K. Yasuoka, A. Mitsutake and X. C. Zeng, J. Chem. Theory Comput., 2013, 9, 3299 CrossRef CAS.
- The CASTEP software code is distributed and maintained by Accelyrs Inc..
- H. J. C. Berendsen, J. P. M. Postma, W. F. van Gunsteren, and J. Hermans, in Intermolecular Forces, ed. B. Pullman, Reidel, Dordrecht, Holland, 1981, p. 331 Search PubMed.
- H. J. C. Berendsen, J. R. Grigera and T. P. Aatsma, J. Phys. Chem., 1987, 91, 6269 CrossRef CAS.
- W. L. Jorgensen, J. Chandrasekhar, J. D. Madura, R. W. Impey and M. L. Klein, J. Chem. Phys., 1983, 79, 926 CrossRef CAS PubMed.
- W. L. Jorgensen and J. D. Madura, Mol. Phys., 1985, 94, 1381 CrossRef.
- J. L. F. Abascal and C. Vega, J. Chem. Phys., 2005, 123, 234505 CrossRef CAS PubMed.
- M. Gavish, J.-L. Wang, M. Eisenstein, M. Lahav and L. Leiserowitz, Science, 1992, 256, 815 CAS.
- W. Drost-Hansen and J. Lin Singleton, Fundamentals of Medicinal Cell Biology, JAI, Greenwich, CT, 1992, vol. 3a, p. 157 Search PubMed.
- J. A. Fornés, J. Colloid Interface Sci., 2008, 323, 255 CrossRef PubMed.
- D. L. Scovell, T. D. Pinkerton, V. K. Medvedev and E. M. Stuve, Surf. Sci., 2000, 457, 365 CrossRef CAS.
- Y. Li, J. Li and F. Wang, Proc. Natl. Acad. Sci. U. S. A., 2013, 110, 12209 CrossRef CAS PubMed.
Footnote |
| † Electronic supplementary information (ESI) available: The MD simulation of water confined between two single graphene sheets and two-phase coexistence, the DFT computational details, the snapshot of the all-atom planer structure, the ρ–PL curves for various D under electric fields, and the dynamic trajectories of the phase transitions from LD-48MI to MD-HMI, from MD-HMI to HD-fRMI, and from MD-HMI to HD-pRMI. See DOI: 10.1039/c3sc53368a |
| This journal is © The Royal Society of Chemistry 2014 |

