
Measuring student performance in general organic chemistry
Ara C.
Austin
a,
Hagit
Ben-Daat
a,
Mary
Zhu
a,
Robert
Atkinson
b,
Nathan
Barrows
c and
Ian R.
Gould
*a
aDepartment of Chemistry and Biochemistry, Arizona State University, Tempe, AZ 85287, USA
bSchool of Computing, Informatics and Decision Systems Engineering, Arizona State University, Tempe, AZ 85287, USA
cDepartment of Chemistry, Grand Valley State University, Allendale, MI 49401, USA
First published on 24th November 2014
Abstract
Student performance in general organic chemistry courses is determined by a wide range of factors including cognitive ability, motivation and cultural capital. Previous work on cognitive factors has tended to focus on specific areas rather than exploring performance across all problem types and cognitive skills. In this study, we have categorized the different kinds of problems encountered in general organic chemistry, and correlated performance in each problem type with overall class performance. Fairly reproducible results are found for ten consecutive semesters over five academic years. Problem types that require higher-level cognitive skills tend to correlate better with overall class performance than those that rely more heavily on memorization. Performance on some problem types was found to predict up to ∼90% of the variances of overall class performance. Correlations across problem types with external student characteristics, such as general chemistry grade, are interpreted as highlighting the important contributions of other factors in addition to cognitive ability to success in organic chemistry.
Introduction
The two-semester general organic chemistry course in the U.S. is required for many college students who are not chemistry or biochemistry majors, and is often considered to be one of the more challenging in their undergraduate careers (Zoller, 1990; Grove and Bretz, 2010). Organic chemistry is also described as a roadblock course for pre-health students who wish to enter medical, dental, and other professional schools (Rowe, 1983; Lovecchio and Dundes, 2002; Barr et al., 2010), particularly in underrepresented student populations (Carmichael et al., 1986; Barr et al., 2008). Many approaches to improve student success in organic chemistry have been described in the literature. Examples include curriculum and course content development (Reingold, 2004; Grove et al., 2008; Lopez et al., 2011; Flynn and Biggs, 2012; Raker and Towns, 2012), incorporation of active learning strategies (Paulson, 1999; Muthyala and Wei, 2013), implementation of peer-led team learning (Gosser and Roth, 1998; Tien et al., 2002), the use of in-class technology (Derting and Cox, 2008; Flynn, 2011; Ryan, 2013) and electronic and online homework systems (Dori, 1995; Penn et al., 2000; Chamala et al., 2006; Chen and Baldi, 2008; Chen et al., 2010; Parker and Loudon, 2013).Predictors of student performance in organic chemistry have been the subject of several recent studies (see, for example, Szu et al., 2011; Lopez et al., 2014). To completely understand student performance it would be necessary to characterize the relative contributions of three fundamental contributing factors, i.e., cognitive ability (Ausubel et al., 1978), motivation (Deci et al., 1991; Zimmerman et al., 1992) and cultural capital (Bourdieu et al., 1990). A quantitative description of performance in terms of these three factors would represent a challenging long-term research project. Part of the problem is simply quantifying performance. The information content in a final grade or single point total at the end of the semester is rather low, and we wondered if there was a more informative way of describing student performance using simple standard assessments.
Cognitive ability is perhaps the most frequently studied contributing factor in organic chemistry. Previous work has focused on specific cognitive skills such as the ability to visualize 3-dimensional structures (Ferk et al., 2003; Oke and Alam, 2010; Stieff, 2011), specific types of problem solving ability (Bhattacharyya and Bodner, 2005; Ferguson and Bodner, 2008; Cartrette and Bodner, 2010; Kraft et al., 2010), representational models (Bodner and Domin, 2000), thinking patterns (Taagepera and Noori, 2000) and concept development (Nash et al., 2000; Grove et al., 2012). Rather than concentrating on a specific cognitive area, we wondered if a more holistic approach might be useful. For example, nomenclature problems involve mainly the application of memorized rules, and are more relevant to the “Remember” and “Understand” categories of the cognitive domain of the revised Bloom taxonomy (Anderson et al., 2001). Solving complex multi-step synthesis problems, or deriving the mechanism of a reaction that has not previously been seen, however, are more relevant to the “Apply”, “Evaluate”, and “Create” categories. These latter types of organic chemistry problems test the ability of students to apply existing knowledge in new contexts, consistent with conventional understandings of true problem solving and learning (Bruner, 1960). Students might be expected to perform differently on organic chemistry problems that call on different categories of the cognitive domain, due to divergent cognitive skill sets.
Here, we describe a simultaneous analysis of student performance over the entire range of organic chemistry problem types, and presumably cognitive skills, to obtain a more detailed insight into student performance. The study takes advantage of a large dataset that includes almost 4000 individual student performances collected over five academic years. Problems used in the course examinations were categorized into different types based on conventional organic chemistry topics, and student performance was analyzed by problem type. Reproducible patterns of student performance over the different problem types were observed. Some problem types were found to be highly predictive of overall performance.
Experimental approach and collected data
Student performance data was collected for the general organic chemistry courses offered at a large public institution in the Southwestern United States. The study was assigned exempt status by the institution's IRB. At this institution, general organic chemistry is taught as two separate courses in different, usually consecutive, semesters; the first semester course is taught in fall and the second in spring. Data was collected from the first semester course of fall 2009 through the second semester course of spring 2014, i.e., ten consecutive semesters over five complete academic years, to generate a student performance dataset of 3925 (the number of individual students who participated is lower since some students took both the fall and the spring semester classes). The number of students studied in each semester and their overall mean scores are summarized in Table 1. The mean scores for the various semesters were similar (Table 1), however, an analysis of variance indicated a statistically significant difference across the fall semesters, F(4, 2047) = 5.36, p = 0.00, and also across the spring semesters, F(4, 1868) = 24.7, p = 0.00. Thus, the overall class performances were similar but not identical over the time period of the study. It is not surprising that small differences are found since although all classes had the same instructor and similar materials, there are inevitable small changes in teaching style, content coverage and diversity in class populations over 5 years.| First semester (fall) | Second semester (spring) | |||||||||
|---|---|---|---|---|---|---|---|---|---|---|
| 2009 | 2010 | 2011 | 2012 | 2013 | 2010 | 2011 | 2012 | 2013 | 2014 | |
| a In cases where gender and demographic data do not sum to 100%, the remainder is not reported. | ||||||||||
| No. of students | 351 | 408 | 402 | 432 | 459 | 344 | 373 | 373 | 367 | 416 |
| Female (%) | 57.0 | 48.3 | 46.5 | 49.3 | 58.2 | 56.4 | 48.0 | 44.0 | 43.1 | 53.1 |
| Male (%) | 42.7 | 51.5 | 53.5 | 50.7 | 41.4 | 42.7 | 51.7 | 56.0 | 56.7 | 46.9 |
| White (%) | 61.8 | 60.0 | 64.2 | 56.7 | 54.7 | 59.9 | 57.9 | 63.5 | 60.5 | 57.2 |
| Hispanic (%) | 17.4 | 14.0 | 11.9 | 16.4 | 14.4 | 16.9 | 15.0 | 14.2 | 15.5 | 12.5 |
| Asian (%) | 15.7 | 17.6 | 16.4 | 18.5 | 22.0 | 17.2 | 18.2 | 15.3 | 16.1 | 22.8 |
| Black/African American (%) | 0.9 | 3.4 | 2.0 | 2.8 | 1.1 | 0.9 | 2.9 | 3.2 | 1.9 | 1.9 |
| Native American (%) | 0.6 | 1.0 | 0.5 | 0.7 | 0.4 | 0.3 | 1.1 | 0.3 | 0.8 | 0.5 |
| Two or more races (%) | 1.1 | 0.3 | 3.3 | 3.7 | 5.9 | 1.2 | 0.5 | 2.4 | 4.1 | 4.3 |
| Avg. score (%) | 67.3 | 73.9 | 71.7 | 69.5 | 72.4 | 68.8 | 74.2 | 65.6 | 75.6 | 73.9 |
| Std. dev (%) | 18.2 | 15.9 | 16.9 | 17.4 | 16.6 | 18.3 | 17.2 | 17.8 | 16.1 | 15.9 |
The first semester course covers basic organic chemistry principles such as bonding and mechanistic concepts, alkane conformations, nomenclature, chirality, spectroscopy, substitution and elimination reactions of alkyl halides, and reactions of alkenes. The second semester course covers the remainder of the standard functional group chemistry, retrosynthetic analysis, and simple pericyclic reactions, but excludes the chemistry of biomolecules or polymers. Students are assessed each semester using three midterm exams and one comprehensive final exam. All examination questions were short answer type, multiple choice was not used. Different graders were used each semester, but all graders generated their grading rubrics in consultation with the class instructor.
Each exam question was categorized according to one of ten major problem types as summarized in Table 2. No attempt was made to also categorize the questions in terms of cognitive category for several reasons. First, the main focus of this investigation is to learn how to quantify student performance in more informative way rather than directly study their cognitive ability. Second, categorization of problems and student performance in terms of familiar course themes can more directly inform improvements in instruction. Third, most of the questions have overlap among the standard cognitive categories (see further below).
| Problem type | First semester (fall) | Second semester (spring) | Total | ||||||||
|---|---|---|---|---|---|---|---|---|---|---|---|
| 2009 | 2010 | 2011 | 2012 | 2013 | 2010 | 2011 | 2012 | 2013 | 2014 | ||
| Nomenclature (1) | 4 | 2 | 1 | 3 | 2 | 3 | 1 | 4 | 2 | 3 | 25 |
| Bonding/Concepts (2) | 8 | 8 | 8 | 10 | 10 | 1 | 1 | 0 | 2 | 1 | 49 |
| Acidity/Basicity (3) | 3 | 3 | 2 | 5 | 3 | 4 | 4 | 2 | 3 | 3 | 32 |
| Spectroscopy (4) | 4 | 2 | 6 | 5 | 5 | 2 | 2 | 1 | 0 | 0 | 27 |
| Chirality (5) | 1 | 1 | 1 | 0 | 0 | — | — | — | — | — | 3 |
| Mechanism (6) | 18 | 8 | 5 | 5 | 6 | 10 | 11 | 16 | 7 | 9 | 95 |
| Reagents/Products (7) | 14 | 10 | 5 | 3 | 3 | 24 | 20 | 15 | 6 | 14 | 114 |
| Synthesis (8) | — | — | — | — | — | 11 | 12 | 9 | 6 | 9 | 47 |
| Pericyclic Reactions (9) | — | — | — | — | — | 3 | 7 | 3 | 4 | 5 | 22 |
| Conformations (10) | 5 | 4 | 4 | 5 | 5 | — | — | — | — | — | 23 |
| Total questions | 57 (64) | 38 (49) | 32 (38) | 36 (39) | 34 (36) | 58 (67) | 58 (70) | 50 (54) | 30 (38) | 44 (49) | 437 (504) |
The definitions of most of the problem types are straightforward. An exception is the broad Bonding/Concepts (2) problem type, which includes atomic and molecular wavefunctions, hybridization, Lewis structures, isomers, resonance, and polar bonds as topics for the first semester course, and conjugated π-molecular wavefunctions, resonance, aromaticity, and retrosynthetic analysis in terms of the synthon concept in the second semester course. The Nomenclature (1) problem type involves mainly IUPAC nomenclature. The Acidity/Basicity (3) problem type refers to both Brønsted and Lewis acid/base concepts. The Spectroscopy (4) problem type includes problems that ask about fundamental spectroscopic principles (e.g. factors that determine NMR chemical shifts and IR absorption frequencies), but most of these problems involve determination of an unknown structure from provided spectra. The Chirality (5) problem type refers to problems that require identification and characterization of enantiomers and their properties and reactions. The Mechanism (6) problem type includes simple multi-step curved arrow pushing mechanism problems for both reactions the students have seen previously and reactions they have never seen before. The Reagents/Products (7) problem type refers to problems in which students are asked to supply missing reagents/conditions or major organic product, and the Multi-Step Synthesis (8) problem type refers to problems in which students are asked to provide a synthesis a target structure from a provided starting structure. The Pericyclic Reactions (9) problems include both F.M.O. and aromatic transition state theory, and the Conformations (10) problem type refers to conformational analysis of both cyclic and acyclic alkanes. Example questions are provided in the Appendix.
To be included in the analysis, each question had to pass a standard item discrimination test (Nunnally and Ator, 1964). Questions with a discrimination index of 0.2 or greater were included in the analysis. Upon completion of the discrimination item analysis, the Chirality (5) problem type, which included identification of isomers and assignment of absolute configurations, was found to have so few problems that it could not be considered further in the analysis, Table 2.
Individual student scores for each discriminated question in a problem type were summed, averaged by the available points for that particular problem type, and converted into a percentage. Each student's overall score for all of the discriminated questions in each semester was converted into a percentage of the total available points. Several scatter plots showing the correlations between the students' average score for several problem types versus overall course score are shown in Fig. 1, for the fall 2013 semester, as an illustrative example. Qualitatively, it is evident that the scatter is not the same for each problem type. For this particular semester, the Mechanism (6) problem type had a lower scatter, and the Nomenclature (1) problem type, a significantly higher scatter.
 | ||
| Fig. 1 Scatter plots of percentage scores for various types of organic chemistry problem versus overall course percentage score, for the fall 2013 first semester organic chemistry class as an example, showing different correlations for different problem types. | ||
Student performance by problem type
Linear correlation analysis of performance per problem type versus overall performance was performed for each semester; the relevant correlation coefficients (r) are summarized in Table 3. All problem types were positively correlated to the overall performance, and the correlation coefficients (r) varied over a very wide range, from 0.44 to 0.93. The Mechanism (6) problem type consistently exhibited the highest correlations for both semesters, whereas the Nomenclature (1) problem type was always among the least correlating problem types.| Problem type | First semester (fall) | Second semester (spring) | ||||||||
|---|---|---|---|---|---|---|---|---|---|---|
| 2009 | 2010 | 2011 | 2012 | 2013 | 2010 | 2011 | 2012 | 2013 | 2014 | |
| Nomenclature (1) | 0.75 | 0.59 | 0.65 | 0.76 | 0.70 | 0.68 | 0.44 | 0.74 | 0.72 | 0.74 |
| Bonding/Concepts (2) | 0.86 | 0.83 | 0.88 | 0.88 | 0.88 | 0.39 | 0.47 | — | 0.54 | 0.54 |
| Acidity/Basicity (3) | 0.70 | 0.74 | 0.61 | 0.85 | 0.83 | 0.69 | 0.71 | 0.55 | 0.71 | 0.73 |
| Spectroscopy (4) | 0.75 | 0.71 | 0.83 | 0.84 | 0.79 | 0.68 | 0.62 | 0.58 | — | — |
| Mechanism (6) | 0.94 | 0.94 | 0.92 | 0.92 | 0.92 | 0.89 | 0.88 | 0.95 | 0.89 | 0.91 |
| Reagents/Products (7) | 0.90 | 0.90 | 0.91 | 0.91 | 0.87 | 0.94 | 0.94 | 0.96 | 0.96 | 0.95 |
| Synthesis (8) | — | — | — | — | — | 0.96 | 0.95 | 0.95 | 0.95 | 0.93 |
| Pericyclic Reactions (9) | — | — | — | — | — | 0.70 | 0.68 | 0.76 | 0.76 | 0.78 |
| Conformations (10) | 0.75 | 0.79 | 0.88 | 0.89 | 0.87 | — | — | — | — | — |
Stepwise multiple linear regression was also performed as a way of simultaneously analyzing all of the data. The different problem types were treated as the predictor variables to account for the variance in the overall class performance. As an example, the results of the stepwise multiple linear regression analysis for the fall 2013 semester of Fig. 1, are summarized in Table 4. For this particular semester, data was available for seven problem types, Table 2, which were used as the predictor variables in the analysis. The final model, F(5, 453) = 20306.1, p = 0.000, R2 = 0.996, did not include two of the problem type predictor variables, Nomenclature (1) and Acidity/Basicity (3), since these did not increase the predictive value of the final scores. As expected from Fig. 1 and Table 3, the Mechanism (6) problem type was the most predictive of overall class performance, β = 0.915, F(1, 453) = 2343.2, p = 0.000, adj. R2 = 0.836, followed by the Bonding/Concepts (2) problem type, which accounted for an additional 12% of the variance of the overall class performance. The other problem types, Conformations (10), Spectroscopy (4), and Reagents/Products (7), accounted for only an additional 2.8%, 1.1%, and 0.9% of the variance respectively.
| Variable | Model 1 | Model 2 | Model 3 | Model 4 | Model 5 | ||||||||||
|---|---|---|---|---|---|---|---|---|---|---|---|---|---|---|---|
| B1 | SEB | β | B2 | SEB | β | B3 | SEB | β | B4 | SEB | β | B5 | SEB | β | |
| Constant | 24.0 | 1.05 | 8.23 | 0.775 | 4.91 | 0.551 | 2.14 | 0.442 | 1.51 | 0.251 | |||||
| Mechanism (6) | 0.670 | 0.014 | 0.915 | 0.424 | 0.011 | 0.579 | 0.328 | 0.009 | 0.447 | 0.282 | 0.007 | 0.385 | 0.226 | 0.004 | 0.309 |
| Bonding/Concepts (2) | 0.445 | 0.014 | 0.474 | 0.350 | 0.011 | 0.373 | 0.331 | 0.008 | 0.352 | 0.319 | 0.005 | 0.340 | |||
| Conformations (10) | 0.223 | 0.010 | 0.271 | 0.189 | 0.007 | 0.230 | 0.145 | 0.005 | 0.177 | ||||||
| Spectroscopy (4) | 0.140 | 0.007 | 0.156 | 0.127 | 0.004 | 0.141 | |||||||||
| Reagents/Products (7) | 0.146 | 0.005 | 0.169 | ||||||||||||
| R | 0.915 | 0.974 | 0.988 | 0.994 | 0.998 | ||||||||||
| R 2 | 0.837 | 0.948 | 0.976 | 0.987 | 0.996 | ||||||||||
| Adj. R2 | 0.836 | 0.948 | 0.976 | 0.987 | 0.996 | ||||||||||
The problem types that were the highest predictors of variance in the overall class performance for each semester are summarized in Tables 5 and 6. As mentioned above, the class performances were not identical in terms of mean students scores from semester to semester, nevertheless, the same problem types were found to be the highest predictor variables each semester. For the first semester course, the Mechanism (6) problem type was always the highest predictor variable; the second highest predictor was always the Bonding/Concepts (2) problem type, Table 5. The third highest predictor variables varied among Reagents/Products (7), Conformations (10), and Acidity/Basicity (3) problem types. For the second semester course, the highest predictors were always Mechanism (6), Multi-Step Synthesis (8), and Reagents/Products (7) problem types. The problem type Nomenclature (1) was almost always the least predictive problem type for both semesters.
| Fall 2009 | Fall 2010 | Fall 2011 | Fall 2012 | Fall 2013 | ||||||
|---|---|---|---|---|---|---|---|---|---|---|
| Model 1 | Model 3 | Model 1 | Model 3 | Model 1 | Model 3 | Model 1 | Model 3 | Model 1 | Model 3 | |
| a Model 1 describes the single most predictive problem type, Model 3 describes the three most predictive problem types in decreasing order of predictive value. The problem types are summarized in Table 2. | ||||||||||
| Prob. types | (6) | (6),(2),(7) | (6) | (6),(2),(10) | (6) | (6),(2),(7) | (6) | (6),(2),(3) | (6) | (6),(2),(10) |
| R | 0.937 | 0.987 | 0.935 | 0.985 | 0.924 | 0.986 | 0.920 | 0.984 | 0.915 | 0.988 |
| R 2 | 0.879 | 0.974 | 0.875 | 0.969 | 0.854 | 0.971 | 0.847 | 0.967 | 0.837 | 0.976 |
| Adj. R2 | 0.878 | 0.974 | 0.875 | 0.969 | 0.854 | 0.971 | 0.847 | 0.967 | 0.836 | 0.976 |
| Spring 2010 | Spring 2011 | Spring 2012 | Spring 2013 | Spring 2014 | ||||||
|---|---|---|---|---|---|---|---|---|---|---|
| Model 1 | Model 3 | Model 1 | Model 3 | Model 1 | Model 3 | Model 1 | Model 3 | Model 1 | Model 3 | |
| a Model 1 describes the single most predictive problem type, Model 3 describes the three most predictive problem types in decreasing order of predictive value. The problem types are summarized in Table 2. | ||||||||||
| Prob. types | (8) | (8),(6),(7) | (8) | (8),(6),(7) | (7) | (7),(6),(8) | (7) | (7),(6),(8) | (7) | (7),(8),(6) |
| R | 0.955 | 0.991 | 0.954 | 0.992 | 0.956 | 0.998 | 0.957 | 0.993 | 0.946 | 0.992 |
| R 2 | 0.912 | 0.983 | 0.910 | 0.984 | 0.913 | 0.995 | 0.916 | 0.985 | 0.895 | 0.984 |
| Adj. R2 | 0.912 | 0.983 | 0.910 | 0.984 | 0.913 | 0.995 | 0.916 | 0.985 | 0.894 | 0.984 |
The most predictive problem types were those that were more likely to be characterized by higher categories of cognitive domain. In the first semester course, the Bonding/Concepts (2) problem type includes the majority of the new concepts that students are exposed to in first semester organic chemistry. Only a limited number of chemical reactions are covered in the first semester course, and the conceptual basis for these reactions are mostly covered by Bonding/Concepts (2) problems, which means that Bonding/Concepts (2) carries a much higher cognitive load than Reactions/Products (7) in the first semester course. The second semester course focuses much more on chemical reactions, and new concepts are introduced more within the context of new reactions, which places a much higher cognitive load on Reagents/Products (7) in the second semester course. Multi-step synthesis (Synthesis (8)) is taught in the second semester course and requires a deep understanding of concepts and reactions by the students, which is highly cognitively demanding. Multi-step synthesis is also challenging for students because they are required to solve problems they have never seen before and that by definition are impossible to memorize. Mechanism problems (6) are also cognitively demanding for students in both the first and second semester classes since they are again required to solve problem they have never seen before and obviously cannot memorize.
One potential problem with the simple linear regression analyses is that the scores for each student were averaged over different numbers of problems for each type. Types for which there were a larger number of problems might be expected to correlate better with overall performance on that basis alone. However, the types with the larger numbers of problems did not always exhibit the best correlations and/or were the best predictors. For the fall 2013 semester, for example (Fig. 1 and Table 4), the Mechanism (6) problem type, which had 6 problems, was a better predictor of the overall performance than the Bonding/Concepts (2) problem type, which had 10 problems. The Reagents/Products (7) problem type, which had 3 problems, was a better predictor variable than the Conformations (10) problem type for which there were 5 problems. In addition, the standardized coefficients from the stepwise linear regression (Tables 4–6) are intrinsically corrected for different numbers of problem types, and the observed trends in terms of which problem types are most predictive of performance are the same for both analyses. Thus, the observed behavior are not determined by the number of discriminated problems.
Two other statistical problems potentially influence the results of both the linear and the stepwise regressions, however. The scatter plots of Fig. 1 show clear ceiling effects, particularly for Nomenclature (1), Bonding/Concepts (2), and Acidity/Basicity (3) problem types. The scatter plots also show somewhat different extents of deviation from normal distribution for the different problem types. To ameliorate these effects, a simple non-parametric data analysis method was also used. Students were ranked in terms of percentage scores from lowest to highest both in terms of the overall class performance and for each problem type. For each problem type, the percentage of students who were in the lower half in both that problem type and also in overall class performance was then obtained. The larger this percentage, the more that particular problem type was representative of overall performance. The percentages ranged from a low of 67% to a high of 93%, depending upon the problem type and the semester, Table 7. The averages of these percentages over the five semesters for each course, Table 6, showed that the Mechanism (6), Bonding/Concepts (2), and Reagents/Products (7) problem types were those that best correlated with the overall performance in the first semester course, and that the Mechanisms (6), Reagents/Products (7), and Synthesis (8) problem types were the most correlating in the second semester class. The problem types that were best correlated with overall performance were thus found to be essentially the same from all of the different methods of analysis.
| Problem type | First semester (fall) | Second semester (spring) | ||||||||||
|---|---|---|---|---|---|---|---|---|---|---|---|---|
| 2009 | 2010 | 2011 | 2012 | 2013 | Avg.a | 2010 | 2011 | 2012 | 2013 | 2014 | Avg.a | |
| a The numbers in parentheses are the standard deviations. | ||||||||||||
| Nomenclature (1) | 77 | 69 | 74 | 79 | 72 | 74(4.0) | 74 | 76 | 75 | 79 | 77 | 76(1.9) |
| Bonding/Concepts (2) | 85 | 84 | 84 | 84 | 87 | 85(1.3) | 68 | 67 | — | 76 | 79 | 73(5.9) |
| Acidity/Basicity (3) | 76 | 73 | 68 | 83 | 81 | 76(6.1) | 76 | 76 | 69 | 80 | 76 | 75(4.0) |
| Spectroscopy (4) | 73 | 77 | 85 | 81 | 80 | 79(4.5) | 74 | 67 | 73 | — | — | 71(3.8) |
| Mechanism (6) | 89 | 87 | 85 | 86 | 87 | 87(1.5) | 84 | 87 | 91 | 91 | 90 | 89(3.0) |
| Reagents/Products (7) | 85 | 86 | 86 | 86 | 84 | 85(0.9) | 88 | 87 | 91 | 91 | 90 | 89(1.8) |
| Synthesis (8) | — | — | — | — | — | — | 90 | 89 | 93 | 90 | 91 | 91(1.5) |
| Pericyclic Reactions (9) | — | — | — | — | — | — | 73 | 70 | 83 | 76 | 78 | 76(5.0) |
| Conformations (10) | 77 | 82 | 84 | 87 | 82 | 82(3.6) | — | — | — | — | — | — |
Another possible issue is that the instructor was the same for all classes, and the observations may be a consequence of instructor bias. Specifically, certain problem types may be more predictive of overall performance simply because they were emphasized to a greater or lesser extent by the instructor. However, emphasis or de-emphasis of a specific topic might be expected to lead to universally high (emphasis) or low (de-emphasis) performance for all students in that topic, and this is clearly not the case for the problem types are highly predicting. For a problem type to be highly predicting the students scores need to span the entire range of the overall scores. Thus, although we recognize the limitations of only using data from a single instructor, we believe that instructor bias is unlikely to be responsible for the trends across problem type observed here. It is possible that different instructors could write problems that distribute the cognitive load differently, but the conclusion that students are more differentiated by problems with a higher cognitive load seems reasonable, even if the types of problems with the higher cognitive load might be different from those in this study.
Connecting performance to student characteristics
Even though the overall class performance was not identical for the classes included in this study, the data show quite reproducibly that student performance is not the same across all problem types. The problem types that are more cognitively demanding tend to be better predictors of overall performance, sometimes with remarkably high predictive value. The differences in performance between problem types were still fairly small, however, which may be due to the inherent difficulty of cleanly categorizing some of the questions into a single problem type, and also because many questions draw from different cognitive categories. For example, in addition to applying memorized rules, the nomenclature questions in these courses also require students to be able to recognize and assign the stereochemistry of geometrical isomers and also at asymmetric centers. Inevitable mixing of concepts within questions will tend to reduce the differences between the problem types.Nevertheless, it was of interest to try to relate performance by problem type to influences on student performance discussed in the literature. We have analyzed three of these: (1) first semester general chemistry grade, (2) whether the student is a first generation college goer, (3) whether the student self-reports as a pre-health student. Data for this part of the study was collected by survey of first semester fall 2013 class. Survey participation was voluntary, but 81% of the class participated and so the results should be quite representative. The relevant data are summarized in Table 8.
| Studenta | Overall | Category | ||||||
|---|---|---|---|---|---|---|---|---|
| (1) | (2) | (3) | (4) | (6) | (7) | (10) | ||
| a The number of students in each category is given in parenthesis. b Combined mean scores for ‘B’ and ‘C’ general chemistry students. Student who earned a lower grade than C are not allowed to register for the organic chemistry course at the subject institution. | ||||||||
| Not pre-health (116) | 73.0 | 78.6 | 76.5 | 76.9 | 73.9 | 73.3 | 67.0 | 78.3 |
| Pre-health (254) | 72.2 | 78.9 | 74.8 | 76.4 | 73.0 | 72.3 | 68.2 | 77.4 |
| Not first-generation (99) | 73.7 | 79.4 | 76.9 | 77.3 | 75.0 | 73.9 | 68.8 | 78.8 |
| First-generation (271) | 68.9 | 77.2 | 71.1 | 74.4 | 68.7 | 68.9 | 65.1 | 74.6 |
| Gen. chem grade A (216) | 78.0 | 83.5 | 81.7 | 81.0 | 77.7 | 79.3 | 72.9 | 83.1 |
| Gen. chem grade B (108) | 65.0 | 72.5 | 67.3 | 70.4 | 67.1 | 63.6 | 61.1 | 69.4 |
| Gen. chem grade C (32) | 58.5 | 67.1 | 59.1 | 64.7 | 61.3 | 56.7 | 54.9 | 65.1 |
| B + C grades (140)b | 63.5 | 71.2 | 65.4 | 69.1 | 65.8 | 62.0 | 59.7 | 68.4 |
Prior achievement in science courses has previously been found to be a good predictor of organic chemistry performance (see, for example, Turner and Lindsay, 2003; Lopez et al., 2014). Table 8 shows a clear trend between general chemistry grade and overall class performance. The results from the analysis of variance for overall class performance shows a statistically significant difference in overall scores by general chemistry grade, F(2, 353) = 39.6, p = 0.000. The Tukey–Kramer post hoc test shows that both the ‘A’ and ‘B’ students (p = 0.000) and the ‘A’ and ‘C’ students (p = 0.000) are statistically different, but the ‘B’ and ‘C’ students are not (p = 0.097), presumably because the population of ‘C’ students is so small, Table 8. Therefore, to determine whether performance difference varied with problem type, the ‘B’ and ‘C’ student mean scores were combined and compared to those of the ‘A’ students. The largest difference between these scores was found for the Bonding/Concepts (2) and Mechanisms (6) problem types, and the smallest difference was found for the Nomenclature (1) problem type. These results exactly match the overall trends discussed above, i.e., that lower performing general chemistry students are differentiated from higher performing general chemistry students to a greater extent by problem types that have higher cognitive demand. General chemistry grade is, however, a predictor of organic chemistry performance, and does not describe a fundamental student characteristic.
A more fundamental characteristic that may contribute to success is whether students are first-generation college goers (Richardson and Skinner, 1992; Horn and Nunez, 2000; Pascarella et al., 2004). The overall mean scores and the mean scores across problem type were found to be numerically lower for first-generation college goers in the fall 2013 class, Table 8. The differences in this case, however, were considerably smaller than observed with general chemistry grade. The overall mean scores were found to be statistically different, t(368) = 2.42, p = 0.016, but only the Bonding/Concepts (2) and Spectroscopy (4) problem types' mean scores were also found to be statistically different. We conclude that although this characteristic does influence student performance, the effect is too small to be analyzed by problem type.
As mentioned above, organic chemistry is often seen as a roadblock for the students on pre-health tracks in the United States (Barr et al., 2010; Lovecchio and Dundes, 2002). The performances of pre-health and non-pre-health students in terms of both overall score and across the problem types were compared, Table 8. For the fall 2013 class, there was no significant difference in overall mean scores, t(368) = 0.406, p = 0.685. There was also no statistical difference in the mean scores between these two groups for any of the problem types.
Taken together, these observations of student characteristics represent an interesting trend. The characteristic that differentiates strongly between students in terms of overall performance (general chemistry grade) also differentiates by the cognitive demand of the problem type. The characteristic that barely differentiates students by overall performance (first generation college goer) also barely differentiates by problem type. The characteristic that does not differentiate students (pre-health versus not pre-health) also does not differentiate by problem type. If this connection between student characteristic and performance is general, then it is quite revealing. It implies that characteristics that contribute to higher overall performance, also contribute to higher performance on problems with higher cognitive load, even if they have no direct connection to cognitive ability. It also implies that characteristics that do not substantially contribute overall performance do not influence performance on problems with differing cognitive loads, even if a connection to cognitive ability might be expected. We cannot be sure of this since we have not yet studied enough different kinds of student characteristics, but it is important enough to explore further implications anyway.
If general chemistry grade is predictive of overall performance in organic chemistry, and higher performing general chemistry students perform better on the more cognitively demanding problems in organic chemistry, then this would suggests that the cognitive skills required to perform well in organic chemistry are similar to those required to do well in general chemistry. However, it is often discussed in the literature that the quantitative emphasis in general chemistry is quite different from the qualitative emphasis of organic chemistry (Ferguson and Bodner, 2008; Lopez et al., 2014). Thus, it is unlikely that the relationship between general chemistry and organic chemistry performance is purely a consequence of similar student cognitive abilities. Of course, student performance is also strongly influenced by other fundamental factors, specifically motivation (Black and Deci, 2000; Turner and Lindsay, 2003; Zusho et al., 2003; Koballa and Glynn, 2007; Jurisevic et al., 2012; Richardson et al., 2012) and cultural capital (Tai et al., 2005; Hailikari and Nevgi, 2010; Szu et al., 2011). The larger the influence of, for example, motivation on student performance, the more likely it will be that students who are high performing in general chemistry will also be high performing in organic chemistry, since the cognitive influence is diminished. We suggest that the results described here point to the important contribution of factors in addition to cognitive skills to student success in organic chemistry (Black and Deci, 2000; Lynch and Trujillo, 2011).
Conclusions
Quantitative analysis of performance across problem types is a readily accessible tool that provides insight into influences on student performance for factors that have a substantial influence on performance. Whether students are first generation college goers only weakly influences performance and analysis by problem type is not possible. General chemistry grade, however, is a strong predictor of organic chemistry performance and problem-type analysis clearly points to the important role of non-cognitive factors such as student motivation. This work clearly needs to be expanded to include quantitative studies of other kinds of student characteristics and also qualitative analysis of student approaches to the general organic chemistry course, and both of these are currently underway in our research groups.Appendix
Example questions from the fall 2009 first semester course

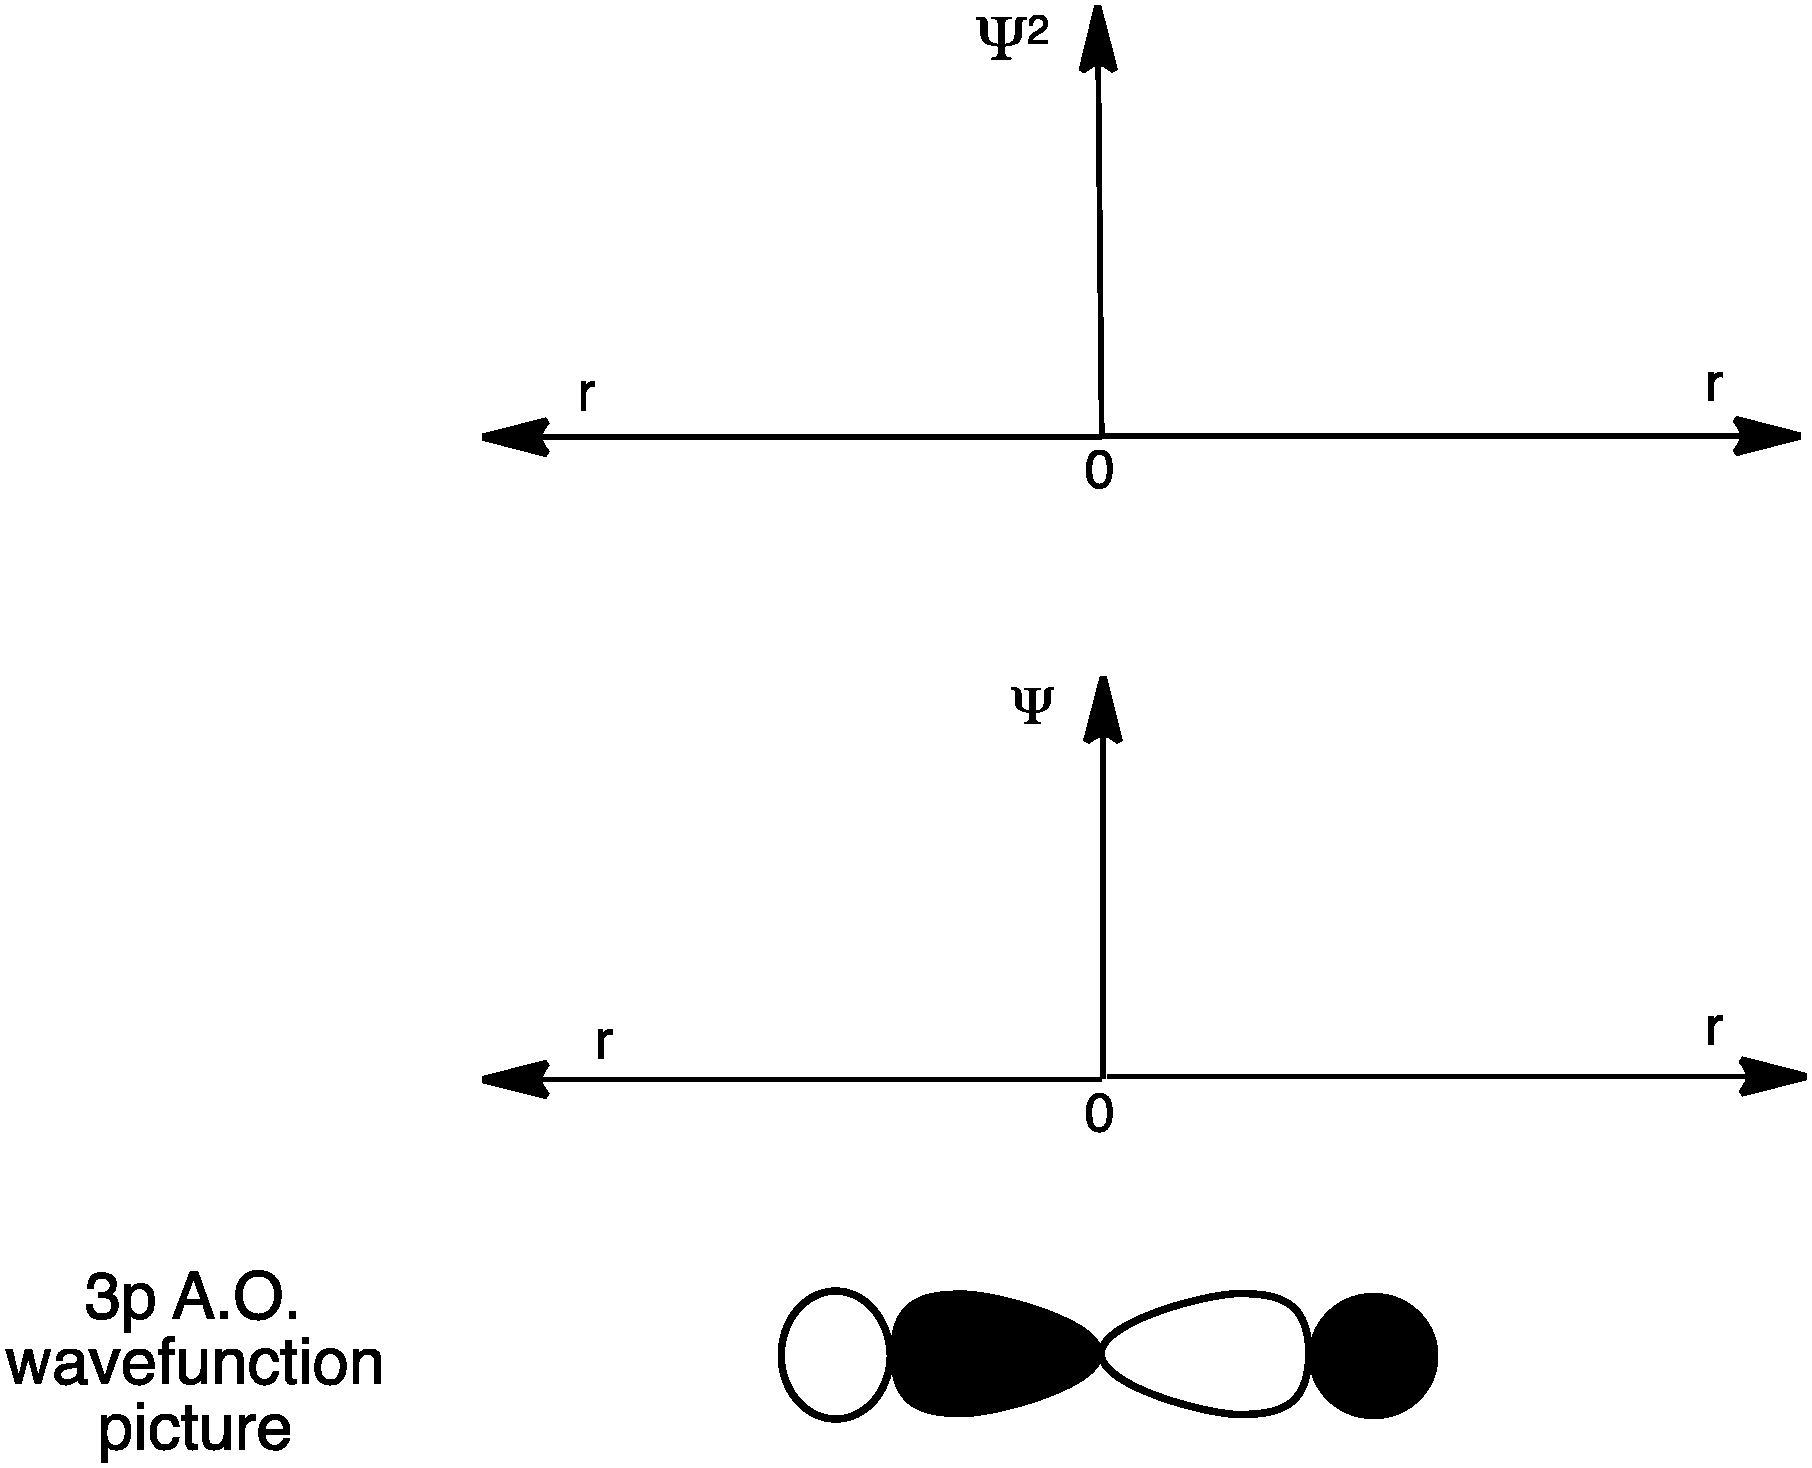
(a) Give a plot of the magnitude of the wavefunction (Ψ) versus distance from the nucleus on the axes provided, AND IDENTIFY ANY NODES ON THIS PLOT
(b) Give a plot of the magnitude of the wavefunction squared (Ψ2) versus distance from the nucleus on the axes provided
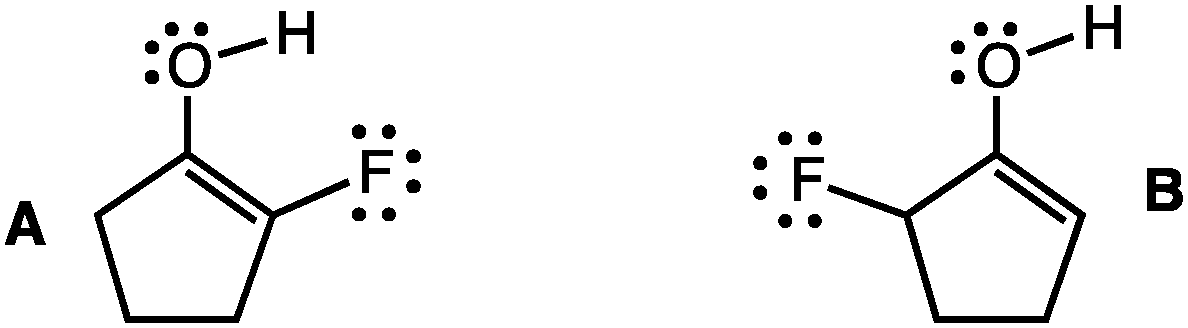
![[double bond, length as m-dash]](https://www.rsc.org/images/entities/char_e001.gif) O bond? Give an explanation that includes drawings of relevant minor resonance contributors.
O bond? Give an explanation that includes drawings of relevant minor resonance contributors.
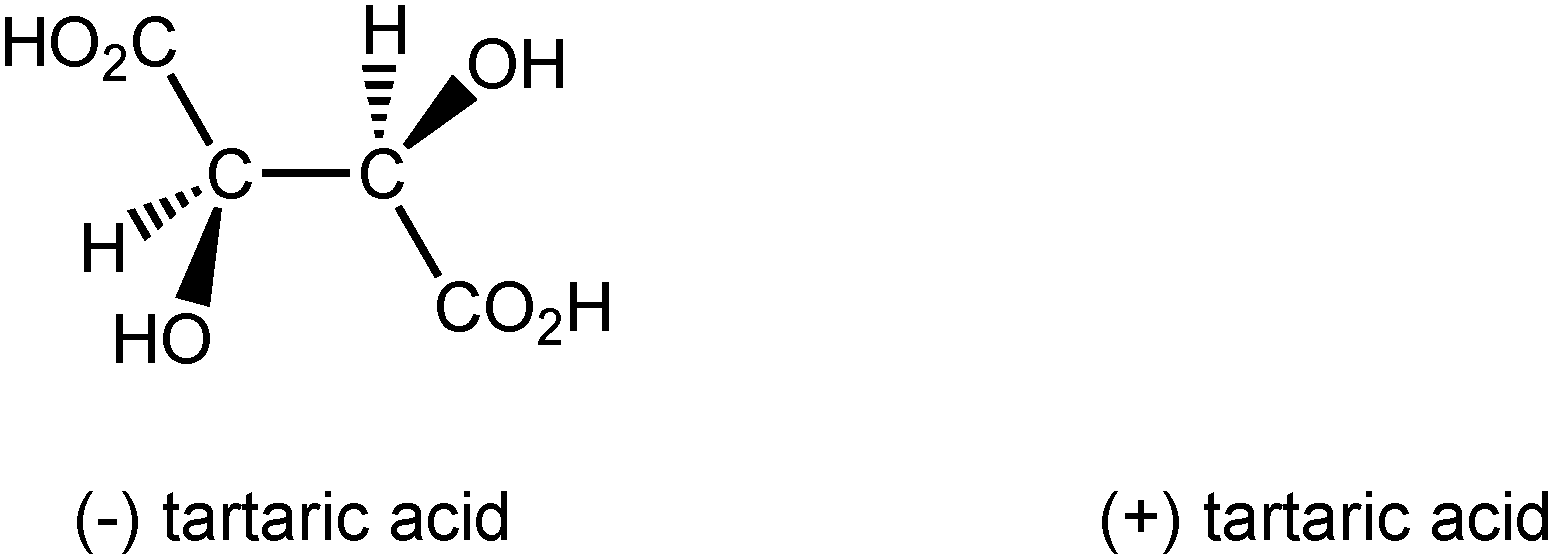
(a) Assign the configuration, R or S, for each asymmetric (chiral) center for (−) tartaric acid
(b) Draw a structure of (+) tartaric acid

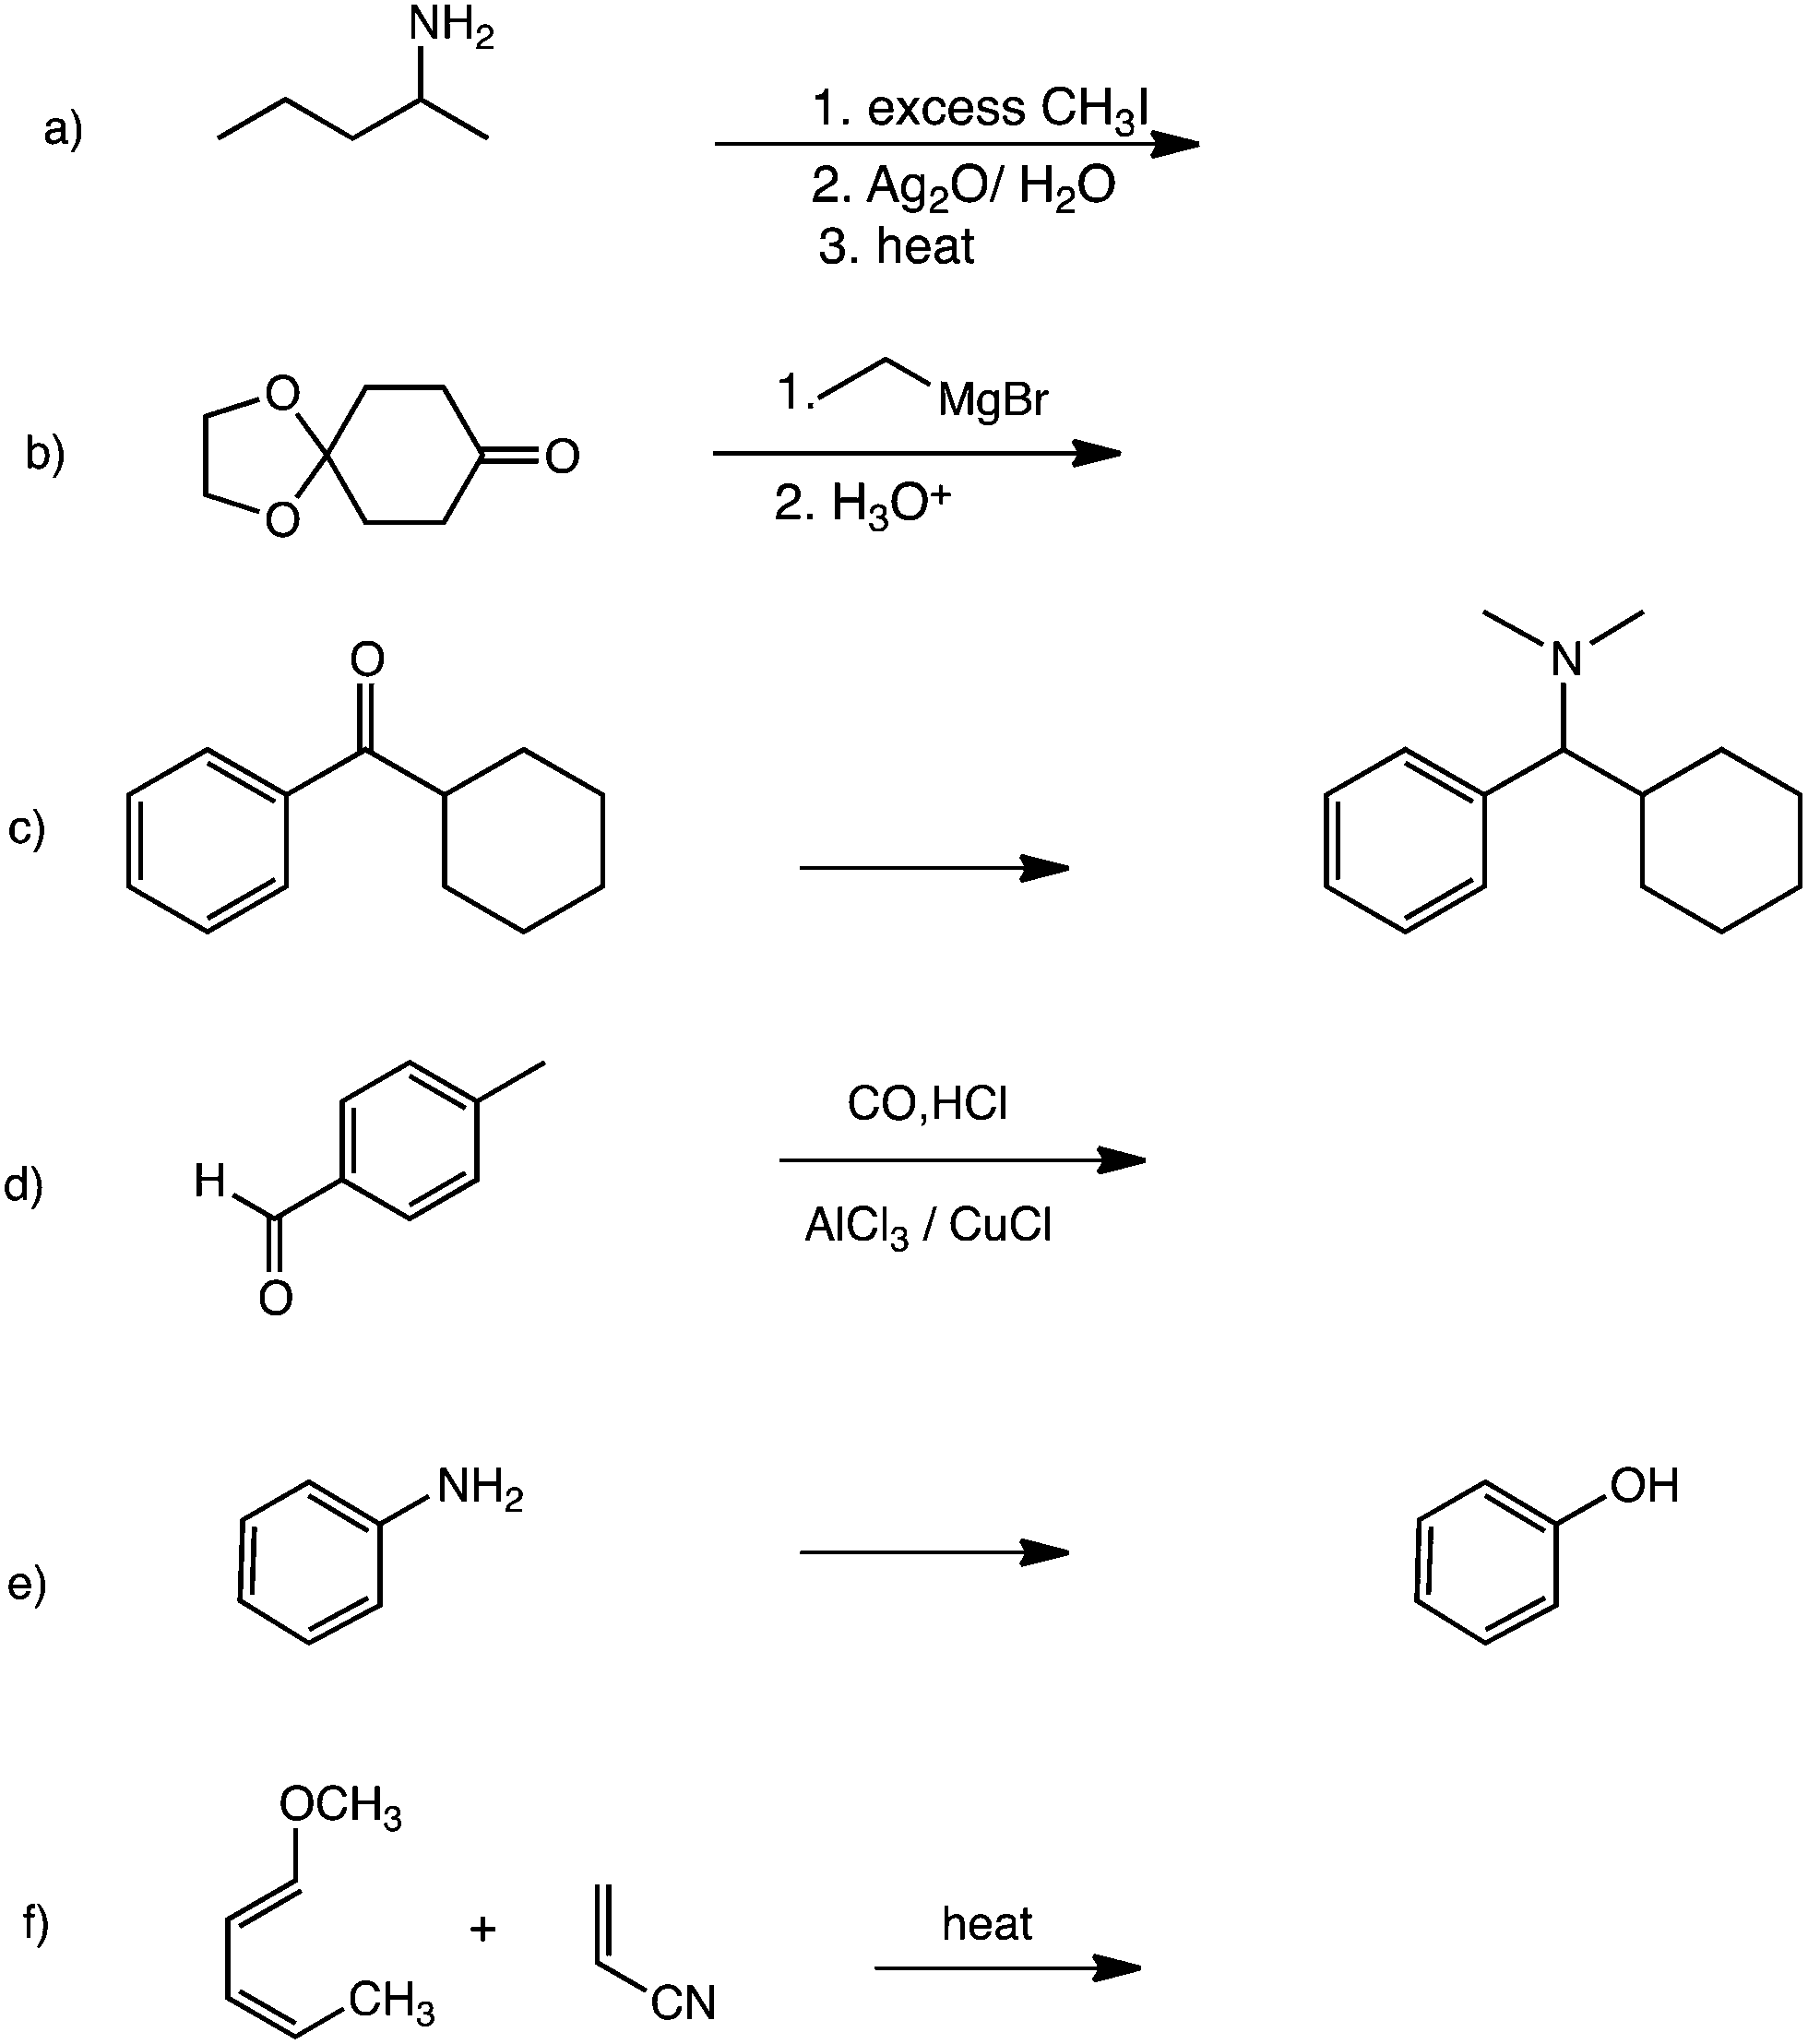
(a) Give the missing major ORGANIC PRODUCT or REAGENTS/CONDITIONS as appropriate
(b) Show stereochemistry where appropriate
(c) Briefly explain whether a solution of the product would be optically active

(a) draw both chair conformations
(b) determine the energy difference between the two chair conformations
(c) indicate the lower energy chair

Example questions from the spring 2010 second semester course


• You can give an abbreviated mechanism, i.e. you may use +H+ and −H+
• IT IS NOT NECESSARY TO INDICATE THE LEWIS/BRONSTED ACID/BASE AT EACH STEP
• BUT, draw all resonance structures for the intermediates
• Add non-bonding electrons and C–H bonds as necessary

Provide the missing products, reagents/conditions or reactants, as required. Do not forget to include absolute and relative stereochemistry as appropriate.

| Question 9 (18 pts) | |
| (a) Give the curved arrow-pushing and the allowed product for the following cycloaddition reaction. Pay attention to stereochemistry | |

|
|
| (b) ON TOP of the structures as indicated, draw the requested F.M.O.s and give the total number of π-molecular orbitals and electrons associated with the π-system for each structure. | |
|

|
| total # of π-M.O.s for this structure = _____ | total # of π-M.O.s for this structure = _____ |
| total # of electrons in the π-system for this structure = _____ | total # of electrons in the π-system for this structure = _____ |
Acknowledgements
This work was supported in part by NSF NSF-EHR-DUE 1140901.References
- Anderson L. W., Krathwohl D. R., Airasian P. W., Cruikshank K. A., Mayer R. E., Pintrich P. R., Raths J. and Wittrock M. C., (2001), A Taxonomy for Learning, Teaching, and Assessing: A Revision of Bloom's Taxonomy of Educational Objectives, Abr. Edn., White Plains, NY: Longman.
- Ausubel D. P., Novak J. D. and Hanesian H., (1978), Educational Psychology: A Cognitive View, New York, NY: Holt Rinehart and Winston.
- Barr D. A., Gonzalez M. E. and Wanat S. F., (2008), The leaky pipeline: factors associated with early decline in interest in premedical studies among underrepresented minority undergraduate students, Acad. Med., 83, 503–511.
- Barr D., Matsui J., Wanat S. F. and Gonzalez M., (2010), Chemistry courses as the turning point for premedical students, Adv. Health Sci. Educ., 15, 45–54.
- Bhattacharyya G. and Bodner G. M., (2005), “It gets me to the product”: how students propose organic mechanisms, J. Chem. Educ., 82, 1402–1407.
- Black A. E. and Deci E. L., (2000), The effects of instructors' autonomy support and students' autonomous motivation on learning organic chemistry: a self-determination theory perspective, Sci. Educ., 84, 740–756.
- Bodner G. M. and Domin D. S., (2000), Mental models: the role of representations in problem solving in chemistry, Univ. Chem. Educ., 4, 24–30.
- Bourdieu P., Harker R., Mahar C. and Wilkes C., (1990), An Introduction to the Work of Pierre Bourdieu: The Practice of Theory, New York, NY: St. Martin's Press.
- Bruner J. S., (1960), The Process of Education, New York, NY: Vintage Books.
- Carmichael J. W., Burke R. T., Hunter J. T., Labat D. D. and Sevenair J. P., (1986), Predictors of success of Black Americans in a college-level pre-health professions program, Advisor, 6, 5–11.
- Cartrette D. P. and Bodner G. M., (2010), Non-mathematical problem solving in organic chemistry, J. Res. Sci. Teach., 47, 643–660.
- Chamala R. R., Ciochina R., Grossman R. B., Finkel R. A., Kannan S. and Ramachandran P. J., (2006), EPOCH: an organic chemistry homework program that offers response-specific feedback to students, J. Chem. Educ., 83, 164–169.
- Chen J. H. and Baldi P., (2008), Synthesis explorer: a chemical reaction tutorial system for organic synthesis design and mechanism prediction, J. Chem. Educ., 85, 1699–1703.
- Chen J. H., Kayala M. A. and Baldi P., (2010), Reaction explorer: towards a knowledge map of organic chemistry to support dynamic assessment and personalized instruction, ACS Symp. Ser., 1060, 191–209.
- Deci E. L., Vallerand R. J., Pelletier L. G. and Ryan R. M., (1991), Motivation and education: the self-determination perspective, Educ. Psychol., 26, 325–346.
- Derting T. L. and Cox J. R., (2008), Using a tablet PC to enhance student engagement and learning in an introductory organic chemistry course, J. Chem. Educ., 85, 1638–1643.
- Dori Y. J., (1995), Cooperative studyware development of organic chemistry module by experts, teachers, and students, J. Sci. Educ. Technol., 4, 163–170.
- Ferguson R. and Bodner G. M., (2008), Making sense of the arrow-pushing formalism among chemistry majors enrolled in organic chemistry, Chem. Educ. Res. Pract., 9, 102–113.
- Ferk V., Vrtacnik M., Blejec A. and Gril A., (2003), Students' understanding of molecular structure representations, Int. J. Sci. Educ., 25, 1227–1245.
- Flynn A. B., (2011), Developing problem-solving skills through retrosynthetic analysis and clickers in organic chemistry, J. Chem. Educ., 88, 1496–1500.
- Flynn A. B. and Biggs R., (2012), The development and implementation of a problem-based learning format in a fourth-year undergraduate synthetic organic and medicinal chemistry laboratory course, J. Chem. Educ., 89, 52–57.
- Gosser D. K. and Roth V., (1998), The workshop chemistry project: peer-led team learning, J. Chem. Educ., 75, 185–187.
- Grove N. P. and Bretz S. L., (2010), Perry's scheme of intellectual and epistemological development as a framework for describing student difficulties in learning organic chemistry, Chem. Educ. Res. Pract., 11, 207–211.
- Grove N. P., Cooper M. M. and Cox E. L., (2012), Does mechanistic thinking improve student success in organic chemistry? J. Chem. Educ., 89, 850–853.
- Grove N. P., Hershberger J. W. and Bretz S. L., (2008), Impact of a spiral organic curriculum on student attrition and learning, Chem. Educ. Res. Pract., 9, 157–162.
- Hailikari T. K. and Nevgi A., (2010), How to diagnose at-risk students in chemistry: case of prior knowledge assessment, Int. J. Sci. Educ., 32, 2079–2095.
- Horn L. and Nuñez A.-M. (2000), Mapping the Road to College: First-Generation Students' Math Track, Planning Strategies, and Context of Support (NCES 2000153), U.S. Department of Education, National Center for Education Statistics, Washington, DC: U.S. Government Printing Office.
- Jurisevic M., Vrtacnik M., Kwiatowski M. and Gros N., (2012), The interplay of students' motivational orientations, their chemistry achievements and their perception of learning within the hands-on approach to visible spectrometry, Chem. Educ. Res. Pract., 13, 237–247.
- Koballa Jr T. R. and Glynn S. M., (2007) in Abell S. K. and Lederman N. (ed.), Handbook for Research in Science Education, New York, NY: Taylor & Francis, ch. 4, pp. 75–102.
- Kraft A., Strickland A. M. and Bhattacharyya G., (2010), Reasonable reasoning: multi-variate problem-solving in organic chemistry, Chem. Educ. Res. Pract., 11, 281–292.
- Lopez E., Kim J., Nandagopal K., Cardin N., Shavelson R. J. and Penn J. H., (2011), Validating the use of concept-mapping as a diagnostic assessment tool in organic chemistry: implications for teaching, Chem. Educ. Res. Pract., 12, 133–141.
- Lopez E. J., Shavelson R. J., Nandagopal K., Szu E. and Penn J., (2014), Factors contributing to problem-solving performance in first-semester organic chemistry, J. Chem. Educ., 91, 976–981.
- Lovecchio K. and Dundes L., (2002), Premed survival: understanding the culling process in premedical undergraduate education, Acad. Med., 77, 719–724.
- Lynch D. J. and Trujillo H., (2011), Motivational beliefs and learning strategies in organic chemistry, Int. J. Sci. Math. Educ., 9, 1351–1365.
- Muthyala R. S. and Wei W., (2013), Does space matter? Impact of classroom space on student learning in an organic-first curriculum, J. Chem. Educ., 90, 45–50.
- Nash J. G., Liotta L. J. and Bravaco R. J., (2000), Measuring conceptual change in organic chemistry, J. Chem. Educ., 77, 333–337.
- Nunnally J. C. and Ator N. A., (1964), Educational Measurement and Evaluation, New York, NY: McGraw-Hill.
- Oke O. K. and Alam G. M., (2010), Comparative evaluation of the effectiveness of 2 and 3D visualizations in students' understanding of structures of organic molecules, Int. J. Phys. Sci., 5, 605–611.
- Parker L. L. and Loudon G. M., (2013), Case study using online homework in undergraduate organic chemistry: results and student attitudes, J. Chem. Educ., 90, 37–44.
- Pascarella E. T., Pierson C. T., Wolniak G. C. and Terenzini P. T., (2004), First-generation college students: additional evidence on college experiences and outcomes, J. Higher Educ., 75, 249–284.
- Paulson D., (1999), Active learning and cooperative learning in the organic chemistry lecture class, J. Chem. Educ., 76, 1136–1140.
- Penn J. H., Nedeff V. M. and Gozdzik G. J., (2000). Organic chemistry and the internet: a web-based approach to homework and testing using the WE_LEARN system, J. Chem. Educ., 77, 227–231.
- Raker J. R. and Towns M. H., (2012), Problem types in synthetic organic chemistry research: implications for the development of curricular problems for second-year level organic chemistry instruction, Chem. Educ. Res. Pract., 13, 179–185.
- Reingold I. D., (2004), Inverting organic and biochemistry: a curriculum tweak that benefits all, J. Chem. Educ., 81, 470–474.
- Richardson M., Abraham C. and Bond R., (2012), Psychological correlates of university students' academic performance: a systematic review and meta-analysis, Psychol. Bull., 138, 353–387.
- Richardson Jr R. and Skinner E. F., (1992), Helping first-generation minority students achieve degrees, New Dir. Commun. Coll., 80, 29–43.
- Rowe M. B., (1983), Getting chemistry off the killer course list, J. Chem. Educ., 60, 954–956.
- Ryan B. J., (2013), Line up, line up: using technology to align and enhance peer learning and assessment in a student centered foundation organic chemistry module, Chem. Educ. Res. Pract., 14, 229–238.
- Stieff M., (2011), When is a Molecule Three Dimensional? A Task-Specific Role for Imagistic Reasoning in Advanced Chemistry, Sci. Educ., 95, 310–336.
- Szu E., Nandagopal K., Shavelson R. J., Lopez E. J., Penn J. H., Scharlberg M. and Hill G. W., (2011), Understanding academic performance in organic chemistry, J. Chem. Educ., 88, 1238–1242.
- Taagepera M. and Noori S., (2000), Mapping students' thinking patterns in learning organic chemistry by the use of knowledge space theory, J. Chem. Educ., 77, 1224–1229.
- Tai R. H., Sadler P. M. and Loehr J. F., (2005), Factors influencing success in introductory college chemistry, J. Res. Sci Teach., 42, 987–1012.
- Tien L. T., Roth V. and Kampmeier J. A., (2002), Implementation of a peer-led team learning instructional approach in an undergraduate organic chemistry course, J. Res. Sci. Teach., 39, 606–632.
- Turner R. C. and Lindsay H. A., (2003), Gender differences in cognitive and noncognitive factors related to achievement in organic chemistry, J. Chem. Educ., 80, 563–568.
- Zimmerman B. J., Bandura A. and Martinez-Pons M., (1992), Self-motivation for academic attainment: the role of self-efficacy beliefs and personal goal setting, Am. Educ. Res. J., 29, 663–676.
- Zoller U., (1990), Students' misunderstandings and misconceptions in college freshman chemistry (general and organic), J. Res. Sci. Teach., 27, 1053–1065.
- Zusho A., Pintrich P. R. and Coppola B., (2003), Skill and will: the role of motivation and cognition in the learning of college chemistry, Int. J. Sci. Educ., 25, 1081–1094.
| This journal is © The Royal Society of Chemistry 2015 |