DOI:
10.1039/C4RA15504A
(Paper)
RSC Adv., 2015,
5, 6111-6122
Surface-functionalized silica aerogels and alcogels for methylene blue adsorption†
Received
29th November 2014
, Accepted 12th December 2014
First published on 12th December 2014
Abstract
Surface-functionalized silica aerogels and alcogels prepared via a two-step sol–gel process through the combination of different silicon precursors were used in the adsorption of methylene blue dye molecules from aqueous media. The effect on the adsorption in batch reactors of the nature of precursors, the solvent used in the adsorbents synthesis, and the pH of the dye solution was monitored. Phenyl-functionalized silica materials revealed the highest adsorption capacity. Two phenyl-modified silica aerogels were widely tested in adsorption under various experimental conditions where the effect of pH, temperature, contact time, initial dye concentration, and adsorbent dose were investigated. The synthesis solvent was found to have a clear effect on the behavior of the adsorbent. Optimal conditions were found at pH 8 and 9 where the adsorbent–adsorbate surface charge interactions and the π–π stacking are most favourable. The adsorption followed a pseudo-second order kinetics, indicative of a co-existing chemisorption and physisorption processes. The adsorption data fitted the Sips isotherm and exhibited for the best aerogel a maximum adsorption capacity of 49.2 mg of dye per gram of adsorbent. The thermodynamic study revealed the adsorption of methylene blue onto phenyl-functionalized silica aerogels to be an exothermic and ordered adsorption process.
1. Introduction
Organic dyes are colored substances that selectively reflect or transmit incident daylight when applied to a substrate.1 Because of their contribution to water toxicity, the removal of these dyestuffs from effluent wastewater is rapidly becoming a primary concern and important target from an environmental and health perspective. Several limitations to reach this aim appear, of which is the large size of these molecules and their high stability as non-biologically oxidizable entities.2 Methylene blue (MB), for instance, is a heterocyclic aromatic dye molecule widely used in the textile industry and in some medical practices,3 although known to cause many well-documented threats to both human beings and animals.4–6
Numerous physical, biological, and chemical conventional techniques were reported to show efficiency in removing organic dyes from aqueous media. This includes adsorption, photocatalytic degradation, chemical decomposition by oxidation, and microbiological discoloration.7,8 Amongst these processes, the physical adsorption at the solid–liquid interface was permanently a conspicuous technique owing to its easiness and low cost, in addition to the availability of several potential adsorbents of which are the metal oxide sol–gel materials.9 The ease in controlling the porosity and surface properties of these adsorbents helps in tuning their affinity to specific adsorbates. Although recent studies focused on the use of alumina,10 silica,2,3,11,12 and titania13 sol–gel materials in general as adsorbents for pollutants from wastewater, very few reported the use of the highly interesting porous aerogels for the treatment of contaminated wastewater with organic dyes.13–16
We investigate herein, for the first time to our knowledge, the use of surface-modified silica aerogels as new class of adsorbents for dyes from wastewater. These solids are synthesized from different combinations of silicon precursors along with various combinations of hydrolysis solvent. The effect of the adsorbate concentrations, adsorbent nature, quantity and particle size, pH and temperature were studied in order to achieve optimal conditions for the adsorption of the dye, at which a complete kinetic and thermodynamic study was conducted.
2. Experimental
2.1. Materials
The chemicals were used in this study as received and without further purification. Tetramethylorthosilicate (C4H12O4Si, TMOS), tetraethylorthosilicate (C8H20O4Si, TEOS), and vinyltriethoxysilane (C8H18O3Si, VTES) were purchased from Fluka Analytical. Phenyltrimethoxysilane (C9H14O3Si, PhTMS), phenyltriethoxysilane (C12H20O3Si, PhTES), and methylene blue (C16H18ClN3S, MB) were purchased form Acros Organics. Hydrochloric acid (HCl, 37%), sulfuric acid (H2SO4, 97%) and ammonium hydroxide (NH4OH, 28.0–30%) were from Panreac, BDH and Fischer-Scientific, respectively. Methanol (CH3OH, 99.9%) and ethanol (C2H5OH, 99.8%) were purchased from Sigma-Aldrich, acetone (CH3COCH3, 99%) from SureChem Products Ltd, and acetonitrile (CH3CN, 99.9%) from Lab-Scan. Dimethyl sulfoxide (C2H6SO, DMSO, 99.5%) and dimethylformamide (C3H7SO, DMF) were acquired from Sigma. Double distilled water was prepared in our laboratory.
2.2. Silica gels synthesis
The experimental procedure presented in ref. 17 and 18 was adopted in the preparation of the materials used in the current study. Tetraalkoxysilanes (Si(OR)4; R = CH3 or C2H5) were used alone in the preparation of the silica gels or combined with other silicon precursors (R′′Si(OR′)3; R′ = CH3 or C2H5; R′′ = C6H5 or C2H3). As well as the silicon precursors change, the synthesis solvent was also varied where methanol, ethanol, acetone, acetonitrile, DMSO, and DMF were used. The molar ratio Si(OR)4
:
R′′Si(OR′)3 was maintained constant at 1
:
0.25 whenever R′′Si(OR′)3 precursors were used. In the first step, silicon precursors were mixed in a polypropylene vial with the solvent, double distilled water and hydrochloric acid solution (0.2 M) under magnetic stirring for 24 h. An ammonium hydroxide solution (0.5 M) was then added and mixed together for 5 min. The vials were closed and kept for gelation and aging. The former was observed in the next 2 hours and the obtained gels were kept for aging for one day at room temperature. After this period, the wet alcogels were either used directly in the adsorption experiments or dried under supercritical carbon dioxide (Tc = 31.1 °C; Pc = 73.7 bar) to obtain the silica aerogels. The supercritical drying step was preceded by a 24 h solvent exchange step, where the alcogels were soaked in acetone in order to exchange the residual water and solvent in the gel with acetone exhibiting a higher miscibility with liquid carbon dioxide. The final molar ratios Si(OR)4
:
solvent
:
H2O
:
HCl
:
NH3 were 1
:
12
:
6
:
3 × 10⁻³
:
6 × 10⁻³ for the gels where TMOS or TEOS were used alone as silicon precursors, whereas the ratios Si(OR)4
:
R′′Si(OR′)3
:
solvent
:
H2O
:
HCl
:
NH3 were 0.8
:
0.2
:
12
:
6
:
3 × 10⁻³
:
6 × 10⁻³ for the other gels. The amount of silica was chosen to be 3 mmol for all samples, thus giving final gel volumes of 2.5 to 3.0 mL.
2.3. Silica gels characterization
The aerogels were characterized after supercritical drying whereas the characterization of the alcogels was done after soaking them in liquid nitrogen twice, for 10 min each, followed by a freeze-drying for 24 h. This step allows the removal of the solvent existing within the pores without affecting the network structure. Nitrogen adsorption–desorption technique was performed using a Nova 2200e high speed surface area analyzer (Quantachrome instruments) to measure the specific surface area (SSA) according to the BET theory19 while the pore size and volume were calculated by the BJH method.20 Prior to N2 adsorption, the samples were degassed for 2 h at 120 °C. The structural characterization of the silica gels was carried out using a Thermo Nicolet 4700 Fourier Transform Infrared Spectrometer equipped with a Class 1 Laser. The measurements were performed in the 4000–400 cm−1 range using the transmission KBr pellet technique. Scanning electron microscopy was carried out on a Tescan Scanning Electron Microscope at high voltage of 30 kV after sputter-coating the samples with a thin layer of gold.
2.4. Adsorption studies
All adsorption experiments were performed in glass vials under shaking in a Julabo SW 23 controlled-temperature water bath operating at 160 rpm in dark. In a typical adsorption experiment, an initial amount of adsorbent was dropped in 30 mL of a 15 mg L−1 methylene blue dye solution, at set pH and temperature. Aliquots were carefully withdrawn at pre-determined time intervals over 4 h, and the MB concentration was determined by measuring the absorbance of the solution at the maximum absorption wavelength (λ = 664 nm) using a Thermo Scientific Evolution 300 UV/VIS/NIR spectrophotometer. The aliquots were centrifuged whenever small gel particles were present using a Thermo Scientific Heraeus Pico 17 centrifuge. The amount of adsorbed dye on the solids was calculated according to the following equation: |
 | (1) |
where qe is the amount of dye adsorbed at equilibrium (mg g−1), Ci and Ce are the initial and equilibrium liquid-phase concentrations of dye (mg L−1) respectively; V is the volume of solution (L) and m is the amount of adsorbent (g).
Because it was impossible to measure the exact weight of the alcogels due to the existence of the solvent within the pores, the as-synthesized alcogels (volume approximately 2.5–3.0 mL) were dropped in the solution. These materials were used as a stepping-stone to pinpoint the best precursor/co-precursor/solvent combination preceding the more specific work on aerogels. The aerogels were weighed accurately and their masses were recorded before their use as adsorbents of dye from aqueous media.
The effect on adsorption of silicon precursors, solvent used in the synthesis of the gels, and temperature was studied. The effect of pH was investigated after the adjustment of the pH of the methylene blue solutions using dilute H2SO4 and NH4OH solutions and a Corning Pinnacle 542 pH conductivity meter with a combined pH electrode. In order to evaluate the effect of the size of the adsorbing material on its efficiency crushed and uncrushed adsorbents were compared. The initial dye concentration was studied in the range between 1 and 300 ppm, and the dosage of the silica aerogels was investigated in the 20 to 600 mg range.
3. Results and discussion
3.1. Adsorbents characterization
Nitrogen adsorption–desorption isotherms were performed on prepared alcogels and aerogels. However, the data corresponding to the alcogels is not discussed here as we believe that the surface properties and porosity are very similar for both materials with the latter being only filled with the solvent and liquids used in its synthesis. The aerogels exhibited type IV isotherms as per the IUPAC classification of isotherms,21,22 typical for mesoporous materials with H2 hysteresis loops associated with the occurrence of pore condensation, or “ink bottle” pores.18,23
The FTIR spectra performed for phenyl-functionalized and non-functionalized silica aerogels revealed a noticeable difference attributed to the existence of phenyl groups in the solid network. Table 1 shows the vibration frequencies obtained for both categories of aerogels where characteristic peaks of surface phenyl groups appear for functionalized samples in contrast to the non-functionalized ones.17 This indicates the successful surface phenyl-functionalization whenever phenyltrialkoxysilane precursors are used in the synthesis. Characteristic vibrations corresponding to the bulk siliceous structure appear for both categories without any noticeable difference.
Table 1 Characteristic vibration frequencies (cm−1) in FTIR spectra of different synthesized non-functionalized and phenyl-functionalized silica aerogels
Non functionalized gels |
Phenyl-functionalized gels |
Type of vibration |
Structural Unit |
3460 |
3440 |
O–H and SiO–H |
H–O–H⋯H2O and SiO–H⋯H2O |
2910 |
2900 |
νsC–H |
–CH3 |
2840 |
2830 |
νasC–H |
–CH2 |
1630 |
1630 |
δH–O–H |
H–O–H |
1420 |
νC C + δC–H in plane 2νSi–C |
Si–Ph |
∼1200 |
1130 |
νasSi–O–Si (LO mode) |
Si–O–Si![[triple bond, length as m-dash]](https://www.rsc.org/images/entities/char_e002.gif) |
1070 |
1070 |
νasSi–O–Si (TO mode) |
Si–O–Si![[triple bond, length as m-dash]](https://www.rsc.org/images/entities/char_e002.gif) |
951 |
947 |
νβSi–O |
Si–O |
789 |
785 |
νsSi–O |
Si–O–Si![[triple bond, length as m-dash]](https://www.rsc.org/images/entities/char_e002.gif) |
739 |
ωδ,γC–H |
Si–Ph |
696 |
ΦC–H |
Si–Ph |
531 |
544 |
νSi–O |
SiO2 defects |
∼476 |
ΦC–H |
Si–Ph |
457 |
450 |
δO–Si–O |
–O–Si–O– |
Scanning electron microscopy (SEM) micrographs reveal the porous structure of the various phenyl-modified aerogels where silica aggregates and large interconnected pores appear. The micrographs clearly show a “spongy” porous structured material, confirming the high porosity of the obtained silica aerogels. SEM micrographs obtained for a representative aerogel are shown in Fig. 1.
 |
| Fig. 1 SEM images of TEOS-PhTMS aerogel synthesized in acetonitrile. | |
3.2. Effect of pH and silicon precursors on adsorption
Determining the effect of the surface functionalization of silica gels and the variation of the silicon precursors on the adsorption of methylene blue was studied. Three different gels made according to the procedure described in previous sections were synthesized in order to understand the correlation between MB adsorption and surface functionalization of the silica gels in which TEOS was solely used as silicon precursor or coupled with VTES or PhTES as co-precursors. Methanol was used for all gels as synthesis solvent. A study of the pH effect on the adsorption of the dye onto those three alcogels was conducted at 30 °C where the pH was varied between 2 and 10. It is worth mentioning at that point that, as mentioned in Section 2.4, all adsorption tests were performed in dark in order to eliminate any doubt of MB photodegradation being responsible of the MB decrease in the medium. Furthermore, MB solutions kept under the same conditions without the existence of any adsorbent, showed no changes in the MB concentration over time.
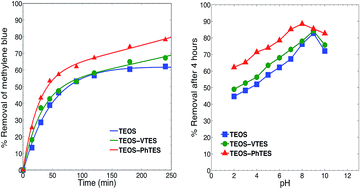
The difference between alcogels and xerogels was also investigated. Alcogels were used after aging at room temperature for 48 h whereas the xerogels were left for 10 days before use resulting in denser, shrunk, glass-like solids. As expected, the xerogels showed very little adsorptive capacity with respect to the alcogels due to the decrease in their porosity; therefore studying the adsorption capacity of the xerogels was found not to be of interest. The UV-Vis measurements showed an increasing percent removal of the dye with increasing pH after 4 hours, with a maximum adsorption at pH 8 and 9 (Fig. 2). The surface functionalization of the silica alcogels also had a crucial impact on the adsorptive capacity with the TEOS-PhTES alcogel being the best at almost all pHs, with clear maxima at pH 8 and 9.
 |
| Fig. 2 (a) % removal of methylene blue as a function of time for TEOS, TEOS-VTES and TEOS-PhTES alcogels synthesized in methanol solvent. Initial methylene blue concentration = 15 mg L−1; contact time = 4 h; solution volume = 30 mL, pH = 6. (b) Effect of pH on adsorption of methylene blue onto silica alcogels. Initial methylene blue concentration = 15 mg L−1; contact time = 4 hours; solution volume = 30 mL. | |
The difference in the adsorption capacity at different pHs can easily be attributed to the surface charge of the adsorbent. The point of zero charge (PZC) of silica is around 2.5,24 meaning that for lower pH it exhibits a positive zeta potential resulting in a positively charged surface of the adsorbent. This has a negative impact on the dye adsorption due to the electrostatic repulsion between the adsorbent surface and the positively charged methylene blue monomer MB+. Following the same reasoning, the adsorption capacity of the solids should be higher with an increase in the pH due to the abundance of negative surface charges on the adsorbent which favors the electrostatic attraction between the negatively charged Si–O− surface groups and the positively charged MB+ dye monomer.
On the other hand, the difference in the adsorption capacities of the three different silica alcogels can be explained by the difference in the intermolecular forces between the different surface groups and the dye monomer. Fig. 3 shows the surface of the gels, where TEOS is solely used as silicon precursor (a), or coupled with VTES (b) and PhTES (c) as co-precursors. When TEOS alcogels are used in adsorption, the surface silanol groups (Si–OH) make for a strong hydrogen bonding between the gel and the MB+ dye monomer, whereas in the case of TEOS-VTES alcogels, the presence of vinyl surface groups in addition to silanols allow for an additional good π electrons attractions and thus a superior attraction between the dye molecules and the alcogel surface groups. The aromatic rings on the surface of phenyl-functionalized gels (TEOS-PhTES) offer a superior degree of delocalization due to the π–π stacking of the phenyl surface groups and the aromatic rings of the dye molecule. Thus, comparing these three surface–dye interactions, the latest was expected to show the highest adsorption capacity; this was confirmed experimentally where we found the phenyl-functionalized alcogel to be the best adsorbent in the whole pH range whereas the non-functionalized solid exhibited the weakest adsorption capacity. Based on these results, phenyl-functionalized gels were selected for adsorption study in the following sections.
 |
| Fig. 3 Surface-functionalized silica gels. (a) TEOS used as only silicon precursor, (b) TEOS-VTES co-precursors, (c) TEOS-PhTES co-precursors. | |
These findings confirm the superiority of phenyl-functionalized silica adsorbents recently reported in the literature for various applications.25–28 However, the current work is unique in terms of use of phenyl-functionalized silica aerogels for dye adsorption, which are reported herein for the first time.
3.3. Effect of synthesis solvent
In order to explore the full potential of the phenyl co-precursor, alcogels with combinations of TMOS, TEOS, PhTMS and PhTES as precursors were synthesized. Along with these precursors combinations, various solvents such as methanol, ethanol, acetone, acetonitrile, DMSO, and DMF were used in the synthesis of the gel. The experiment showed that only three of these solvents resulted in successful gelation of the sol, namely methanol, acetone and acetonitrile. Consequently, the rest of the study was conducted with gels prepared with one of these three solvents, while the others were discarded. A comprehensive listing of the synthesized gels is presented in Table 2.
Table 2 Precursor/co-precursor/solvent composition of the different surface-modified silica gels
Sample |
Composition |
Solvent |
M1 |
TMOS |
Methanol |
M1′ |
TMOS |
Acetone |
M1′′ |
TMOS |
Acetonitrile |
M2 |
TMOS-PhTMS |
Methanol |
M2′ |
TMOS-PhTMS |
Acetone |
M2′′ |
TMOS-PhTMS |
Acetonitrile |
M3 |
TMOS-PhTES |
Methanol |
M3′ |
TMOS-PhTES |
Acetone |
M3′′ |
TMOS-PhTES |
Acetonitrile |
E1 |
TEOS |
Methanol |
E1′ |
TEOS |
Acetone |
E1′′ |
TEOS |
Acetonitrile |
E2 |
TEOS-PhTMS |
Methanol |
E2′ |
TEOS-PhTMS |
Acetone |
E2′′ |
TEOS-PhTMS |
Acetonitrile |
E3 |
TEOS-PhTES |
Methanol |
E3′ |
TEOS-PhTES |
Acetone |
E3′′ |
TEOS-PhTES |
Acetonitrile |
Adsorption experiments were conducted on each of the aforementioned 18 alcogels at pHs between 4 and 10 in order to reassert the pH effect in combination with the different solvents and precursor combinations, as a first step for the forthcoming work on aerogels in this study. The pH range was chosen so that the methylene blue is in its cationic monomeric form (MB+) and the silica solids are above their PZC.
The solvent was found to play a crucial role in the resulting adsorptive capacities of the gels (Fig. 4), implying a direct correlation between the surface properties of the materials and the polarity of the used solvent. Out of the three solvents being studied, the aprotic acetonitrile is known to be the most polar, followed closely by the protic methanol and the aprotic acetone.29 These characteristics play an important role in the synthesis process, having an impact on the precursors' hydrolysis and condensation rate constants kH and kC, respectively.9,30 During hydrolysis, it is known that kH increases linearly with the concentration of [H+] in the medium.31 Moreover, it was also shown through 29Si NMR that the solvent has a secondary important effect on the hydrolysis rate constant, being the highest in acetonitrile, then in order of decreasing kH: methanol, dimethylformamide, dioxane, and formamide.31
 |
| Fig. 4 % removal of methylene blue after 4 h for alcogels synthesized in different solvents with different silicon precursors, at different pHs: (a) pH = 4; (b) pH = 5; (c) pH = 6; (d) pH = 7; (e) pH = 8; (f) pH = 9 and (g) pH = 10. Initial methylene blue concentration = 15 mg L−1; contact time = 4 hours; solution volume = 30 mL. | |
The nature of the solvent not only plays a role in the hydrolysis step, but it also affects the sol condensation and gelation. However, scientists seem to agree that a trend exists dictating that the larger the size of the solvent molecule is, the longer is the gelation time.30 Brinker and Scherer9 argue that polar protic solvents, such as methanol in the current study, offer the possibility of hydrogen bonding to the anionic nucleophile SiO− involved in the condensation reaction thus making it less nucleophilic. This is not the case for polar aprotic solvents such as acetone and acetonitrile. However, due to their relatively high polarity, this nucleophile is stabilized with respect to the activated complex, which results in slowing down the reaction.
After a thorough analysis of the significant amount of results obtained, the study was narrowed down to nine silicon precursors-solvent combinations to be tested as aerogels in adsorption at the best 2 pHs. The selection was made based on the results obtained at the best two pHs (8 and 9) where we selected the best nine solids that exhibit the highest percent adsorption after 4 h of contact time between the adsorbent and adsorbate. The selected aerogels are: TMOS-PhTMS in methanol (M2) and acetonitrile (M2′′), TMOS-PhTES in methanol (M3), TEOS in acetone (E1′), TEOS-PhTMS in methanol (E2), acetone (E2′), and acetonitrile (E2′′), TEOS-PhTES in methanol (E3) and in acetonitrile (E3′′). The difference in the adsorptive capacity of the studied aerogels (Fig. 4) indicates that the synthesis solvent still plays a crucial role in the adsorption process, even after it has been completely removed during the CO2 supercritical drying step. The comparison of the obtained adsorption results revealed one silicon precursors combination (TEOS-PhTMS) to be the best at both pHs, where the synthesis solvent was acetonitrile for the best aerogels at pH 8 (E2′′) whereas acetone was used in the synthesis of the aerogel having the highest adsorption capacity at pH 9 (E2′).
3.4. Effect of crushing the gels on adsorption
The effect on adsorption of crushing or uncrushing the gel was studied for alcogels and aerogels alike. To do so, TEOS-PhTMS in acetonitrile (E2′′) and TEOS-PhTMS in acetone (E2′) were prepared as alcogels and aerogels to be used in adsorption. The first adsorbent was tested at pH 8 whereas the second was used at pH 9 according to the results reported in the previous sections. To study the effect of crushing the adsorbent (either alcogel or aerogel) on its adsorptive capacity, the gels were either dropped whole in the solution or crushed into small pieces (powder in the case of aerogels). The masses of the adsorbents were kept constant in the adsorption experiments where 100 mg of the aerogels were used. However since it is extremely difficult to get an accurate mass reading for the alcogel due to the large amount of solvent and water present in the gel matrix (TGA measurements were not possible because of the fast evaporation of the solvents from the alcogel pores), the full amount of gel prepared in one propylene vial was used per experiment. The results showed that the physical aspect of the adsorbent, crushed or uncrushed, has a very pronounced effect on the adsorptive capacity of both alcogels and aerogels (Fig. 5), with the effect being more noticeable when aerogels are used. Crushing the gel affects the kinetics of the adsorption process, making it significantly faster as well as increasing the final adsorptive capacity of the gel at equilibrium. This behavior is due to the drastic increase of the contact surface area in the case of crushed adsorbents making the adsorption sites more easily accessible by the methylene blue molecules; a very simple yet very important observation. The comparison of the adsorption capacities of crushed aerogels to that of crushed alcogels revealed a much higher adsorption for the former adsorbents. This can be due to the easier diffusion of the dye molecules within the free pores of the aerogel whereas the diffusion is not easy when the pores are filled with the solvent and water used in the alcogel synthesis. Accordingly, aerogels after being crushed were selected to conduct the adsorption experiments in the following sections.
 |
| Fig. 5 Comparison of the % adsorption of E2′′ at pH 8 and E2′ at pH 9 crushed and uncrushed (a) alcogels and (b) aerogels at t = 5 min and t = 4 hours. Initial aerogel dose = 100 mg; initial methylene blue concentration = 15 mg L−1; contact time = 4 hours; solution volume = 30 mL. | |
3.5. Effect of initial methylene blue concentration
The methylene blue adsorption capacity of the best two aforementioned aerogels has been studied as a function of the dye initial concentration. The methylene blue solution concentration was adjusted between 1 and 300 ppm, the pH to optimal conditions (8 for E2′′ aerogel and 9 for E2′ aerogel), and the temperature was set at 30 °C. The MB concentrations were found to be almost unchanged after 4 h of experiments, thus the reactions are considered to reach equilibrium after 4 h of contact time. It is worth mentioning that the studied methylene blue concentrations were below the dye solubility limit in water, which implies that the decrease in dye concentration over time is due solely to its adsorption on the surface of the gel and not to the recrystallization of the MB salt. Fig. 6 shows the change of percent adsorption of methylene blue at equilibrium while increasing the initial dye concentration, as well as the adsorptive capacity qe of both aerogels. An interesting observation is that even though the E2′′ aerogel at pH 8 presents a higher percent adsorption especially at relatively low concentrations, the equilibrium adsorption capacity qe has been found to be very similar for both aerogels at relatively low concentrations, whereas for concentrations greater than 100 ppm, a clear detachment of the two curves can be observed. For instance, at 300 ppm, the difference is even more pronounced with the E2′ aerogel at pH 9 showing a much higher adsorptive capacity than the E2′′ aerogel at pH 8 (39.1 and 29.7 mg g−1, respectively).
 |
| Fig. 6 Plot of the effect of initial concentration variation, relating both the equilibrium adsorptive capacity (left y-axis, in mg g−1) and the % adsorption after 4 hours (right y-axis) to the initial concentration of methylene blue solution (mg L−1). Initial aerogel dose = 100 mg; contact time = 4 hours; solution volume = 30 mL. | |
3.6. Methylene blue adsorption isotherms
Collected adsorption data at various methylene blue concentrations ranging between 1 and 300 ppm were fitted with seven adsorption models, namely Langmuir,32 Freundlich,33 Temkin,34 Dubinin–Radushkevich,35 Redlich–Peterson,36 Toth,37 and Sips38,39 isotherm models.
The Langmuir isotherm equation is represented by:
|
 | (2) |
where
qmax is the monolayer adsorption capacity of the adsorbent (mg g
−1) and
KL is the Langmuir equilibrium constant (L mg
−1).
The Freundlich isotherm is represented by the equation:
where
n and
KF are the heterogeneity factor (generally greater than 1 and an indication of the linearity of the adsorption isotherm; the greater the value the more non-linear the isotherm and the greater the heterogeneity of the system) and the Freundlich constant (L g
−1) respectively, both are temperature dependent.
The Temkin isotherm equation is represented by:
|
 | (4) |
where
R is the universal gas constant (8.3145 J mol
−1 K),
T is the absolute temperature,
bT is the variation of the adsorption energy (J mol
−1) and
KT is the equilibrium binding constant (L g
−1).
Similar to the Langmuir isotherm but without assuming a homogeneous surface or constant sorption potential, the Dubinin–Radushkevich (D–R) equilibrium isotherm is represented by the following equation:
|
qe = qmax exp(−βε2)
| (5) |
where
qmax is the D–R monolayer capacity (mg g
−1),
β is a constant related to the adsorption energy (mol
2 kJ
−2), and
ε is the Polanyi potential related to the equilibrium concentration as follows:
|
 | (6) |
D–R isotherm allows for the determination of the mean free energy of adsorption (E, J mol−1), which can be calculated according to the following relationship:
|
 | (7) |
A slightly more complex isotherm is the Redlich–Peterson (R–P) equilibrium isotherm that can be expressed as follows:
|
 | (8) |
where
KR and
aR are Redlich–Peterson isotherm constants (L g
−1 and (L mg
−1)
bR respectively, and
bR is the R–P isotherm exponent. It is worth mentioning that this isotherm is a hybrid model featuring Langmuir and Freundlich isotherms. At low concentrations, the Redlich–Peterson isotherm approximates the ideal Langmuir model, while at high concentration it behaves similarly to the Freundlich isotherm.
40
Derived from potential theories, the Toth isotherm can be expressed by:
|
 | (9) |
where
Kt (L g
−1) and
at are the Toth isotherm constants and
t is the Toth isotherm exponent. The main premise of that equilibrium isotherm is that it assumes that most sites have a sorption energy less than the mean value.
41
The last isotherm that the experimental data were fitted with was the generalized Sips equilibrium isotherm, expressed by the following equation:
|
 | (10) |
where
as is the Sips isotherm constant and
nS is the Sips isotherm exponent.
The Langmuir, Freundlich, Temkin, Dubinin–Radushkevich, Redlich–Peterson, Toth and Sips isotherm constants were computed by fitting the experimental data with the corresponding model. These constants as well as their non-linear correlation coefficients (R2) are regrouped in Table 3. The data comparison shows clearly that the three-parameter Sips equilibrium isotherm represents the best fit of the experimental results for both adsorbents. Theoretically calculated maximum monolayer capacities (qmax) from Sips isotherm model were found to be 33.7 mg g−1 for E2′′ aerogel in a methylene blue solution at pH 8, and 49.2 mg g−1 for E2′ aerogel in a pH 9 dye solution.
Table 3 Langmuir, Freundlich, Temkin, Dubinin–Radushkevich, Redlich–Peterson, Toth and Sips isotherm constants compiled for E2′′ and E2′ aerogels at their respective optimum pHs
|
Langmuir isotherm |
|
qmax (mg g−1) |
KL (L mg−1) |
R2 |
E2′′ aerogel pH 8 |
43.36 |
0.009723 |
0.984 |
E2′ aerogel pH 9 |
68.15 |
0.005269 |
0.992 |
|
Freundlich isotherm |
|
n |
KF (L g−1) |
R2 |
E2′′ aerogel pH 8 |
1.781 |
1.443 |
0.938 |
E2′ aerogel pH 9 |
1.475 |
0.9552 |
0.971 |
|
Temkin isotherm |
|
bT (J mol−1) |
KT (L g−1) |
R2 |
E2′′ aerogel pH 8 |
392 |
0.2677 |
0.887 |
E2′ aerogel pH 9 |
328.5 |
0.2343 |
0.854 |
|
Dubinin–Radushkevich isotherm |
|
β (mol2 kJ−2) |
qmax (mg g−1) |
E (kJ mol−1) |
R2 |
E2′′ aerogel pH 8 |
0.0002628 |
28.86 |
43.62 |
0.953 |
E2′ aerogel pH 9 |
0.0004606 |
36.52 |
32.95 |
0.949 |
|
Redlich–Peterson isotherm |
|
KR (L g−1) |
aR (L mg−1)bR |
bR |
R2 |
E2′′ aerogel pH 8 |
0.2969 |
9.33 × 10⁻⁵ |
1.754 |
0.987 |
E2′ aerogel pH 9 |
0.277 |
2.03 × 10⁻⁵ |
1.922 |
0.988 |
|
Toth isotherm |
|
Kt (L g−1) |
at |
t |
R2 |
E2′′ aerogel pH 8 |
9056 |
279.2 |
0.5588 |
0.991 |
E2′ aerogel pH 9 |
2436 |
375.2 |
0.6665 |
0.994 |
|
Sips isotherm |
|
qmax |
as |
ns |
R2 |
E2′′ aerogel pH 8 |
33.69 |
0.01641 |
1.47 |
0.994 |
E2′ aerogel pH 9 |
49.18 |
0.00997 |
1.337 |
0.997 |
3.7. Effect of adsorbent dose
The effect of the quantity of aerogel used for adsorption was studied at 30 °C. Adsorbent masses ranged between 20 and 600 mg per experiment. The pH was adjusted to the optimal values 8 (for E2′′ aerogel) and 9 (for E2′ aerogel). UV-VIS spectroscopic measurements showed that the maximum adsorption values after 4 hours were obtained at doses of 50 and 100 mg of adsorbent for both gels.
The plot of the relative amount of dye qe (in mg of dye per g of adsorbent) versus the quantity of adsorbent shows a decrease in qe as the quantity of adsorbent increases (Fig. 7a). The plot of 1/qe versus the adsorbent quantity gave a linear plot (Fig. 7b), which reveals that adsorption sites are available when large adsorbent quantities are used as well as when small quantities are used.13 For instance, 50 mg of TEOS-PhTMS in acetonitrile at pH 8 and 50 mg of TEOS-PhTMS in acetone at pH 9 are able to remove 94 and 91% of methylene blue molecules existing in 30 mL of a 15 mg L−1 dye solution, respectively.
 |
| Fig. 7 (a) Plot of qe vs. m; (b) plot of 1/qe vs. m for E2′′ at pH 8 and E2′ at pH 9 aerogels. Initial aerogel dose = 20–600 mg; initial methylene blue concentration = 15 mg L−1; contact time = 4 hours; solution volume = 30 mL. | |
3.8. Adsorption kinetics
The adsorption kinetics were studied in the 30–60 °C temperature range. However, because the results obtained are similar, we selected to present only those corresponding to the experiments performed at 30 °C. The dye adsorption kinetics was monitored over 4 h and the experimental data were fitted to four kinetic models, namely first, second, pseudo-first, and pseudo-second orders.
The integrated first order equation is
with
Ct being the methylene blue concentration (mg L
−1) at time
t (min),
Ci the initial MB concentration (mg L
−1) and
k1 the first order rate constant (min
−1).
The integrated second order equation is:
|
 | (12) |
with
k2 being the second order rate constant (L mg
−1 min
−1).
The pseudo-first order equation can be expressed as:
where
qe is the adsorption capacity of the silica aerogel at equilibrium (mg g
−1),
qt is the amount of dye adsorbed (mg g
−1) at time
t (min) and
k1′ is the pseudo-first order rate constant (min
−1).
The pseudo-second order equation can be written as follows:
|
 | (14) |
where
k2′ is the pseudo-second order rate constant (g mg
−1 min
−1).
The linear fitting of the results to the first and second order models, and the non-linear fitting to the pseudo-first and pseudo-second models (Fig. 8) indicate beyond doubt that the pseudo-second order model fits perfectly with the experimental data with correlation coefficients (R2) greater than 0.9968. This result gives some insight into the adsorption mechanism, suggesting that the adsorption depends on the adsorbate as well as the adsorbent, involving both chemisorption and physisorption processes.
 |
| Fig. 8 (a) Linear first order; (b) linear second order; (c) non-linear pseudo-first order and (d) non-linear pseudo-second order kinetics plots for adsorption of methylene blue by E2′′ at pH 8 and E2′ at pH 9 aerogels. Initial aerogel dose = 100 mg; initial methylene blue concentration = 15 mg L−1; contact time = 4 hours; solution volume = 30 mL. | |
3.9. Effect of temperature
Adsorption experiments were performed at 4 different temperatures: 30, 40, 50 and 60 °C in order to study the effect of temperature on the MB removal. The activation energy (Ea) for the adsorption of dye onto the surface of selected aerogels was calculated from the rate constants (k2) obtained for the reactions performed at each temperature. Arrhenius equation was used for this purpose:where A is the Arrhenius frequency factor, R is the ideal gas constant (8.314 J mol−1 K−1) and T is the adsorption temperature (K). Plotting ln
k2 vs. 1/T (Fig. 9) allowed us to calculate the value of Ea which was found to be 49.4 kJ mol−1 for E2′′ at pH 8, and 32.2 kJ mol−1 for E2′ at pH 9. Both values exist at the interface between physisorption (5–40 kJ mol−1) and chemisorption (40–800 kJ mol−1) ranges42 which suggests that both adsorption phenomena do take place, a revelation that is in excellent agreement with what was discussed in previous sections.
 |
| Fig. 9 Plot of ln k vs. 1/T for E2′′ at pH 8 and E2′ at pH 9 aerogels. Initial aerogel dose = 100 mg; initial methylene blue concentration = 15 mg L−1; contact time = 4 hours; solution volume = 30 mL. | |
3.10. Thermodynamic study
The change in Gibbs free energy ΔG° of the adsorption can be calculated according to the following equation: |
ΔG° = −RT ln KC
| (16) |
where KC is the equilibrium constant, calculated as the ratio of the concentration of dye on adsorbent at equilibrium (qe) to the remaining concentration of dye at equilibrium (Ce). The equilibrium was considered attained after 4 hours. |
 | (17) |
It is worth mentioning that a slight decrease in the value of KC was noted with increase in temperature, indicating that the adsorption is thermodynamically stable.43
On the other hand, ΔG° can also be calculated from the following equation:
where Δ
H° is the change in the enthalpy of adsorption and Δ
S° is the change in the entropy. The combination of
eqn (16) and
(18) leads to the Van't Hoff equation which can be expressed as follows:
|
 | (19) |
Plotting ln
KC vs. 1/T allows the calculation of ΔH° and ΔS° from the slope and the intercept of the linear plot, respectively (Fig. 10). The results show that the enthalpy of adsorption ΔH° was −86.9 kJ mol−1 and ΔS° was −264.6 J mol−1 K−1 for E2′′ at pH 8, and −17.6 kJ mol−1 and −51.1 J mol−1 K−1, respectively for E2′ at pH 9. The standard free energy change ΔG° was calculated, using eqn (19), to be −6.7 kJ mol−1 for the first and −2.1 kJ mol−1 for the second at 30 °C. These value indicate that the adsorption is spontaneous at that temperature, the negative value of ΔH° is a reflection of an exothermic process and a further indication that adsorption is favored at low temperature, and the negative entropy suggests that the methylene blue molecules were orderly adsorbed on the surface of the silica aerogel. The negative values of ΔH° and ΔS° indicate that the adsorption will be spontaneous even at lower temperatures.44
 |
| Fig. 10 Plot of ln KC vs. 1/T for E2′′ at pH 8 and E2′ at pH9 aerogels. Initial aerogel dose = 100 mg; initial methylene blue concentration = 15 mg L−1; contact time = 4 hours; solution volume = 30 mL. | |
4. Conclusion
A complete and detailed adsorption study of methylene blue from a simulated wastewater onto highly porous phenyl-functionalized silica aerogels was performed where the effect of various parameters was tested and resulted in suggestions of kinetic and thermodynamic models for the process. The characterization of these materials revealed their mesoporous character and that functionalization by adding surface functional groups without altering the core structure of the gel was successful. The study of various silicon precursors showed that the combination with the highest adsorption capacity was TEOS-PhTMS, as the phenyl surface functional group offers a high degree of delocalization, with π–π stacking of the aromatic rings on the surface of the gel and the aromatic groups of the methylene blue dye. Varying the solvent in which the gel is synthesized had a notable effect on its adsorption capacity, however no clear trend could be found. Adsorption studies showed that these surface functionalized silica aerogels are highly efficient methylene blue adsorbents. Out of this preliminary all-inclusive study, two aerogels and two pHs came out on top and proved to be the best adsorbents: TEOS-PhTMS in acetonitrile solvent at pH 8 and TEOS-PhTMS in acetone solvent at pH 9. Extremely fast adsorption of the dye was noticed within the first 30 minutes of the experiment (more than 70% of the initial dye amount on 100 mg of gel). Adsorbent bulk size has proven to be a crucial factor in the adsorption, as crushing the aerogel particles into a fine powder made the adsorption extremely faster due to the increase in contact surface area between the gel and the dye solution. The experimental adsorption data fitted with theoretical models met the Sips adsorption isotherm model and showed that the TEOS-PhTMS in acetonitrile at pH 8 gel is able to adsorb up to 33.7 mg of methylene blue solution per gram of adsorbent, and that the TEOS-PhTMS in acetone at pH 9 gel is able to adsorb up to 49.2 mg of dye per gram of adsorbent. The kinetics of the experiments showed that they follow a pseudo-second order kinetic model indicating the concomitance of chemisorption and physisorption in the adsorption process. The thermodynamic study revealed an exothermic and ordered adsorption process. In conclusion, this study showed the phenyl-functionalized silica aerogel to be a highly efficient adsorbing material for methylene blue, highly customizable, fine-tunable and economically very attractive.
Acknowledgements
The authors gratefully acknowledge the financial support of this work by the Lebanese National Council for Scientific Research (CNRS) through a research grant. The authors are also thankful for the Kamal A. Shair Central Research Science Lab (KAS CRSL) of the Faculty of Arts and Sciences at AUB.
References
- E. A. Clarke and R. Aliker, in The Handbook of Environmental Chemistry, ed. O. Huzinger, Springer-Verlag Berlin Heidelberg GmbH, 1980, vol. 3, pp. 181–214 Search PubMed.
- R. W. Gaikwad and S. A. Misal, Int. J. Chem. Eng. Appl., 2010, 1, 342–345 CAS.
- M. Chen, Y. Chen and G. Diao, J. Chem. Eng. Data, 2010, 55, 5109–5116 CrossRef CAS.
- D. Ghosh and K. G. Bhattacharyya, Appl. Clay Sci., 2002, 20, 295–300 CrossRef CAS.
- B. H. Hameed, A. T. M. Din and A. L. Ahmad, J. Hazard. Mater., 2007, 141, 819–825 CrossRef CAS PubMed.
- M. Rafatullah, O. Sulaiman, R. Hashim and A. Ahmad, J. Hazard. Mater., 2010, 177, 70–80 CrossRef CAS PubMed.
- H. Lachheb, E. Puzenat, A. Houas, M. Ksibi, E. Elaloui, C. Guillard and J.-M. Herrmann, Appl. Catal., B, 2002, 39, 75–90 CrossRef CAS.
- E. Forgacs, T. Cserháti and G. Oros, Environ. Int., 2004, 30, 953–971 CrossRef CAS PubMed.
- C. Brinker and G. Scherer, Sol-Gel Science: The Physics and Chemistry of Sol-Gel Processing, Academic, 1990 Search PubMed.
- C. Kannan, T. Sundaram and T. Palvannan, J. Hazard. Mater., 2008, 157, 137–145 CrossRef CAS PubMed.
- F. A. Pavan, S. L. P. Dias, E. C. Lima and E. V. Benvenutti, Dyes Pigm., 2008, 76, 64–69 CrossRef PubMed.
- H. Hirashima, H. Imai and Y. Fukui, J. Sol-Gel Sci. Technol., 2003, 26, 383–388 CrossRef CAS.
- L. Abramian and H. El-Rassy, Chem. Eng. J., 2009, 150, 403–410 CrossRef CAS PubMed.
- G. Liu, R. Yang and M. Li, J. Non-Cryst. Solids, 2010, 356, 250–257 CrossRef CAS PubMed.
- J. M. Rankin, S. Baker and K. J. Klabunde, Microporous Mesoporous Mater., 2014, 190, 105–108 CrossRef CAS PubMed.
- G. Zu, J. Shen, W. Wang, L. Zou, Y. Lian, Z. Zhang, B. Liu and F. Zhang, Chem. Mater., 2014, 26, 5761–5772 CrossRef CAS.
- R. Al-Oweini and H. El-Rassy, J. Mol. Struct., 2009, 919, 140–145 CrossRef CAS PubMed.
- R. Al-Oweini and H. El-Rassy, Appl. Surf. Sci., 2010, 257, 276–281 CrossRef CAS PubMed.
- S. Brunauer, P. H. Emmett and E. Teller, J. Am. Chem. Soc., 1938, 60, 309–319 CrossRef CAS.
- E. P. Barrett, L. G. Joyner and P. P. Halenda, J. Am. Chem. Soc., 1951, 73, 373–380 CrossRef CAS.
- S. Lowell, Characterization of porous solids and powders: surface area, pore size and density, Springer, 2004 Search PubMed.
- R. A. Pierotti and J. Rouquerol, Pure Appl. Chem., 1985, 57, 603–619 Search PubMed.
- R. J. Hunter, Zeta potential in colloid science: principles and applications, Academic press London, 1981 Search PubMed.
- H. Ramadan, A. Ghanem and H. El-Rassy, Chem. Eng. J., 2010, 159, 107–115 CrossRef CAS PubMed.
- N. A. Alyoshina, A. V. Agafonov and E. V. Parfenyuk, Mater. Sci. Eng., C, 2014, 40, 164–171 CrossRef CAS PubMed.
- E. S. Dolinina and E. V. Parfenyuk, J. Solid State Chem., 2014, 209, 105–112 CrossRef CAS PubMed.
- Y.-H. Kim, B. Lee, K.-H. Choo and S.-J. Choi, Microporous Mesoporous Mater., 2011, 138, 184–190 CrossRef CAS PubMed.
- Y.-H. Kim, B. Lee, K.-H. Choo and S.-J. Choi, Microporous Mesoporous Mater., 2014, 185, 121–129 CrossRef CAS PubMed.
- D. C. Dong and M. A. Winnik, Can. J. Chem., 1984, 62, 2560–2565 CrossRef CAS.
- L. L. Hench and J. K. West, Chem. Rev., 1990, 90, 33–72 CrossRef CAS.
- I. Artaki, T. Zerda and J. Jonas, Mater. Lett., 1985, 3, 493–496 CrossRef CAS.
- I. Langmuir, J. Am. Chem. Soc., 1918, 40, 1361–1403 CrossRef CAS.
- H. Freundlich, Trans. Faraday Soc., 1932, 28, 195–201 RSC.
- M. I. Temkin and V. Pyzhev, Acta Physicochim. URSS, 1940, 12, 327–356 CAS.
- M. M. Dubinin and L. V. Radushkevich, Dokl. Akad. Nauk SSSR, 1947, 55, 327–329 CAS.
- O. Redlich and D. L. Peterson, J. Phys. Chem., 1959, 63, 1024 CrossRef CAS.
- J. Toth, Acta Chim. Acad. Sci. Hung., 1971, 69, 311–328 CAS.
- R. Sips, J. Chem. Phys., 1948, 16, 490–495 CrossRef CAS PubMed.
- R. Sips, J. Chem. Phys., 1950, 18, 1024–1026 CrossRef CAS PubMed.
- K. Y. Foo and B. H. Hameed, Chem. Eng. J., 2010, 156, 2–10 CrossRef CAS PubMed.
- Y. Ho, J.F. Porter and G. McKay, Water, Air, Soil Pollut., 2002, 141, 1–33 CrossRef CAS.
- H. Nollet, M. Roels, P. Lutgen, P. Van der Meeren and W. Verstraete, Chemosphere, 2003, 53, 655–665 CrossRef CAS.
- V. Vimonses, S. Lei, B. Jin, C. W. K. Chow and C. Saint, Chem. Eng. J., 2009, 148, 354–364 CrossRef CAS PubMed.
- W. L. Masterton, C. N. Hurley and E. J. Neth, Chemistry: principles and reactions, CengageBrain. com, 2011 Search PubMed.
Footnote |
† Electronic supplementary information (ESI) available. See DOI: 10.1039/c4ra15504a |
|
This journal is © The Royal Society of Chemistry 2015 |
Click here to see how this site uses Cookies. View our privacy policy here.