DOI:
10.1039/C4RA13443E
(Paper)
RSC Adv., 2015,
5, 8248-8257
NiFe2O4, Fe3O4–FexNiy or FexNiy loaded porous activated carbon balls as lightweight microwave absorbents†
Received
30th October 2014
, Accepted 23rd December 2014
First published on 23rd December 2014
Abstract
Porous activated carbon balls (PACB) with high specific surface area of 985.5 m2 g−1 and abundant pore structure were used as a matrix to synthesize a series of magnetic PACB composites through in situ impregnation of Fe3+ and Ni2+ ions as well as subsequent carbothermic reaction. The experiments involved the preparation of Fe3+–Ni2+ loaded PACB and the heat-treatment process in an Ar atmosphere. The morphology, from flakes to microspheres, coupled with the crystalline phase of the magnetic constituents in PACB, from Fe2O3–NiFe2O4 to Fe0.64Ni0.36–FeNi, can be well controlled by adjusting the reaction temperature. It was revealed that the framework structure of PACB was not destroyed during the carbothermic process, and the high surface area (713.2–808.2 m2 g−1) of PACB composites was still preserved, providing sufficient space to form an effective interface between the magnetic constituents and the PACB. The PACB composites exhibited excellent microwave absorption, a minimum reflection loss (RL) of −30 dB and effective bandwidth (RL below −10 dB) of 5.04 GHz were observed for the Fe0.64Ni0.36–FeNi/PACB composite when the coating thickness reached 2 and 1.7 mm respectively. Importantly, the absorption bandwidth covered the whole frequency range (2–18 GHz) with a thickness of 1.4–8 mm. The introduction of more alloy phase benefited the relative complex permittivity and permeability of the PACB composites, which in turn enhanced the microwave absorption. The microwave absorbability could be tuned via changing the coating thickness and composition of the absorbent, showing that the as-synthesized PACB composites were versatile in practical application. By considering the high surface area, low density (1.1–1.3 g cm−3) and remarkable absorption properties, we believe the PACB composites can be promising candidates as lightweight and effective microwave absorbents.
1. Introduction
In recent years, with the worsening electromagnetic pollution, the demand for microwave absorption materials (MAMs) has increased to meet growing needs for high-efficiency microwave absorbents with thin thickness, light weight, wide bandwidth, strong absorbing ability, and low cost.1–3 Over the past decades, a variety of work has been focused on MAMs with different composition or specific morphology to satisfy the above property requirements.4–9
As traditional magnetic microwave absorbents, metal and ferrite have been extensively investigated because of low cost and strong absorbing ability.10,11 However, high density and narrow bandwidth are the main disadvantages, which restrict their practical applications. It has been reported that composite absorbents can broaden the absorption bandwidth for the synergistic effect.12,13 In considering the unique properties including large surface area, low density and low cost, carbon materials have attracted great interest. Therefore, compounding the magnetic absorbents with carbon materials is an innovative method, which is well confirmed by theoretical analysis and experimental investigation. Great efforts have been focused on the fabrication of MAMs with different carbon and magnetic materials. The core–shell Fe3O4@C composites were synthesized by Du et al. via coating Fe3O4 microspheres with carbon shell, and the core–shell structure was proved to enhance the microwave absorption.14 Wang et al. have prepared the magnetic carbon nanocoils (CNCs) by coating magnetic Fe3O4 or Ni on the surface of CNCs using atomic layer deposition strategy, and the as-prepared composite showed remarkably improved microwave absorbing ability compared to the pristine CNCs.15 Recently, graphene-based composites containing Co,16 Ni,17 and Fe3O418,19 nanoparticles exhibited better microwave absorption than corresponding magnetic particles for the effective impedance matching between grapheme and magnetic particles.
In view of the above-mentioned facts, we employed PACB as substrate to prepare series of carbon-based absorbents, and have reported a facile two-step route for loading Fe3+–Co2+ to synthesize CoFe2O4 and/or Co3Fe7–PACB absorbent under different reaction temperature.20 It may be a promising strategy to load Fe3+–Ni2+ and synthesize the corresponding composite absorbents because the method is low cost, versatility, and potential for large-scale production. PACB used in this work is a perfect matrix, processing low density of about 0.88 g cm−3 and large specific surface area of 985.5 m2 g−1. This can provide abundant space for supporting magnetic particles to form effective interface which was confirmed to improve the microwave absorption.21,22 Herein, NiFe2O4, Fe3O4–FexNiy, or FexNiy loaded PACB composites were produced via in situ impregnation of Fe3+ and Ni2+ ions as well as subsequent carbothermic reaction. The as-prepared Fe0.64Ni0.36–FeNi/PACB composite exhibited excellent microwave absorbing ability, which can be attributed to the introduction of interface polarization, the enhanced relative complex permittivity and permeability as well as their better match.
2. Experimental
2.1 Materials preparation
The PACB used in our work was home-made in our institute. There are abundant pore structure including micropores, mesopores, and micron size pores within PACB, and the pore size distribution is shown in ESI Fig. S1.† In a typical synthesis, the PACB with an average diameter of 1 mm were dispersed into nitric acid solution (50 wt%) at 50 °C under stirring in order to increase the amount of oxygen-containing groups. After the suspension was centrifuged, the filtrated solid was washed with water until neutral, and then dried at 105 °C. The clear PACB were then dispersed in an aqueous solution of Fe(NO3)3·9H2O and Ni(NO3)2·6H2O with the fixed Fe3+ and Ni2+ ratio of 2![[thin space (1/6-em)]](https://www.rsc.org/images/entities/char_2009.gif) :1. After draining the excess water using a Busher funnel, the wet powder was dried at 60 °C. Finally, the dried powder was thermally treated at temperatures from room temperature to 900 °C, with a heating rate of 5 °C min−1 under Ar atmosphere, and each temperature point was maintained for 2 h. The final products were labelled as CFN400, CFN450, CFN500, CFN600, CFN700, CFN800, and CFN900, according to the thermal treating temperature.
:1. After draining the excess water using a Busher funnel, the wet powder was dried at 60 °C. Finally, the dried powder was thermally treated at temperatures from room temperature to 900 °C, with a heating rate of 5 °C min−1 under Ar atmosphere, and each temperature point was maintained for 2 h. The final products were labelled as CFN400, CFN450, CFN500, CFN600, CFN700, CFN800, and CFN900, according to the thermal treating temperature.
2.2 Materials characterization
To reveal the crystallization structures of the products, X-ray diffraction (XRD) measurement was carried out with a D8 Advance Bruker AXS diffractometer with Cu-Kα radiation (λ = 1.5406 Å), in scan steps of 0.01° in a 2θ range of 10–90°. Thermogravimetry (TG) analysis was performed in a SETSYS EVOLUTION TGA 16/18 thermogravimetric analyzer. About 11 mg of sample was heated under Ar atmosphere with flow rate of 50 mL min−1 and heating rate of 5 °C min−1 from 30 °C to 1000 °C. A mass spectrometer (OMNI star GSD-200) was linked with the TG instrument in order to measure the gaseous compounds generated during pyrolysis and reduction process. The pore structure of the pristine PACB was measured with the mercury porosimeter (Micromeritics AUTOPORE 9500) and physisorption analyzer (Micromeritics ASAP 2020). The microscopic morphology of the samples was observed on scanning electron microscope (SEM, JSM-7001F). Raman spectra were recorded on a Horiba LabRAM HR800 spectrometer with an Ar+ laser. The element content was determined by the inductively coupled plasma emission spectroscopy (ICP, Thermo iCAP6300). The magnetic properties were measured on a vibrating sample magnetometer (VSM Lakeshore Model 7400) at room temperature.
2.3 Microwave absorption measurement
The specimen for microwave absorption measurement were prepared by uniformly mixing the PACB composites in a paraffin matrix and pressing the mixture into a cylindrical shaped compact (Φouter = 7.00 mm and Φinner = 3.04 mm). The relative complex permittivity and permeability of the specimen with 33 wt% of the PACB composites were measured in the 2–18 GHz with a vector network analyzer (Agilent N5230) at room temperature. Based on the measured electromagnetic parameters, the RL coefficient of the electromagnetic wave (normal incidence) at the surface of a single-layer absorbent backed by a perfect conductor at certain frequency and layer thickness can be calculated according to transmission line theory.23
3. Results and discussion
3.1 Crystalline phase evolution in PACB composites
Fig. 1 shows the XRD patterns of PACB composites treated at different temperatures. The detailed composition analyses and ratio of the PACB composites obtained at serial temperatures are summarized in Table 1. At the early stage of reaction, the phase is amorphous, and therefore its XRD result is not shown in Fig. 1. Seen from Fig. 1 and Table 1, it is apparent that the main diffraction peaks can be indexed as α-Fe2O3 (JCPDS no. 33-0664) and NiFe2O4 (JCPDS no. 54-0964) for the sample CFN400. As the temperature increases to 450 °C, the diffraction peaks of α-Fe2O3 and NiFe2O4 gradually disappear and the diffraction peaks of Fe3O4 (JCPDS no. 19-0629) and FeNi (JCPDS no. 37-0474) appear, showing that α-Fe2O3 and NiFe2O4 are slowly reduced to Fe3O4 and alloy FeNi by the carbon atoms of PACB. With further increasing temperature to 500 °C, there appear three additional peaks located at 2θ = 43.6, 50.8, and 74.7°, which are attributed to the (111), (200), and (220) planes of face-centered cubic phase of Fe0.64Ni0.36 (JCPDS no. 47-1405). At higher reaction temperature of 600 °C, the main phases in the PACB composites are alloy FeNi and Fe0.64Ni0.36, and the diffraction peaks of Fe0.64Ni0.36 progressively become more obvious with increasing temperature to 900 °C. During this reaction stage (600–900 °C), the two alloy phases coexist until the carbothermic reaction completely finished. Besides, it is evident that there always exists a sharp diffraction peak at approximately 26.5° in all the XRD patterns, which is indexed to the (002) plane of graphite.
 |
| | Fig. 1 XRD patterns of PACB composites treated at different temperatures, where CFN400 to CFN900 means the products were treated from 400 °C to 900 °C. | |
Table 1 Magnetic properties, crystal phase, surface area and densitya of PACB composites
| |
Ms (emu g−1) |
Mr (emu g−1) |
Hc (Oe) |
Crystalline phase |
Mass ratio of Fe:Ni |
ID/IG |
Surface area (m2 g−1) |
ρ (g cm−3) |
| Saturation magnetization (Ms), remanent magnetization (Mr), and coercivity (Hc) were measured at room temperature. Density ρ was measured by pycnometer. |
| PACB |
— |
— |
— |
— |
— |
1.11 |
985.5 |
0.88 |
| CFN400 |
2.7 |
0.3 |
151.8 |
NiFe2O4/α-Fe2O3 |
1.45 |
1.11 |
736.3 |
1.25 |
| CFN450 |
5.9 |
1.0 |
224.4 |
FeNi/Fe3O4 |
1.40 |
1.10 |
713.2 |
1.30 |
| CFN500 |
7.1 |
1.4 |
255.4 |
FeNi/Fe0.64Ni0.36/Fe3O4 |
1.38 |
1.05 |
762.1 |
1.16 |
| CFN600 |
12.2 |
1.3 |
162.8 |
FeNi/Fe0.64Ni0.36 |
1.45 |
1.10 |
808.3 |
1.12 |
| CFN700 |
14.7 |
1.4 |
135.3 |
FeNi/Fe0.64Ni0.36 |
1.30 |
1.08 |
801.4 |
1.14 |
| CFN800 |
19.7 |
2.9 |
159.1 |
FeNi/Fe0.64Ni0.36 |
1.35 |
1.13 |
784.8 |
1.15 |
| CFN900 |
17.6 |
1.9 |
161.9 |
FeNi/Fe0.64Ni0.36 |
1.31 |
1.12 |
793.4 |
1.14 |
As is well known, Raman spectroscopy is considered to be an effective method for analysing carbon phases and the graphitization degree of the carbon materials.24 Fig. S2 in ESI† displays the Raman spectra of PACB composites treated at different temperatures, and it is evident that the change of graphitization degree is insignificant. By combining the surface area of the samples (collected in Table 1), it can be concluded that the carbothermic reaction under different temperatures has negligible influence on the framework structure of PACB and the porous structure is still well-preserved after reaction.
From the above phase analysis, we know that a series of reactions including decomposition reaction of ferric nitrate and nickel nitrate, nickel ferrite formation via the solid-phase reaction, and the oxidation–reduction reaction occur during the high-heat treatment process of PACB composites. There will simultaneously produce a lot of gases during different reaction stages. Therefore, TG-MS technology was applied to quantitatively investigate these complex reactions, basing on the XRD results. The following gaseous species with different mass-to-charge ratios (m/z) were specially studied: NO (m/z = 30), NO2 (m/z = 46), CO (m/z = 28), and CO2 (m/z = 44). Fig. 2 shows the TG-MS results under Ar atmosphere.
 |
| | Fig. 2 TG-MS results of the PACB composites. | |
It is observed that the TG curve shows a continuous and gradual weight loss process divided into three steps: 30–400 °C, 400–500 °C and 500–900 °C. The reactions at the first step mainly involves the evaporation of absorbed water, elimination of crystal water in nitrates, decomposition of Fe(NO3)3 and Ni(NO3)2 into Fe2O3 and NiO.25 The main reactions are as followed eqn (1) and (2).
| | |
4Fe(NO3)3·9H2O → 2Fe2O3 + 12NO2↑ + 36H2O↑ + 3O2↑
| (1) |
| | |
2Ni(NO3)2·6H2O → 2NiO + 4NO2↑ + 12H2O↑ + O2↑
| (2) |
There will obviously produce lots of NO2 in this stage. As the reaction proceeds, the NO2 is reduced by carbon to release NO, CO and CO2, which is listed as reaction (3), and the reaction rate can be improved in the presence of H2O and O2.26 Therefore, NO2 is rapidly consumed so that its intensity in MS curve is too low to detect, meanwhile, peaks of NO, CO and CO2 correspondingly appear in MS results. It should be noted that the reactions between C and O2 as well as C and H2O cannot occur because the temperature is not high enough.
| | |
3NO2 + 2C → 3NO + CO + CO2
| (3) |
At this stage, Fe2O3 and NiO react together to form nickel ferrite.27 It should be mentioned that the synthesis temperature of NiFe2O4 is lower than that of the traditional solid-state reaction.28,29 This mainly results from the high-activity of the ferric oxide and nickel oxide decomposed from nitrates in PACB. Furthermore, the peak around 380 °C in the MS curve of CO2 corresponds to the oxidation of carboxylic group in PACB.30,31
| | |
Fe2O3 + NiO → NiFe2O4
| (4) |
At the second step of 400–500 °C, there exists the continued release of CO and CO2. Combining with Fig. 1 and Table 1, the major reaction should be the preliminary carbon-thermal reduction of Fe2O3 and NiFe2O4 by carbon of PACB, and the products are Fe3O4, FeNi and Fe0.64Ni0.36. The same results were also reported by other groups,32,33 and these reactions are shown by eqn (5) and (6).
| | |
3Fe2O3 + C → 2Fe3O4 + CO↑
| (5) |
| | |
NiFe2O4 + C → FeNi + Fe0.64Ni0.36 + CO↑
| (6) |
The in-depth reduction process of the third step begins at about 500 °C and ends at about 900 °C, in which the carbothermic reduction reaction continues and the Fe3O4 is further reduced to alloy FeNi and Fe0.64Ni0.36. It can be seen that the extent of carbothermic reaction increases as the temperature increases both in the initial and in the final reaction stages. The peaks of CO and CO2 nearby 750 °C and 850 °C in MS curves are attributed to the decomposition of oxygen-containing groups of PACB.34 Above 900 °C, no weight loss and no gas release were observed, indicating that the reaction was completed.
3.2 Morphology and structure characterization
To further study the detailed microscopic structure and morphology of the PACB composite treated at different temperature, SEM is used to provide more detailed information, and the representative images are shown in Fig. 3. For the morphology of original PACB, shown in Fig. 3a, there are many smooth spherical macropores on the cross section of a single carbon ball. Fig. 3b and c show the cross section of CFN300 and CFN400, seen from which the pores are filled with flaky decomposition products of nitrates at the initial reaction stage. And the morphology of the products are basically maintained when the heat-treatment temperature increased to 500 °C (see Fig. 3d and e), during which the preliminary carbothermic reaction occur. However, the morphology of the products changes remarkably with further increasing temperature. As shown in Fig. 3f–i, the flakes in the PACB composites disappear and are replaced by micron size particles. From the XRD and TG-MS results, we know that this is mainly caused by the in-depth reduction process where metal oxides all transform into alloy FeNi and Fe0.64Ni0.36. Meanwhile, these alloy particles will grew larger and become solid microspheres as the temperature increases.
 |
| | Fig. 3 SEM images of cross section of (a) PACB, (b) CFN300, (c) CFN400, (d) CFN450, (e) CFN500, (f) CFN600, (g) CFN700, (h) CFN800, and (i) CFN900. | |
In addition, it can be observed in Fig. 3 that the PACB composites still exhibit apparent macropore distribution after high-temperature treatment. As summarized in Table 1, compared to the pure PACB with surface area of 985.5 m2 g−1 and density of 0.88 cm3 g−1, the surface area 713.2–808.3 m2 g−1 of the PACB composites treated at different temperature displays a decreasing tendency and their density 1.12–1.30 cm3 g−1 increases. These changes mainly arise from the blockage of the micropores of the PACB by the pyrolysis products of nitrates at first and then by the products of redox reaction. By contrast, the density of PACB composites is much lower than the traditional magnetic microwave absorbent, indicating that PACB is an efficient and promising matrix for loading magnetic absorbents.
3.3 Magnetic properties
The M–H loops of the as-synthesized PACB composites were measured using a VSM at room temperature (300 K) with an applied field −17.5 kOe ≤ H ≤ 17.5 kOe. The magnetic hysteresis loops of all the samples are showed in Fig. S3† (ESI), and all the magnetization curves exhibit typical ferromagnetic. Magnetic parameters including saturation magnetization (Ms), remanence (Mr), and coercivity (Hc) of the PACB composites are listed in Table 1. It is found that the value of Ms and Mr increases with the heating temperature, reaching the maximum 19.7 and 2.9 emu g−1 for CFN800. From above XRD results, we know that the changes of Ms and Mr are mainly ascribed to the composition transformation in PACB composites. The low content of magnetic constituents in composites is another significant cause for the low value of Ms. The elemental analysis from the ICP measurements shows that the content of element Fe and Ni is 9.94 wt% and 7.58 wt% in the PACB composites. As for Hc, its changing trend differs from that of Ms and Mr. On the basis of the SEM results (Fig. 3c–i), the magnetic flakes/particles are in micrometer scale, therefore, their Hc approximately equals to their corresponding bulk material.35
3.4 Microwave absorption
In order to study the microwave absorption of the PACB composites, their theoretical RL can be calculated through the measured relative complex permittivity (εr = ε′ − jε′′) and permeability (μr = μ′′ − jμ′′) at given frequencies and coating thicknesses, based on the following equations:10,15| |
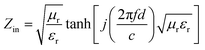 | (7) |
| |
 | (8) |
where Zin and d are the input impedance and thickness of the absorbent, f is the microwave frequency, and c is the velocity of light. From above analysis, the PACB composites can be classified into four classes according to the phase composition, including α-Fe2O3/NiFe2O4/PACB (CFN400), Fe3O4/FeNi/PACB (CFN450), Fe3O4/FeNi/Fe0.64Ni0.36/PACB (CFN500), and FeNi/Fe0.64Ni0.36/PACB (CFN600, CFN700, CFN800, CFN900). Specifically, we chose CFN400, CFN500, and CFN800 as representative samples to investigate the microwave absorption. The coating thickness is a key parameter affecting RL intensity and the frequency position of minimum absorption dip.36,37 Consequently, we calculated the RL curve at different thicknesses of 1.5, 2, 3, 4, 4.5, and 5.5 mm for each PACB composite. Fig. 4 shows a comparison of the RL curves in the frequency range of 2–18 GHz of product/paraffin composites. Compared with the original PACB, the microwave absorption of PACB composites is enhanced noticeably. As can be seen from Fig. 4, there exist two RL dips at low and high frequencies simultaneously when the coating thickness exceeds 4 mm and only one dip appears when the thickness is less than 4 mm. It can deduce that the coating thickness and the corresponding frequency of an absorption dips obey the quarter-wave thickness criteria.38,39| |
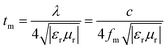 | (9) |
where tm and fm are the matching thickness and frequency, λ is the wavelength of electromagnetic wave, and c is the light velocity. After comparing the calculated value tcalm and experimental value texpm of the PACB composites (shown in ESI Fig. S4†), we know that they all match well for the three samples. Very importantly, there will appear matching dips in the RL curve when f = fm, 3fm, 5fm…, that is, the number of absorption dips is controlled by changing the coating thickness.
 |
| | Fig. 4 Microwave RL curves of the PACB composites: (a) PACB, (b) CFN400, (c) CFN500, and (d) CFN800 with different coating thickness. | |
From Fig. 4, it is interesting to find that microwave frequency of the absorption dips shifts negatively with the increase of coating thickness. In general, RL below −10 dB means over 90% microwave absorption and only the absorbent with RL below −10 dB can be considered in practical application. It can be observed that the RL < −10 dB in RL curve of PACB only appears at thinner thickness of 1.5 and 2 mm, and the microwave absorbing ability is improved after loading different magnetic components, especially when the coating thickness exceeds 2 mm. For CFN400 and CFN500, the minimum RL is −17.3 and −19.7 dB with the coating thickness of 5.5 mm. Their effective bandwidth keeps the maximum when the thickness is 4.5 mm, reaching 3.04 and 2.72 GHz. Whereas for CFN800, the microwave absorption is apparently enhanced, a minimum RL of −28 dB is observed at 10.2 GHz when the coating thickness is 2 mm, and the effective bandwidth is 5.04 GHz with the coating thickness of 1.5 mm, almost covers the whole Ku-band (12–18 GHz). It is likely that the microwave absorbing ability of PACB composites can be enhanced by obtaining suitable magnetic materials via heat treatment at different temperature. Additionally, the RL curves of PACB composites are shown in Fig. 5, maintaining the same thickness of 4.5 mm, from which the influence of composition on the microwave absorbing property can be well demonstrated. It is clear that two absorption dips coexisted at C-band (4–8 GHz) and Ku-band frequencies for all curves. The RL below −10 dB for both dips appear in the curves of CFN400, CFN450, and CFN500, while only the dip at low frequency exceeds −10 dB for other samples. The minimum RL of CFN400, CFN450, CFN500, CFN600, CFN700, CFN800, and CFN900 are −14.8, −20.3, −17.0, −23.7, −19.9, −14.4, and −11.7 dB at 5.36, 5.12, 5.12, 4.64, 4.64, 4.16, and 4.24 GHz correspondingly. Clearly, the microwave absorption can be adjusted by changing the composition of the absorbent as well in our case. The above performances are important because it reveals that the numbers and the RL of absorption dip as well as the frequency bandwidth of microwave absorption can be tuned via the changing of coating thickness and composition of the absorbent, which has a profound influence on the diversification in practical application.
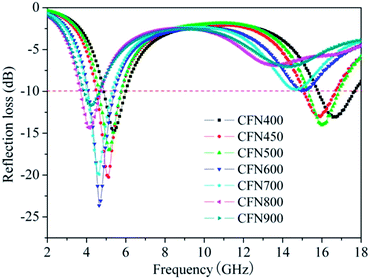 |
| | Fig. 5 Microwave RL curves of the PACB composites with coating thickness of 4.5 mm. | |
On the basis of the analysis, we know that CFN800 is superior to other samples in microwave absorption. Compared with other recently reported absorbents in microwave absorption,12–15,40 the CFN800 sample in our work has a lower filling rate and thinner coating thickness, as shown in Table 2, exhibiting relatively wider bandwidth. In addition, the RL curves of CFN800 at different coating thicknesses are showed in Fig. S5.† As observed, the absorption bandwidth with RL below −10 dB covers the whole testing frequency range (2–18 GHz) when the coating thickness increases to 8 mm, and the minimum RL reaches −30 dB when the thickness is 1.7 mm. This is a hint that CFN800 exhibits an excellent electromagnetic wave attenuation performance, including high absorption efficiency, strong absorption, and a wide operation frequency bandwidth.
Table 2 Microwave absorption of some reported absorbents
| Absorbents |
Filling rate (wt%) |
Effective bandwidth (GHz) |
Coating thickness (mm) |
Ref. |
| Fe3O4@C |
50 |
3 |
2 |
12 |
| Fe3O4/CNCs |
25 |
3.5 |
2 |
13 |
| Co/GN |
60 |
5.5 |
2 |
14 |
| Ni/GN |
60 |
4 |
3 |
15 |
| RGO-SCI |
60 |
4.19 |
3 |
40 |
| CFN800 |
33 |
5.04 |
1.5 |
This work |
3.5 Microwave absorption mechanism
In our case, the excellent microwave absorption can be interpreted by the following factors. First of all, the relative complex permittivity and permeability are important parameters to be considered in the design of radar absorbing materials. It is commonly accepted that the real parts of relative complex permittivity (ε′) and permeability (μ′) stand for the storage capability of electric and magnetic energy, and the imaginary parts (ε′′ and μ′′) represent the dissipation ability.41,42 The relative complex permittivity spectra of the PACB and PACB composites are shown in Fig. 6a, from which it can be seen that the value of ε′ and ε′′ show decreasing tendency with increasing frequency. This is the typical frequency dispersion behaviour, existing widely in pristine carbon materials and carbon-based materials,43,44 which is reported to benefit the microwave absorbption.12,14 Furthermore, PACB shows high ε′ and ε′′ values from 23.7 to 13.1 and from 24.7 to 7.1, respectively. By loading with magnetic constituents, the PACB composites show reduced permittivity. Compared with CFN400 and CFN500, the value of relative complex permittivity is improved and the variation of sample CFN800 is more apparent. This is partly ascribed to their composition, based on the free electron theory,45 ε′′ = 1/(2πρfε0), where ρ is the electric resistivity and ε0 is the permittivity in vacuum, it can be deduced that ε′′ is inversely proportional to the ρ. In other words, the value of ε′′ is increased with the increment of alloy content in the PACB composites.
 |
| | Fig. 6 Frequency dependence of (a) relative complex permittivity and (b) permeability of PACB, CFN400, CFN500, and CFN800. | |
Fig. 6b shows μ′ and μ′′ of the PACB and PACB composites. Generally, the magnetic loss of magnetic absorbent originates mainly from eddy current effect, natural resonance, and exchange resonance.46 The pristine PACB shows negligible relative permeability as PACB is typical dielectric loss material and is lack of magnetic constituents. For CFN400 and CFN500, the μ′ value decreases slowly and the variation is slight. The situation is similar to CFN800, except an evident peak at high frequency. As for μ′′, there are noticeable resonance peaks at around 7 and 12 GHz for the three samples. Based on the Aharoni's theory,47 the resonance peaks at high frequency in the curve of μ′′ are related to the exchange resonance, and the peaks located at lower frequency are associated with the natural ferromagnetic resonance.48 The influence of eddy current loss on the μ′′ is connected to the diameter d of the nanoparticle, electric conductivity σ, and the permeability μ0 of vacuum, which can be written as μ′′ ≈ 2πμ0(μ′)2σd2f/3. If the magnetic loss only originates from the eddy current loss, the equation μ′′(μ′)−2f−1 = 2πμ0σd2/3 should keep constant with changing frequency.15,49 Fig. 7 shows the variation of μ′′(μ′)−2f−1 versus f of PACB composites, the value of μ′′(μ′)−2f−1 remains almost constant for CFN400 and CFN500 when f > 8 GHz, confirming the presence of current loss. On the contrary, the role of current loss in CFN800 can be neglected for the value of μ′′(μ′)−2f−1 displays obvious fluctuations. It has to point out that the similar enhancement of relative complex permeability with the increase of alloy content can also be observed. That is, compared with metal oxides Fe2O3, Fe3O4 or NiFe2O4, the alloy phase FeNi and Fe0.64Ni0.36 not only benefits the relative complex permittivity but also improves the relative complex permeability of the PACB composites due to their heightened magnetic properties, which in turn enhance the microwave absorption.50,51 Besides, the variation trend of ε′ and ε′′ as well as μ′ and μ′′ is synchronous as the real permittivity/permeability and the imaginary permittivity/permeability are correlated.52,53
 |
| | Fig. 7 Values of μ′′(μ′)−2f−1 of CFN400, CFN500 and CFN800 versus frequency. | |
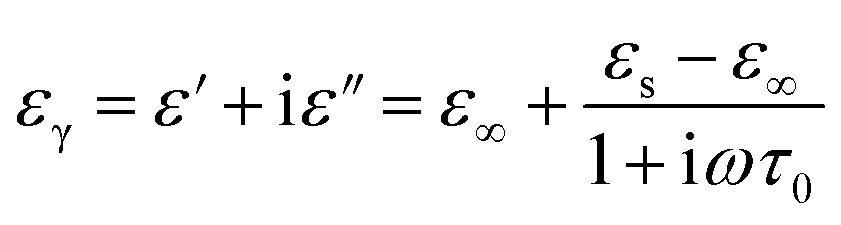
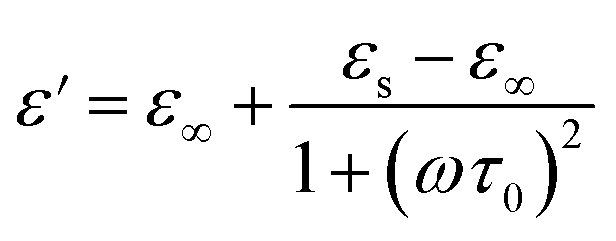
Second, from the SEM results, we know that the magnetic constituents embedded in the pores were firmly combined with the PACB after the carbothermic process. Therefore, the charge transfer between PACB and magnetic constituents occurs with little hindrance, which indicates the existence of interface polarization. It is known that the interfacial polarization and associated relaxation will benefit the absorption property, which can be validated by the Cole–Cole semicircle.14,19 According to the Debye dipolar relaxation,54 the relative complex permittivity (εr) can be can be expressed as
| |
 | (10) |
where
τ0,
εs and
ε∞ are the relaxation time, the static dielectric constant, and the dielectric constant at infinite frequency. From
eqn (10), it can be deduced that
| |
 | (11) |
| |
 | (12) |
based on eqn (11) and (12), it can be further deduced that the relationship between ε′ and ε′′ is as follows
| |
 | (13) |
thus the plot of
ε′
versus ε′′ would be a single semicircle, which is usually defined as the Cole–Cole semicircle, and each semicircle corresponds to one Debye relaxation process.
55 Plots of
ε′
versus ε′′ for PACB composites are shown in
Fig. 8, from which two Cole–Cole semicircles and a linear curve are found for all the samples. This may suggest that there exits dual relaxation processes in PACB composites, showing that the high surface area and abundant pore structure of PACB endow these composites with multiple dielectric relaxation processes.
 |
| | Fig. 8 Typical Cole–Cole semicircles (ε′ versus ε′′) for (a) CFN400, (b) CFN500, and (c) CFN800 in the frequency range of 2–18 GHz. | |
Third, the concept of impedance match is also an important factor that has a determining effect on microwave absorption. Only when the characteristic impedance of the absorbents nearly equal to that of the free space, can the zero reflection at the front surface of the absorbents be realized.14 Dielectric loss (tanδe = ε′′/ε′) and magnetic loss (tanδm = μ′′/μ′) are the main factors that determine the microwave absorption of MAMs, most of the microwave will be reflected off at the surface of absorbents if the magnetic loss and dielectric loss are out of balance. From Fig. 6, we know that the pristine PACB processes large relative permittivity and slight permeability. This means that the magnetic loss and the dielectric loss cannot keep balance in this case, leading to poor microwave absorbing ability. The relative permittivity is noticeably increased and the permeability is relatively improved after loading different magnetic components for CFN400, CFN500 and CFN800. This helps to enhance the level of impedance match and the microwave absorption. Fig. 9 shows the frequency dependence of the loss tangent for PACB composites, it can be clearly seen that the curves of dielectric and magnetic loss tangents are invariably correlated and coexist symmetrically for all samples. Importantly, the value of tanδe is much higher than that of tanδm for all samples, which is similar to other report.56,57 Therefore, in our case, the dielectric loss dominates the microwave absorption of the PACB composites. In other words, the microwave absorption of PACB composites is largely ascribed to dielectric properties. Meanwhile, it can be expected that the porous structure within PCAB could endow composite absorbents additional pathway for the transmission of electromagnetic waves, leading to multiple reflections and improvement of microwave absorption.8,58,59
 |
| | Fig. 9 Frequency dependence of the loss tangent of CFN400, CFN500 and CFN800. | |
4. Conclusions
A series of magnetic PACB composites were successfully prepared via impregnation method and subsequent carbothermic process. The as-fabricated composites with high specific surface area of 1.12–1.30 cm3 g−1 and low density of 713.2–808.3 m2 g−1 exhibited excellent microwave absorbing property. Especially for Fe0.64Ni0.36–FeNi/PACB, the minimum RL and effective bandwidth could reach −30 dB and 5.04 GHz when the coating thickness reached 2 and 1.7 mm, respectively. This benefited from the enhanced relative complex permittivity and permeability as well as their better match. This study indicates that the PACB composites are promising lightweight and efficient microwave absorbents. In addition, we believe this work will be helpful in the design and preparation of other composite absorbent due to its simple preparation technology.
Acknowledgements
The authors gratefully thank Prof. Kaixi Li for providing the porous activated carbon balls during the experiment. This work was supported by the National Science Foundation of ShanXi (no. 2012011005-1).
Notes and references
- L. B. Kong, Z. W. Li, L. Liu, R. Huang, M. Abshinova, Z. H. Yang, C. B. Tang, P. K. Tan, C. R. Deng and S. Matitsine, Int. Mater. Rev., 2013, 58, 203–259 CrossRef CAS PubMed.
- F. Qin and C. Brosseau, J. Appl. Phys., 2012, 111, 061301 CrossRef PubMed.
- J. Huo, L. Wang and H. J. Yu, J. Mater. Sci., 2009, 44, 3917 CrossRef CAS PubMed.
- J. W. Liu, R. C. Che, H. J. Chen, F. Zhang, F. Xia, Q. S. Wu and M. Wang, Small, 2012, 8, 1214–1221 CrossRef CAS PubMed.
- Y. J. Chen, G. Xiao, T. S. Wang, Q. Y. Ouyang, L. H. Qi, Y. Ma, P. Gao, C. L. Zhu, M. S. Cao and H. B. Jin, J. Phys. Chem. C, 2011, 115, 13603–13608 CAS.
- Z. Z. Wang, M. Z. Wu, S. W. Jin, G. Li, Y. Q. Ma and P. H. Wang, J. Magn. Magn. Mater., 2013, 344, 101–104 CrossRef CAS PubMed.
- J. W. Liu, J. Cheng, R. C. Che, J. J. Xu, M. M. Liu and Z. W. Liu, ACS Appl. Mater. Interfaces, 2013, 5, 2503–2509 CAS.
- J. H. Zhou, J. P. He, G. X. Li, T. Wang, D. Sun, X. C. Ding, J. Q. Zhao and S. C. Wu, J. Phys. Chem. C, 2010, 114, 7611 CAS.
- Z. Z. Wang, J. P. Zou, Z. H. Ding, J. F. Wu, P. H Wang, S. W. Jin and H. Bi, Mater. Chem. Phys., 2013, 142, 119–123 CrossRef CAS PubMed.
- R. C. Che, L. M. Peng, X. F. Duan, Q. Chen and X. L. Liang, Adv. Mater., 2004, 16, 401–405 CrossRef CAS.
- X. Gu, W. M. Zhu, C. J. Jia, R. Zhao, W. G. Schmidt and Y. Q. Wang, Chem. Commun., 2011, 47, 5337–5339 RSC.
- Z. J. Wang, L. N. Wu, J. G. Zhou, B. Z. Shen and Z. H. Jiang, J. Phys. Chem. C, 2013, 117, 5446–5452 CAS.
- A. Ohlan, K. Singh, A. Chandra and S. K. Dhawan, ACS Appl. Mater. Interfaces, 2010, 2, 927 CAS.
- Y. C. Du, W. W. Liu, R. Qing, Y. Wang, X. J. Han, J. Ma and P. Xu, ACS Appl. Mater. Interfaces, 2014, 6, 12997–13006 CAS.
- G. Z. Wang, Z. Gao, S. W. Tang, C. Q. Chen, F. F. Duan, S. C. Zhao, S. W. Lin, Y. H. Feng, L. Zhou and Y. Qin, ACS Nano, 2012, 6, 11009–11017 CAS.
- G. H. Pan, J. Zhu, S. L. Ma, G. B. Sun and X. J. Yang, ACS Appl. Mater. Interfaces, 2013, 5, 12716–12724 CAS.
- T. T. Chen, F. Deng, J. Zhu, C. F. Chen, G. B. Sun, S. L. Ma and X. J. Yang, J. Mater. Chem., 2012, 22, 15190–15197 RSC.
- Y. L. Ren, H. Y. Wu, M. M. Lu, Y. J. Chen, C. L. Zhu, P. Gao, M. S. Cao, C. Y. Li and Q. Y. Ouyang, ACS Appl. Mater. Interfaces, 2012, 4, 6436–6442 CAS.
- G. Z. Wang, Z. Gao, G. P. Wan, S. W. Lin, P. Yang and Y. Qin, Nano Res., 2014, 7, 704–716 CrossRef CAS PubMed.
- G. M. Li, L. C. Wang, W. X. Li, R. M. Ding and Y. Xu, Phys. Chem. Chem. Phys., 2014, 16, 12390 Search PubMed.
- Z. G. Fang, C. S. Li, J. Y. Sun, H. T. Zhang and J. S. Zhang, Carbon, 2007, 45, 2873 CrossRef CAS PubMed.
- Q. L. Liu, D. Zhang and T. X. Fan, Appl. Phys. Lett., 2008, 93, 013110 CrossRef PubMed.
- R. F. Zhou, L. Qiao, H. T. Feng, J. T. Chen, D. Yan, Z. G. Wu and P. X. Yan, J. Appl. Phys., 2008, 104, 094101–094105 CrossRef PubMed.
- W. J. Gao, Y. Wan, Y. Q. Dou and D. Y. Zhao, Adv. Energy Mater., 2011, 1, 115–123 CrossRef CAS.
- J. Mu and D. D. Perlmutter, Thermochim. Acta, 1982, 3, 253–260 CrossRef.
- F. Jacquot, V. Logie, J. F. Brilhac and P. Gilot, Carbon, 2002, 40, 335–343 CrossRef CAS.
- Z. G Zhang, Y. H. Liu, G. C. Yao, G. Y. Zu, X. Zhang and J. F. Ma, Phys. E, 2012, 45, 122–129 CrossRef PubMed.
- F. L. Zabotto, A. J. Gualdi, J. A. Eiras, A. J. A. de Oliveira and D. Garcia, Mater. Res., 2012, 15, 428–433 CrossRef CAS PubMed.
- Z. G. Zhang, Y. H. Liu, G. C. Yao, G. Y. Zu and Y. Hao, Int. J. Appl. Ceram. Technol., 2013, 10, 142–149 CrossRef CAS PubMed.
- J. L. Figueiredo, M. F. R. Pereira, M. M. A. Freitas and J. J. M. Órfão, Carbon, 1999, 37, 1379–1389 CrossRef CAS.
- U. Zielke, K. J. Hüttinger and W. P. Hoffman, Carbon, 1996, 34, 983–998 CrossRef CAS.
- X. Yan and D. S. Xue, Nano-Micro Lett., 2012, 4, 176–179 CrossRef CAS.
- K. S. Abdel-Halim, M. Bahgat and O. A. Fouad, Mater. Sci. Technol., 2006, 22, 1396–1400 CrossRef CAS PubMed.
- M. S. Shafeeyan, W. M. A. W. Daud, A. Houshmand and A. Shamiri, J. Anal. Appl. Pyrolysis, 2010, 89, 143–151 CrossRef CAS PubMed.
- S. Mitra, S. Das, K. Mandal and S. Chaudhuri, Nanotechnology, 2007, 18, 275608 CrossRef.
- G. B. Sun, B. X. Dong, M. H. Cao, B. Q. Wei and C. W. Hu, Chem. Mater., 2011, 23, 1587–1593 CrossRef CAS.
- S. S. Kim, D. H. Han and S. B. Cho, IEEE Trans. Magn., 1994, 30, 4554–4556 CrossRef CAS.
- I. Kong, S. H. Ahmad, M. H. Abdullah, D. Hui, A. N. Yusoff and D. Puryanti, J. Magn. Magn. Mater., 2010, 322, 3401–3409 CrossRef CAS PubMed.
- B. C. Wang, J. Q. Wei, Y. Yang, T. Wang and F. S. Li, J. Magn. Magn. Mater., 2011, 323, 1101–1103 CrossRef CAS PubMed.
- Z. T. Zhu, X. Sun, H. R. Xue, H. Guo, X. L. Fan, X. C. Pan and J. P. He, J. Mater. Chem. C, 2014, 2, 6582–6591 RSC.
- J. E. Atwater and R. R. Wheeler Jr, Appl. Phys. A, 2004, 79, 125–129 CrossRef CAS PubMed.
- C. Wang, X. J. Han, X. L. Zhang, S. R. Hu, T. Zhang, J. Y. Wang, Y. C. Du, X. H. Wang and P. Xu, J. Phys. Chem. C, 2010, 114, 14826–14830 CAS.
- N. J. Tang, W. Zhong, C. T. Au, Y. Yang, M. G. Han, K. L. Lin and Y. W. Du, J. Phys. Chem. C, 2008, 112, 19316–19323 CAS.
- M. S. Cao, W. L. Song, Z. L. Hou, B. Wen and J. Yuan, Carbon, 2010, 48, 788–796 CrossRef CAS PubMed.
- S. Gangopadhyay, G. C. Hadjipanayis, B. Dale, C. M. Sorensen, K. J. Klabunde, V. Papaefthymiou and A. Kostikas, Phys. Rev. B: Condens. Matter Mater. Phys., 1992, 45, 9778 CrossRef CAS.
- J. Ma, J. G. Li, X. Ni, X. D. Zhang and J. J. Huang, Appl. Phys. Lett., 2009, 95, 102505 CrossRef PubMed.
- G. Viau, F. Fievet-Vincent, F. Fievet, P. Toneguzzo, F. Ravel and O. Acher, J. Appl. Phys., 1997, 81, 2749 CrossRef CAS PubMed.
- F. S. Wen, F. Zhang and Z. Y. Liu, J. Phys. Chem. C, 2011, 115, 14025–14030 CAS.
- F. S. Wen, H. B. Yi, L. Qiao, H. Zheng, D. Zhou and F. S. Li, Appl. Phys. Lett., 2008, 92, 042507 CrossRef PubMed.
- C. Feng, X. G. Liu, Y. P. Sun, C. G. Jin and Y. H. Lv, RSC Adv., 2014, 4, 22710–22715 RSC.
- G. X. Li, Y. X. Guo, X. Sun, T. Wang, J. H. Zhou and J. P. He, J. Phys. Chem. Sol., 2012, 73, 1268–1273 CrossRef CAS PubMed.
- Y. C. Qing, W. C. Zhou, F. Luo and D. M. Zhu, Carbon, 2010, 48, 4074–4080 CrossRef CAS PubMed.
- P. C. P. Watts, W. K. Hsu, A. Barnes and B. Chambers, Adv. Mater., 2003, 45, 600–603 CrossRef.
- J. Frenkel and J. Dorfman, Nature, 1930, 126, 274–275 CrossRef.
- K. S. Cole and R. H. Cole, J. Chem. Phys., 1941, 9, 341 CrossRef CAS PubMed.
- Y. L. Ren, C. L. Zhu, S. Zhang, C. Y. Li, Y. J. Chen, P. Gao, P. P. Yang and Q. Y. Ouyang, Nanoscale, 2013, 5, 12296–12303 RSC.
- J. Xiang, J. L. Li, X. H. Zhang, Q. Ye, J. H. Xu and X. Q. Shen, J. Mater. Chem. A, 2014, 2, 16905–16914 CAS.
- G. Li, T. S. Xie, S. L. Yang, J. H. Jin and J. M. Jiang, J. Phys. Chem. C, 2012, 116, 9196–9201 CAS.
- Y. C. Du, T. Liu, B. Yu, H. B. Gao, P. Xu, J. Y. Wang, X. H. Wang and X. J. Han, Mater. Chem. Phys., 2012, 135, 884–891 CrossRef CAS PubMed.
Footnote |
| † Electronic supplementary information (ESI) available. See DOI: 10.1039/c4ra13443e |
|
| This journal is © The Royal Society of Chemistry 2015 |
Click here to see how this site uses Cookies. View our privacy policy here.