 Open Access Article
Creative Commons Attribution 3.0 Unported Licence
Plasmonic heating with near infrared resonance nanodot arrays for multiplexing optofluidic applications†
A.
Steinbrück
a,
J.-W.
Choi
b,
S.
Fasold
a,
C.
Menzel
a,
A.
Sergeyev
a,
T.
Pertsch
a and
R.
Grange
*a
aFriedrich-Schiller-Universität Jena, Institute of Applied Physics, Abbe Center of Photonics, Albert-Einstein Straße 15, 07745 Jena, Germany. E-mail: rachel.grange@uni-jena.de
bSwiss Federal Institute of Technology Lausanne (EPFL) Optics Laboratory, School of Engineering, CH-1015 Lausanne, Switzerland
First published on 12th November 2014
Abstract
In this work, we show local laser-induced heating in fluids with gold nanodot arrays prepared by electron-beam lithography that cover resonances in the near infrared spectral range from 750 nm to 880 nm. We utilize two approaches to demonstrate thermal effects, solvent evaporation and flow stop, with a thermosensitive polymer solution. We show that with fluences as low as 4 μJ cm−2, significant heating of the nanostructures occurs in their immediate vicinity. We perform power and wavelength dependent measurements to determine the threshold of the thermal effects. Using wavelengths about 20 nm away from the plasmonic resonance peak, the heating drops drastically, and 30 to 40 nm away, there is mostly no thermal effect. Therefore, working close to the threshold laser power offers the possibility of multiplexed reactions or sensing without cross-talk even though a typical full width at half maximum of a plasmonic resonance spectrum can be as broad as 200 nm. Additionally, comparison with theoretical calculations of heat generation show good agreement with the experimentally determined threshold powers.
Introduction
The intense investigation of metallic nanostructures has led to the fast growing field of plasmonics.1 Taking advantage of a strong resonance, named localized surface plasmons, in the visible to near infrared spectral range, metallic nanostructures have been used for enhancing electromagnetic fields in photovoltaics,2 Raman spectroscopy3 or fluorescent applications.4 Most of those applications use enhanced light scattering. However, light absorption is also enhanced and can be transferred into heat, offering great possibilities in photothermal cancer therapy,5–7 plasmonic photothermal delivery,8–11 nano-surgery,12–14 photothermal imaging,15,16 or plasmon assisted nano-chemistry.17–19 One fast growing field of applications combines plasmonic particles with microfluidics for lab-on-a-chip devices.20–23 Another example uses photo-heating as an electrode-free method for moving fluids or performing chemical reactions.17,24,25 Recent studies of photoinduced heating show light-guided liquid flow26 or liquid flow manipulation,27 valves,28 and heterogeneous catalysis.17 Another important aspect of the current research in the field of thermo-plasmonics is the theoretical calculation of heat generation by the plasmonic structures29,30 and the development of optical techniques for heat characterization.31The recent theoretical works give precise insights about temperature changes and the different mechanisms involved depending on the laser sources or the metallic structures (e.g. spheres or rods).30,32 However, to the best of our knowledge no quantified experimental investigations of heat-induced effects at different wavelengths and incident powers have been performed, especially with pulsed illumination. Here, we combine thermo-plasmonics and optofluidics to accurately determine threshold powers needed to perform heat-induced experiments from gold nanodot arrays into fluids. We use electron-beam lithography to fabricate gold nanostructure arrays on glass very locally instead of depositing colloidal nanoparticles on a large area and to obtain reusable devices by avoiding detachment of the polymer chip that contains the microfluidic channels. By varying the sizes of the dots we cover localized surface plasmon resonances in the near infrared spectral range from 750 to 880 nm. For each nanostructure, we will accurately determine the threshold laser power inducing significant heating of the gold dots thereby heating liquid in a microfluidic channel. Working close to this threshold power offers the possibility of multiplexed reactions or sensing without cross-talk even though plasmonic resonances can be as broad as 200 nm full width at half maximum (FWHM). As a proof of principle for light- or heat-induced reactions, we perform fluidic experiments of solvent evaporation at the liquid–air interface and immobilizing effects with a thermosensitive polymer solution in microfluidic channels. To quantitatively study both effects, we conduct power- and wavelength-dependent measurements on- and off-resonance to determine thresholds and show that close-by resonances can be well used for multiplexing experiments by working close to the laser threshold power to limit cross-talk. To complete our study, we provide simulations of the heat generation based on the absorption of the nanostructures that match the experimental results.
For the future, we envision that reactions that require light or heat could be conducted in a microfluidic device under well-controlled conditions in a closed and continuous flow regime.17 Especially when poisonous and/or expensive reactants are used or created, such an optofluidic device would be advantageous over conventional reactors.33 In this context, the synthesis of several products or the detection of several analytes in parallel (multiplexing) represents a great demand. Therefore, it is interesting to investigate the multiplexing possibilities offered by metallic nanostructures resonating at different wavelengths to perform multiple experiments on the same chip e.g. in different channels of the same microfluidic chip. In this work, we demonstrate full control of the plasmonic resonances and the particle location via electron-beam lithography. Furthermore, we can choose the reaction spot within the microfluidic channel and adapt to its sensitivity with laser illumination by varying the power or tuning the wavelength.
Results and discussion
Experimental setup
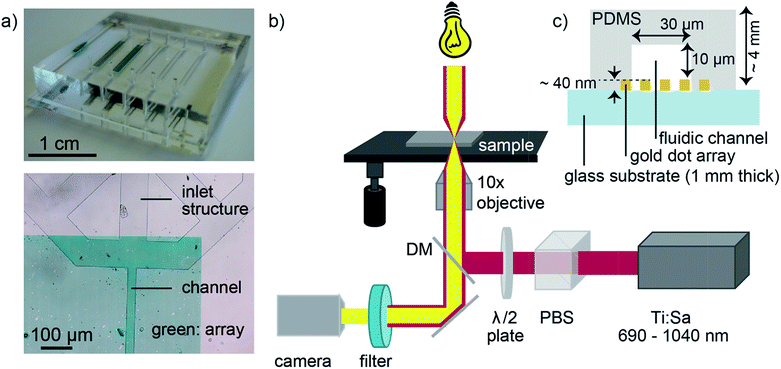
Dense gold nanoparticle arrays were structured by electron-beam lithography on glass after carefully designing the periodic gold nanostructures of different sizes (herein called nanodots) to match the desired resonances simulated by the Fourier Modal Method (FMM) (see Fig. SI1 in the ESI†).34,35 Thus, nanodot arrays were fabricated with resonance wavelengths of 750 nm to 880 nm.The microfluidic device was assembled by bonding an oxygen plasma-activated PDMS chip to a nanodot array chip carefully positioning the channels with respect to the nanodot array areas (Fig. 1a). For the optofluidic experiments, an inverse optical microscope (IX73, Olympus) was coupled with a tunable Ti![[thin space (1/6-em)]](https://www.rsc.org/images/entities/char_2009.gif) :
:![[thin space (1/6-em)]](https://www.rsc.org/images/entities/char_2009.gif) sapphire femtosecond pulsed laser (Fig. 1b).
sapphire femtosecond pulsed laser (Fig. 1b).
Characterization of arrays
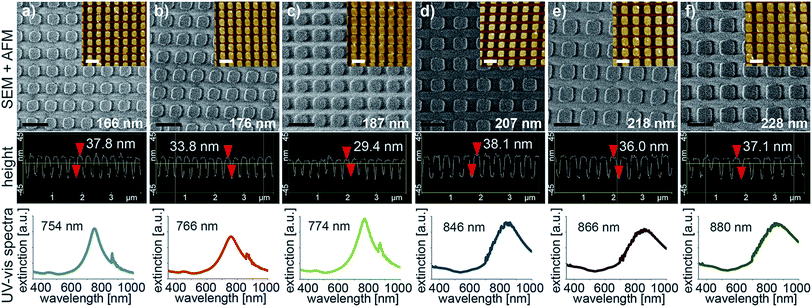
The dimensions of the gold dot arrays were characterized by SEM and AFM (Fig. 2). The microscopic images show homogeneous areas of gold dot structures with few missing dots over a relatively large area (1 × 7 mm) with uniform dimensions (in terms of diameter and thickness as given in Fig. 2). In a second step, photospectroscopy was utilized to measure the localized surface plasmon resonance peak of the arrays immersed in water to mimic the optofluidic experimental conditions. The respective curves are also displayed in Fig. 2 (bottom) indicating the plasmonic peak wavelength ranging from 750 to 880 nm with FWHM spanning from 100 nm to 250 nm. Changing the length and height of the individual dot of the plasmonic nanostructure resulted in a resonance wavelength shift as expected. Distinct peaks were observed for all prepared arrays. The minor peaks in Fig. 2 a to c represent artefacts from the measurement due to a grating change at 860 nm.In resonance laser experiments
First, we would like to describe the processes that are likely to occur when dense plasmonic nanoparticle arrays (plasmonic carpets) are used for laser-induced heat generation in a microfluidic channel. Plasmonic gold nanoparticles show a strong absorption peak in the visible to NIR depending on their size. This property is used herein to locally heat the nanoparticles by laser irradiation (absorption-induced process).14,32 Contrary to Boyd et al.,24 we have to deal with considerable heat transfer from the nanostructures to the solid substrate (here glass) besides the heat that is released to the surrounding liquid. This fact will be illustrated in the heat simulations later on. To probe the heat transfer, we will explore two processes inside the microfluidic channel (Fig. 3). One process involves the meniscus of a moving liquid that is flowing through the channel. By moving a laser spot over the meniscus in the presence of a plasmonic nanostructure, heat will be generated by the plasmonic structures. This way, liquid can evaporate and will condensate again as little droplets somewhat away from the meniscus.27,36 In Fig. 3a, the process is illustrated schematically.The second possible case is the liquid flow itself that will be influenced. In our case, we use a pluronic solution. Pluronic is a thermosensitive, water-soluble triblock copolymer that remains liquid at room temperature and undergoes a sol–gel transition with increasing temperature (about 37 °C for the pluronic concentration used here).37 Thus, when the laser light heats the plasmonic carpet (in resonance) also the surrounding medium of the gold dots is heated generating a gel-like area locally (blue circle) that can hinder or stop the liquid flow in the channel (Fig. 3b). We will show experiments for both processes.
Solvent evaporation
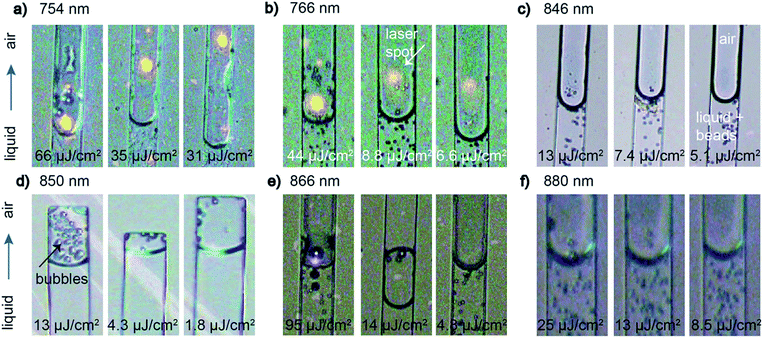
The first effect we wanted to demonstrate was solvent evaporation to quantitatively measure the lowest laser power needed for such an experiment. We tested six different gold nanodot arrays with different resonance wavelengths in the NIR regime (750 to 880 nm) to determine the laser power thresholds. Fig. 4 shows microscopic snapshots from videos that were recorded during the experiment. In all pictures, the liquid is slowly flowing through the microfluidic channel from the bottom to the top where the water phase with the latex beads (bottom) is easily distinguishable from the colorless, clear air phase (top) (see Fig. 4c for instance). While moving the sample accordingly so that the liquid meniscus is moved in and out of the laser spot (yellow spots in Fig. 4a and b and purple reflection in Fig. 4e) droplet formation originating from the air–water interface is observed depending on the laser power applied. The droplets appear almost instantaneously and it takes few/several seconds for them to disappear again depending on the applied laser power.27,36 At high laser power, the bubble formation is quite massive. Stepwise decreasing the laser power results in less and less formation of (small) droplets. When getting closer to the threshold value, the steps were decreased to not miss the threshold power. Several measurements at powers close to the threshold (above and below) were taken to confirm the occurrence of droplet formation. Thus, we were able to determine laser threshold powers for all different plasmonic carpets with different resonance wavelengths where solvent evaporation was still occurring. Below the threshold power, no evaporation of solvent was detected. With respect to the laser spot size at the respective wavelength and the repetition rate of the laser, we calculated the fluence at sample position to easily compare the values.For each array investigated, we display three snapshots in Fig. 4 representing solvent evaporation above (left image in each panel), at (middle), and below (right) the threshold fluence. We define the threshold fluence for solvent evaporation as the fluence when it was still possible to produce (a few) droplets. Above the threshold fluence, many (small) droplets can be observed in close proximity to the meniscus in the snap shot pictures whereas below the threshold fluence, no such droplets appear (compare left and right images in each panel in Fig. 4). As the process of laser energy conversion to heat is directly linked to the absorption properties of the nanostructures32,38 we expect similar threshold fluences for all used wavelengths. Indeed, the absorption of the nanostructures (from FMM simulations in Fig. SI1†) is very similar for all the structures (13–17%). Thus, for all samples, we found quite similar threshold fluences spanning from 4 to 35 μJ cm−2. In Table 1 we summarize the average laser power and the corresponding fluences at the threshold for evaporation of the solvent. For comparison, 50 mW average power over a 10 μm laser spot diameter was used in experiments with continuous wave (cw) laser at 532 nm.17 Although the authors don't claim the power as threshold powers in the experiment, pulsed femtosecond (fs) irradiation is more effective for heat generation than cw illumination as we need much less average power (factor 20 to 60) to detect heat-induced effects.
The droplets (solvent condensate) we observe in our experiments are different in nature to so-called nano- or micro-bubbles described in the literature.36,39 Nanobubbles exist at solid–liquid interfaces and cannot be observed by our microscopic setup. Microbubbles do not consist of solvent steam but of air molecules that were dissolved in the liquid (usually water). When removing the laser source, microbubbles shrink slowly whereas solvent evaporation immediately stops. Baffou et al. investigated microbubbles that were generated by cw illumination.36 At high fs laser power, we also observe the formation of such microbubbles within the liquid-filled channel that do not disappear immediately after turning off the laser (not shown). Those bubbles slowly decrease in size and then disappear; they don't even move with the liquid flow. This sort of bubbles will not be discussed further in this paper.
Liquid immobilization
Second, we wanted to demonstrate the effect of liquid immobilization. We tested three different gold nanodot arrays with resonance wavelengths of 774, 850, and 880 nm to determine the laser power/fluence thresholds for this effect. In Fig. 5, microscopic snapshots from videos that were recorded while liquid was flowing in the microfluidic channel (indicated by the latex beads added into the pluronic solution) are displayed (the snapshots were taken when the laser was switched on). In this experiment, we avoided air in the channel. Once a good flow of liquid was established, we placed the laser spot with respect to the channel and monitored the liquid flow by video while switching the laser on and off. With the laser switched on and depending on the applied laser power, we observed flow stop due to gelation of the pluronic solution only in areas collocated with the laser spot. Starting the experiment with high power, the affected area was rather large and decreasing in size with decreasing applied laser power. The flow stop process was instantaneous but fully reversible. In some cases – especially at high laser power – it took a few seconds to establish unhindered flow again when the laser was switched off. In our first nanodot array sample with a resonance wavelength of 774 nm in water (Fig. 5a), we had to deal with dirt that was contaminating the microchannel. The blue-colored fragments that are visible in the snapshot images in Fig. 5a originated from the permanent marker that was used to mark the position where a hole was to be punched to connect the inlet structure through the PDMS chip. In this case, the pieces of marker made up an obstacle for the liquid that was actually helpful to study the laser influence on the liquid flow. Nevertheless, we avoided the use of permanent marker in other samples to ensure unhindered liquid flow in the microchannel.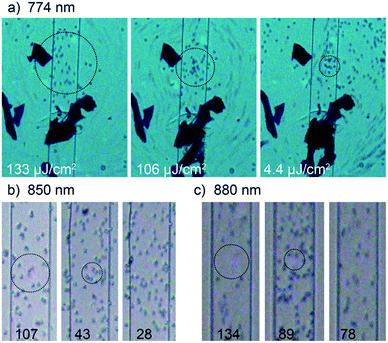 | ||
| Fig. 5 In-resonance laser experiment to determine fluence threshold for liquid immobilization at wavelengths 774 nm (a), 850 nm (b), and 880 nm (c) displayed as microscopic snapshot images from recorded videos (see videos 1–9 in ESI†). The applied fluence is given at the bottom of each image in μJ cm−2. The affected area is indicated by the black circle. The channel width is 30 μm. | ||
As described above, we did the experiments starting at high laser power and decreasing it stepwise until we could not observe an influence on the flow anymore including repeated experiment close to the threshold power necessary to still affect the flow. The circles in Fig. 5 indicate the area where beads are immobilized. The size of this area decreases with laser power and disappears below threshold.
When the liquid is flowing rather fast (sample with 775 nm resonance wavelength in Fig. 5a and videos 1–3 in the ESI†), one could see blurred lines of moving latex beads in liquid. When the laser is switched on, we observed an area (black circle) where beads were clearly visible because they were immobilized in the gelled pluronic solution and thus not moving anymore, whereas outside of this area, the liquid was still moving unaffectedly (see blurred lines in periphery in images in Fig. 5a). The size of the gelled area decreased with decreasing applied laser power as expected (compare images in Fig. 5a). Below a certain threshold laser power, no gelation of the pluronic solution was detected as the movement of beads (hence the liquid flow) was not influenced.
Even though the flow was slower for samples with 850 nm and 880 nm resonance wavelength, the immobilization of beads was observed in these experiments too (Fig. 5b with videos 4–6 and 5c with videos 7–9†). For these two samples, the liquid flow was not hindered due to any dirt in the microchannel. We also observed the gelling of an area when the laser was switched on. Its size decreased with decreasing laser power for both samples until the power was so low that it did not influence the flow anymore (compare black circles in images of Fig. 5).
Again, we calculated the fluences at sample position for each sample to simplify comparison between samples. We found quite similar threshold fluences for the three samples in the μJ cm−2 regime spanning from 35 to 89 μJ cm−2 (Table 2). Similar to the process of solvent evaporation, the conversion of laser energy is directly dependent on the absorption properties of the nanostructures.32,38 We found similar absorption behavior for all used nanostructures (Fig. SI1†) resulting in similar threshold fluences for all used wavelengths.
Additionally, negative controls without gold nanodot arrays were performed at all laser wavelengths used in the experiments before. Microscopic snapshots and videos can be found in the ESI, Fig. SI2 and videos 10–15†. In general, on samples without nanostructures solvent evaporation or liquid flow stop was only observed at very high laser fluence (50 times higher than the threshold values in the presence of nanodot arrays).
Wavelength-dependent experiments
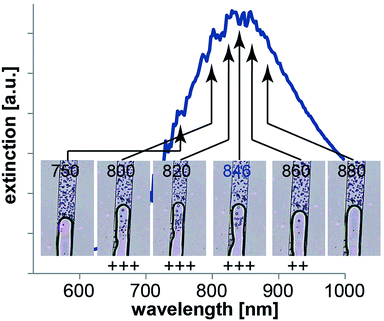
To consolidate the influence of the plasmonic carpet, we performed wavelength dependent measurements to show off-resonance effects and demonstrate multiplexing capabilities of nanodot arrays.In Fig. 6 microscopic snapshots from videos recorded during a solvent evaporation experiment are displayed. In this experiment, the liquid was slowly flowing through the microfluidic channel from the top to the bottom. The water phase with the latex beads (top) is again well distinguishable from the air phase (bottom). The videos were once again recorded while moving the sample back and forth so that the liquid meniscus is moved in and out of the laser spot (reddish spot in Fig. 6 still visible for 750 nm). However, we kept the laser fluence constant for this experiment but varied the laser wavelength. As the applied power we chose to use approximately three times the threshold fluence needed to still observe solvent evaporation (here 28 μJ cm−2) at 846 nm resonance wavelength. We decided to work slightly above the threshold power to comfortably observe droplet formation. We expect that droplets originating from the air–water interface will or will not be observed depending on the laser wavelength used. Shifting away (red or blue) from the resonance wavelength should result in less droplet formation since the absorption is not optimal anymore. Accordingly, the heating of the nanodots will decrease and less and less solvent evaporation is expected. In other words, it is expected to need higher laser power at any wavelength that is not the resonant wavelength to achieve the same effect as with threshold laser power at resonance wavelength.
As indicated by the plus signs in Fig. 6, we indeed observed different behavior with regard to droplet formation depending on the laser wavelength. Starting the experiment at resonance wavelength we observed lots of droplets. Also at 820 nm and 800 nm we detected significant solvent evaporation. Moving to 750 nm we could not detect any more droplets. Shifting the wavelength further into the NIR we detected less droplets at 860 nm compared to the experiment at 846 nm and no droplet formation at 880 nm. Hence, our experimental data match well with our previous considerations that at wavelengths shifted from the resonant wavelength we don't observe solvent evaporation (or at least decreased the effect) at laser powers that cause clear heating of nanostructures at resonant wavelength.
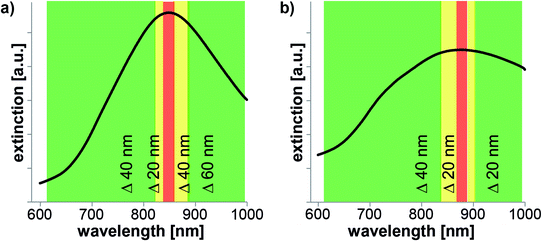
Fig. 7 shows results from flow stop experiments using two nanodot arrays. Again, videos were recorded with alternately switching the laser on and off while the liquid was (slowly) flowing through the channel. As in the case of wavelength-dependent experiments for solvent evaporation, the laser power was kept constant and the laser wavelength was changed. For these experiments, we expect a similar trend of the influence of the laser wavelength as seen in the wavelength-dependent solvent evaporation experiments. Changing the laser wavelength should result in less influence of the liquid flow since the absorption (and consequently the heating) is not optimal anymore. We want to discuss results from arrays with 850 nm and 880 nm resonance wavelength (Fig. 7a and b) that were illuminated at the laser threshold fluence measured in the previous experiments. As expected, we observed less influence on the liquid immobilization for both samples when changing the laser wavelength. In particular, for the 850 nm sample (Fig. 7a) we detected flow stop at 850 nm with a laser fluence of 42 μJ cm−2 (red area in Fig. 7a) and could still detect a slight influence on the liquid flow at 830, 870, and 890 nm although the affected area was very small (yellow area in Fig. 7a). In the experiment only very few latex beads were immobilized when the laser was on. For 790 and 810 nm we observed no flow stop as latex beads were moving through the laser spot with the same speed as when the laser was off (green area in Fig. 7a). The second sample with 880 nm resonance wavelength was illuminated with a fluence of 89 μJ cm−2 (Fig. 7b) and we found similar results. We detected an influence on the liquid flow for 880 nm (at resonance, red area in Fig. 7b) and for 860 nm, and 890 nm (yellow area in Fig. 7b). On this array, it is sometimes not a clear flow stop but more like a turbulent flow; especially for 860 nm laser wavelength. At 840 nm and 800 nm the flow is not stopped as well as at 900 and 920 nm as latex beads could be seen that move through the laser spot area (green areas in Fig. 7b).
Therefore, the experimental data confirm our previous expectation that at non-resonant wavelengths we observe less and less influence of laser light (at threshold fluence) due to non-optimal heating of nanostructures.
These examples serve as a good example to demonstrate that one has to carefully choose the laser fluence when heating needs to be confined to a certain area or in potential applications with multiplexing to avoid crosstalk between several wavelengths. Both experiments (solvent evaporation and liquid immobilization) that were performed close to the threshold fluence show that it is possible to (i) confine the heat to a small area and (ii) to limit crosstalk between several wavelengths as long as the peaks are well separated from each other. Indeed, already 20 nm away from the resonance wavelength (Fig. 7), the influence of the laser is much less and 40 nm away, the affected area is nearly gone. Therefore, even though the plasmonic resonances of gold nanostructures tend to be broad with a full width at half maximum up to ∼200 nm (see Fig. 2 or SI1†) a 20 nm laser tuning off the resonance is enough to modify the thermal behavior. Finally, these experiments show that multiplexing is possible even for quite broad bandwidth leading to very versatile lab-on-a-chip applications.
Heat generation simulation
To properly model the microfluidic chip's performance, we performed thermal simulations with COMSOL Multiphysics.40 For those simulations, we used the absorption coefficient of the plasmonic nanostructure as obtained from simulations of the periodic array by the Fourier Modal Method (FMM).34,35 For detailed information on the implemented geometry we refer to the ESI, Fig. SI3.† The material constants used were taken from Johnson and Christy.41Three different plasmonic structures were simulated according to the measured threshold laser fluences in both experimental approaches (solvent evaporation and liquid immobilization) as shown in Table 3. The absorption data was extracted from theoretical simulations (Fig. SI4†).
| Size of dot (by SEM) | Height of dot (by AFM) | Resonance wavelength (n = 1.33) | Laser fluence threshold for solvent evaporation | Laser fluence threshold for liquid immobilization |
|---|---|---|---|---|
| 200 nm | 30 nm | 774 nm | No simulation | 35 μJ cm−2 |
| 215 nm | 40 nm | 850 nm | 4.3 μJ cm−2 | 42 μJ cm−2 |
| 235 nm | 35 nm | 880 nm | 13 μJ cm−2 | 89 μJ cm−2 |
The plasmonic structure is replaced by a heat source of a fixed radius, determined by the total amount of absorbed laser power and the laser beam width. The microfluidic structure is similar for each chip, with a PDMS layer, a fluidic layer containing water, and a glass substrate as shown in Fig. 1c and 8a. The measured laser spot diameter for different wavelengths was taken into account for the simulations. For all simulations, heat is not only transferred to the liquid surrounding the nanostructures but also to the PDMS as well as the glass substrate (see insets in Fig. 8 and 9).
First, simulations to cause evaporation of liquid from a meniscus inside a fluidic channel are discussed for two nanodot sizes. As shown in Fig. 8b and c, both simulations show a slight temperature change within the fluidic channel of 2.3 K and 0.1 K for 850 nm and 880 nm, respectively. Besides heating also pressure comes into play in this case. The slight temperature change within a confined space causes a small vapor pressure differential required to cause evaporation at the liquid–air interface. As explained by Baffou et al., due to the very small curvature of the generated bubbles, a higher inner pressure is expected compared to the surroundings.32 Thus, the simulation model is too simple to explain the evaporation of solvent in our experiments with considering only temperature. We believe that more complex processes occur at the liquid–air interface.
Second, simulations to phase change the pluronic solution are discussed for three different arrays according to Table 3. As shown in Fig. 9a–c, all simulations display a significant temperature increase to at least 40 °C. The pluronic solution used in the experiment undergoes phase change at 37 °C.37 Hence, the predicted temperature increase due to nanostructure-induced heating is sufficient to change phase of the pluronic solution and decrease fluidic flow (eventually) immobilizing the liquid as observed in the experiments.
Baffou et al. have described a rather confined temperature regime with fs pulsed illumination for arrays with large interparticle distances (periodicity ∼ four to five times the length of the nanostructure).30 In our case, we expect a more uniform temperature distribution due to the smaller periodicity of the nanostructures used here involving collective effects from (immediate) neighbors. Indeed, we observe quite uniform elevated temperatures across the laser spot from the simulations (Fig. 9).
The two dimensional simulations fit well with the experimental results. Especially, we obtained the expected temperature for stopping the flow upon gelation of the pluronic. Ideally, we should perform three dimensional simulations in future works.
Conclusion
To conclude, we demonstrated the fabrication of gold nanodots arrays for thermo-plasmonics experiments in an optofluidic chip. We measured the power and wavelength dependencies of plasmonic nanodots with resonances spanning from 750 to 880 nm. We showed that already 20 nm off the resonance, thermal effects are highly reduced when adjusting the power close to the threshold and 30 to 40 nm off resonance there is no thermal effects anymore. This result clearly allows for performing multiplexing experiments on chip while using a narrow range of wavelengths and even close-by resonant structures.Furthermore, simpler light sources than a Ti![[thin space (1/6-em)]](https://www.rsc.org/images/entities/char_2009.gif) :
:![[thin space (1/6-em)]](https://www.rsc.org/images/entities/char_2009.gif) Sa oscillator can be used, since the tuning range can be narrower and the power needed is on the order of a few milliwatts. Such experiments are also possible with continuous wave laser but the threshold powers will be higher. Thus, combining lithography, plasmonics, and optofluidics seems a robust and versatile solution for future lab-on-a-chip devices either for chemical or biological applications. From a more fundamental point of view, this system is also convenient for studying the complicated thermodynamics involved with plasmonic nanostructures which is the current focus of many research groups.
Sa oscillator can be used, since the tuning range can be narrower and the power needed is on the order of a few milliwatts. Such experiments are also possible with continuous wave laser but the threshold powers will be higher. Thus, combining lithography, plasmonics, and optofluidics seems a robust and versatile solution for future lab-on-a-chip devices either for chemical or biological applications. From a more fundamental point of view, this system is also convenient for studying the complicated thermodynamics involved with plasmonic nanostructures which is the current focus of many research groups.
Acknowledgements
This work was supported by the Carl Zeiss Foundation and the Pro Chance program of the FSU Jena. The authors give thanks to the Leibniz Institute of Photonic Technology for providing access to the AFM and Benny Walther (IAP Jena) for designing the rendered TOC figure.Notes and references
- A. Polman and H. A. Atwater, Mater. Today, 2005, 8, 56 CrossRef.
- H. A. Atwater and A. Polman, Nat. Mater., 2010, 9, 205 CrossRef CAS PubMed.
- J. Petschulat, D. Cialla, N. Janunts, C. Rockstuhl, U. Hübner, R. Möller, H. Schneidewind, R. Mattheis, J. Popp, A. Tünnermann, F. Lederer and T. Pertsch, Opt. Express, 2010, 18, 4184 CrossRef CAS PubMed.
- S. Kühn, U. Hakanson, L. Rogobete and V. Sandoghdar, Phys. Rev. Lett., 2006, 97, 17402 CrossRef.
- L. R. Hirsch, R. J. Stafford, J. A. Bankson, S. R. Sershen, B. Rivera, R. E. Price, J. D. Hazle, N. J. Halas and J. L. West, Proc. Natl. Acad. Sci. U. S. A., 2003, 100, 13549 CrossRef CAS PubMed.
- A. M. Gobin, M. H. Lee, N. J. Halas, W. D. James, R. A. Drezek and J. L. West, Nano Lett., 2007, 7, 1929 CrossRef CAS PubMed.
- E. B. Dickerson, E. C. Dreaden, X. Huang, I. H. El-Sayed, H. Chu, S. Pushpanketh, J. F. McDonald and M. A. El-Sayed, Cancer Lett., 2008, 269, 57 CrossRef CAS PubMed.
- H. Takahashi, Y. Niidome and S. Yamada, Chem. Commun., 2005, 2247 RSC.
- P. K. Jain, W. Qian and M. A. El-Sayed, J. Am. Chem. Soc., 2006, 128, 2426 CrossRef CAS PubMed.
- L. Paasonen, T. Laaksonen, C. Johans, M. Yliperttula, K. Kontturi and A. Urtti, J. Controlled Release, 2007, 122, 86 CrossRef CAS PubMed.
- E. Y. Lukianova-Hleb, A. P. Samaniego, J. Wen, L. S. Metelitsa, C.-C. Chang and D. O. Lapotko, J. Controlled Release, 2011, 152, 286 CrossRef CAS PubMed.
- A. S. Urban, T. Pfeiffer, M. Fedoruk, A. A. Lutich and J. Feldmann, ACS Nano, 2011, 5, 3585–3590 CrossRef CAS PubMed.
- A. Csaki, F. Garwe, A. Steinbruck, G. Maubach, G. Festag, A. Weise, I. Riemann, K. Konig and W. Fritzsche, Nano Lett., 2007, 7, 247 CrossRef CAS PubMed.
- F. Garwe, U. Bauerschäfer, A. Csaki, A. Steinbrück, K. Ritter, A. Bochmann, J. Bergmann, A. Weise, D. Akimov, G. Maubach, K. K. önig, G. Hüttmann, W. Paa, J. Popp and W. Fritzsche, Nanotechnology, 2008, 19, 55207 CrossRef CAS PubMed.
- D. Boyer, P. Tamarat, A. Maali, B. Lounis and M. Orrit, Science, 2002, 297, 1160 CrossRef CAS PubMed.
- D. Lasne, G. A. Blab, S. Berciaud, M. Heine, L. Groc, D. Choquet, L. Cognet and B. Lounis, Biophys. J., 2006, 91, 4598–4604 CrossRef CAS PubMed.
- J. R. Adleman, D. A. Boyd, D. G. Goodwin and D. Psaltis, Nano Lett., 2009, 9, 4417 CrossRef CAS PubMed.
- P. Christopher, H. Xin and S. Linic, Nat. Chem., 2011, 3, 467 CAS.
- M. T. Carlson, A. J. Green and H. H. Richardson, Nano Lett., 2012, 12, 1534 CrossRef CAS PubMed.
- R. H. Farahi, A. Passian, T. L. Ferrell and T. Thundat, Opt. Lett., 2005, 30, 616 CrossRef CAS.
- V. Garcés-Chávez, R. Quidant, P. J. Reece, G. Badenes, L. Torner and K. Dholakia, Phys. Rev. B: Condens. Matter Mater. Phys., 2006, 73, 85417 CrossRef.
- X. Miao, B. K. Wilson and L. Y. Lin, Appl. Phys. Lett., 2008, 92, 124108 CrossRef PubMed.
- I. Choi, Y. S. Huh and D. Erickson, Lab Chip, 2011, 11, 632 RSC.
- D. A. Boyd, L. Greengard, M. Brongersma, M. Y. El-Naggar and D. G. Goodwin, Nano Lett., 2006, 6, 2592 CrossRef CAS PubMed.
- C. N. Baroud, J.-P. Delville, F. Gallaire and R. Wunenburger, Phys. Rev. E: Stat., Nonlinear, Soft Matter Phys., 2007, 75, 46302 CrossRef.
- G. L. Liu, Y. Yin, S. Kunchakarra, B. Mukherjee, D. Gerion, S. D. Jett, D. G. Bear, J. W. Gray, A. P. Alivisatos, L. P. Lee and F. F. Chen, Nat. Nanotechnol., 2006, 1, 47 CrossRef CAS PubMed.
- D. A. Boyd, J. R. Adleman, D. G. Goodwin and D. Psaltis, Anal. Chem., 2008, 80, 2452 CrossRef CAS PubMed.
- S. R. Sershen, G. A. Mensing, M. Ng, N. J. Halas, D. J. Beebe and J. L. West, Adv. Mater., 2005, 17, 1366 CrossRef CAS.
- J. S. Donner, G. Baffou, D. McCloskey and R. Quidant, ACS Nano, 2011, 5, 5457 CrossRef CAS PubMed.
- G. Baffou, P. Berto, E. Bermúdez Ureña, R. Quidant, S. Monneret, J. Polleux and H. Rigneault, ACS Nano, 2013, 7, 6478 CrossRef CAS PubMed.
- G. Baffou, P. Bon, J. Savatier, J. Polleux, M. Zhu, M. Merlin, H. Rigneault and S. Monneret, ACS Nano, 2012, 6, 2452 CrossRef CAS PubMed.
- G. Baffou and R. Quidant, Laser Photonics Rev., 2013, 7, 171 CrossRef CAS.
- K. S. Elvira, X. Casadevall i Solvas, R. C. R. Wootton and A. J. de Mello, Nat. Chem., 2013, 5, 905 CrossRef CAS PubMed.
- L. Li, J. Opt. Soc. Am. A, 1997, 14, 2758 CrossRef.
- E. Noponen and J. Turunen, J. Opt. Soc. Am. A, 1994, 11, 2494 CrossRef.
- G. Baffou, J. Polleux, H. Rigneault and S. Monneret, J. Phys. Chem. C, 2014, 118, 4890 CAS.
- C. Y. Gong, S. Shi, P. W. Dong, X. L. Zheng, S. Z. Fu, G. Guo, J. L. Yang, Y. Q. Wei and Z. Y. Qian, BMC Biotechnol., 2009, 9, 8 CrossRef PubMed.
- V. K. Pustovalov, Chem. Phys., 2005, 308, 103 CrossRef CAS PubMed.
- J. H. Weijs and D. Lohse, Phys. Rev. Lett., 2013, 110, 54501 CrossRef.
- COMSOL Multiphysics, http://www.comsol.com.
- P. B. Johnson and R. W. Christy, Phys. Rev. B: Solid State, 1972, 6, 4370 CrossRef CAS.
Footnote |
| † Electronic supplementary information (ESI) available: Experimental details, microscopic images and videos of control experiments without nanodots. Geometry and simulated absorption properties of the nanodot arrays. Videos for power- and wavelength-dependent flow experiments. See DOI: 10.1039/c4ra13312a |
| This journal is © The Royal Society of Chemistry 2014 |

