DOI:
10.1039/C4RA12691B
(Paper)
RSC Adv., 2014,
4, 59792-59802
Fully biodegradable food packaging materials based on functionalized cellulose nanocrystals/poly(3-hydroxybutyrate-co-3-hydroxyvalerate) nanocomposites
Received
19th October 2014
, Accepted 3rd November 2014
First published on 4th November 2014
Abstract
Current packaging materials (mainly composed of petroleum-based synthetic polymers) face environmental and disposal issues, and as a result, developing eco-friendly and bio-based nanocomposites as alternatives have motivated academic and industrial research. We report here on our effort to develop a transparent nanocomposite-based packaging film comprised of poly(3-hydroxybutyrate-co-3-hydroxyvalerate) (PHBV) and functionalized cellulose nanocrystals (cellulose nanocrystal methyl ester, CNC-me). The resultant CNC-me with hydrophobic ester groups are uniformly dispersed in PHBV without the aid of a compatibilizer or surfactant. Therefore, both the crystallization temperature and crystallinity of the PHBV matrix were increased due to the heterogeneous nucleating effect of CNC-me. With an increase of CNC-me concentration, significant improvements in mechanical performance, thermal stability, barrier and migration properties were achieved, which were ascribed to the improved interfacial interaction and increased crystallinity. Compared to neat PHBV, the tensile strength and maximum decomposition temperature (Tmax) of the nanocomposites all achieved their maximum values at loading levels of 20 wt% CNC-me. Meanwhile the overall migration levels in both non-polar and polar simulants were well below the limits required by the current legislative standards for food packaging materials.
Introduction
In the last century, petroleum-based synthetic polymers have been widely used to prepare packaging materials due to their excellent thermal, and mechanical properties and relatively low cost. Unfortunately, these materials are not totally recyclable and/or biodegradable, and hence pose serious ecological problems (large number of thermoplastics wastes).1,2 Therefore, biodegradable alternatives are highly desired. Due to their fully degradable and renewable character, polyhydroxyalkanoates (PHAs) synthesized by bacterial fermentation have attracted special interests. Among the PHAs family, poly(3-hydroxybutyrate) (PHB) has been widely studied, and shows wide applications in the food packing, agriculture and tissue engineering fields due to biodegradability, biocompatibility and excellent mechanical performance.1,2 Nevertheless, the use of PHB has been limited due to several shortcomings such as high melting temperature, brittleness due to high crystallinity, low thermal degradation temperature and relatively high water vapour permeability (WVP). When adding 3-hydroxyvalerate (3HV) units into PHB, poly(3-hydroxybutyrate-co-3-hydroxyvalerate) (PHBV) can be fabricated and show lower melting temperature and crystallinity compared to PHB, thus PHBV should be more suitable for the industrial application.3–5 However, the lower crystallinity generally induces the reductions in mechanical strength and barrier property, which might restrict the use of PHBV in packaging applications. In addition, the application in food packaging has been also limited by some drawbacks such as weak mechanical properties, poor thermal stability and narrow processing window. Therefore, many intense efforts have been made to develop green nanocomposites using various reinforcements for biodegradable PHBV. Many inorganic1,2,4,6,7 and organic5,8–13 nanofillers have been used to reinforce PHBV matrix and thus improve the possibilities for PHBV as potential packaging materials. As expected, the crystallization behavior and thermal, mechanical, electrical, and gas barrier properties of the PHBV matrix were improved, especially the use of carbon nanotubes (CNTs) as reinforcing materials.2,4,6,7 However, the costs of CNTs are expensive, and they are not biodegradable due to green environmental issues. Besides, an high transparency of PHBV is lost in the nanocomposites reported by most previous studies.2,7
Because of good mechanical property, low cost, degradable and renewable character,14,15 cellulose nanocrystals (CNCs) as biobased reinforcing nanofillers have been used to enhance the mechanical property and thermal stability of PHBV.8–13 The incorporation of CNCs caused a significant stiffness increase at filler concentrations in the range of 1–10 wt%,11 but there are still some obstacles for their use. For example, due to the hydrophilic nature of the CNCs, they are difficultly dispersed into relatively hydrophobic PHBV matrix, and thus they often aggregate easily, leading to low reinforcement efficiency of CNCs in the nanocomposites due to poor interfacial compatibility between two components. Thus the dispersion of CNCs and their compatibility within the PHBV matrix are improved by addition of compatibilizer or surfactant and template method based on solvent exchange.8–13 The compatibilizers have inhibited the formation of hydrogen bonding interactions between the CNCs and PHBV, thus the maximum degradation temperature (Tmax) of the nanocomposite with 5 wt% was decreased from 295 to 290 °C.8,10 Also, the addition of surfactants and CNCs would cause the decrease in thermal degradation temperature of PHBV. Compared to neat matrix, the degradation temperature was reduced from 314 to 302 °C for the nanocomposites with 3 wt% CNCs, but the mechanical performances of the nanocomposites are enhanced by 47%.13 In addition, the solvent exchange process is helpful to homogenous dispersion of CNCs into PHBV matrix, thus more hydrogen bonding interactions between two components are formed. Therefore, simultaneous enhancements on the mechanical property and thermal stability of PHBV after were achieved by introducing CNCs. Compared to neat PHBV, a 149% improvement in tensile strength and 250% increase in Young's modulus can be obtained for the nanocomposites with 10 wt% CNCs, meanwhile the Tmax was increased by 47.1 °C.12 Martínez-Sanz et al. have also found that the addition of solvent exchanged bacterial cellulose nanocrystals (1 wt%) resulted in an increase of the onset degradation temperature from 239.4 to 245.0 °C due to hydrogen bonding interaction between the nanofiller and the matrix, although CNCs did not significantly improve the mechanical and barrier properties of PHBV.9 From above, solvent exchange process was complicated and time consuming due to repeatedly successive centrifugation steps.11–13 Besides, the hydrogen bonding interactions induced a reduction in the crystallinity of the nanocomposites, which may impair the barrier properties for food packaging application. Therefore, simultaneous modulation between hydrogen bonding interactions and crystallinity in the nanocomposites is a key problem for developing PHBV/CNC nanocomposites as food packaging materials.
In this work, functionalized cellulose nanocrystals (CNC-me) are fabricated through simultaneous occurrence of commercial microcrystalline cellulose hydrolysis and esterification of hydroxyl groups using mixtures of formic and hydrochloric acid (HCOOH–HCl). The hydronium ions of the HCl dissociation can remove amorphous cellulose regions and also catalyze the esterification of hydroxyl groups on the exposed cellulose chains to produce CNC-me with many hydrophobic ester groups (Scheme 1), which can improve nanofiller dispersion and its compatibility within PHBV matrix. Also, surface ester groups of CNC-me would modulate the formation of hydrogen bonding interactions to avoid the decrease of nanocomposite crystallinity, as compared to unmodified CNCs.11,12 Therefore, the influence of CNC-me with different concentrations on the morphology, crystallization behavior, thermal, mechanical, barrier and overall migration properties of the nanocomposites are evaluated. Our results suggest a great potential to use such nanocomposites for developing fully biodegradable food packaging materials in future.
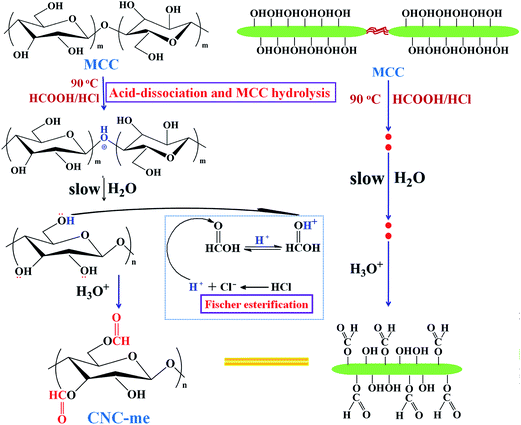 |
| | Scheme 1 Reaction scheme illustrating the simultaneous occurrence of cellulose hydrolysis and esterification of hydroxyl groups using HCOOH–HCl acids. | |
Experimental
Materials
Commercial microcrystalline celluloses (MCCs) were purchased from Shanghai Chemical Reagents (Shanghai, China). Poly(3-hydroxybutyrate-co-3-hydroxyvalerate) (PHBV, Mn = 5.90 × 10⁴, and the molar ratio of HV is 2.57%) was obtained from Tiannan Biological Material Co., Ltd (Ningbo, China) and purified by reprecipitation in methanol from chloroform solutions. Formic acid (HCOOH), hydrochloric acid (HCl), ammonia solution (NH3·H2O), chloroform, isooctane and ethanol (C2H5OH) were purchased from Guoyao Group Chemical Reagent CO., LTD. All the materials and reagents were used as received without further purification.
Extraction of functionalized cellulose nanocrystals
The functionalized cellulose nanocrystals (CNC-me) were prepared through HCOOH–HCl hydrolysis of commercial MCC, and Fischer esterification of accessible hydroxyl groups in one-pot process (Scheme 1). Commercial MCCs were submitted to acid hydrolysis with 90% (v/v) HCOOH–HCl at 90 °C for 3 h. After cooling to room temperature, the resultant suspension was neutralized with NH3·H2O solution, and washed by centrifugation until the pH of suspension was about 7. After 10 min of exposure to ultrasonic irradiation, the suspension was freeze-dried for 48 h for obtaining the dry CNC-me.
Preparation of the PHBV/CNC-me nanocomposites
PHBV/CNC-me nanocomposite films (1–20 wt% CNC-me) were prepared by solution casting technique, and then the nanocomposite films with the thickness of approximately 50–60 μm were obtained, and further dried under vacuum at 40 °C until no obvious absorption of chloroform (754 cm−1) appeared in the IR spectrum.
Characterizations and measurements
Transmission electron micrographs (TEM). Transmission electron micrographs (TEM) were carried out on a JEM-2100 electron microscope (JEOL, Japan) at 80 kV. A very small amounts of powdered CNC-me were dispersed separately in distilled water, and then negatively stained with a 2% (w/v) ethanol solution of uranyl acetate.
Contact angles measurement (CA). The contact angles of the MCC and CNC-me were measured using pendant drop method on a Dataphysics OCA40 contact angle analyzer at room temperature. About 2 μL of deionized water was dropped onto the surface at a contact time of 5 s. The powdered MCC and CNC-me were compacted under a pressure of 20 MPa with a KBr press to obtain samples with smooth surfaces. Ten independent determinations at different sites of the sample were averaged.
Fourier transform infrared spectroscopy (FT-IR). FT-IR spectra were recorded on a Nicolet 8700 FT-IR spectrophotometer, operating at 64 scans and 2 cm−1 resolution in the region between 4000 and 400 cm−1 at room temperature. Pellets of dried CNC-me, PHBV and the nanocomposite films were made with KBr.
Optical properties. The optical properties of neat PHBV and the nanocomposite films were characterized on a UV-Vis spectrophotometer (Hitachi U-2900, Japan), Each spectrum was collected in the wavelength interval ranging from 200 to 900 nm.
Field emission scanning electron microscopy (FE-SEM). The morphology of MCC, CNC-me and fracture morphologies of the nanocomposite films were observed on a field emission scanning electron microscopy (FE-SEM, HITACHI S-4800) at 5.0 kV. The films were frozen in liquid nitrogen and fractured.
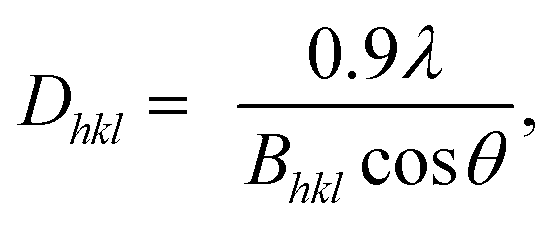
Wide-angle XRD measurements (WAXD). Wide-angle XRD measurements (WAXD) were carried out on a RIGAKU D/Max-2550 PC diffractometer by using Cu Kα (1.5418 Å) radiation (40 kV, 40 mA) with steps of 3° min−1 at room temperature. All the samples were kept for 2 weeks at room temperature to reach equilibrium crystallization before measuring. The crystallinity was taken as the ratio of the sum of areas under the crystalline diffraction peaks to the total area under the curve between 2θ = 10 and 60°. The crystallite sizes of 002 lattice planes were estimated by using Scherrer equation:11| |
 | (1) |
where Dhkl is the crystallite size in the direction normal to the hkl family of lattice planes, λ is the radiation wavelength (1.54 Å), and Bhkl is the full width at half-maximum in radians of the reflection of that family of lattice planes.
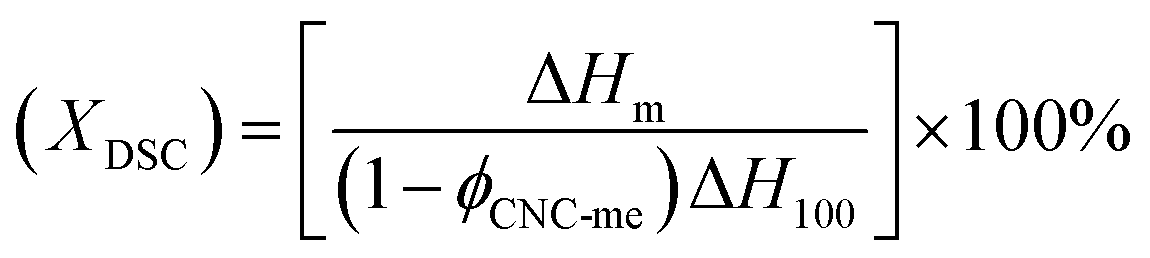
Non-isothermal crystallization and melting behavior. The non-isothermal crystallization and melting behavior were performed using a TA instruments Q20 differential scanning calorimeter by employing a flow of dry nitrogen as a purge gas. Firstly, the previous thermal history was eliminated by scanning from room temperature to 200 °C at a rate of 20 °C min−1, and keeping at 200 °C for 5 min. Then, the sample was cooled to 0 °C at a rate of 10 °C min−1, and heated again to 200 °C at a rate of 10 °C min−1. The crystallinity  , where XDSC is the crystallinity, ϕCNC-me is the weight fraction of CNC-me. The ΔHm is the measured melting enthalpies and ΔH100 is chosen as 146.6 J g−1 for heat of fusion of 100% crystalline PHBV due to the low HV concentration of PHBV in our study.5,7
Tensile tests. Tensile tests were measured on a mechanical testing equipment (Instron 2345) at 20 °C with a relative humidity (RH) of 65% and a crosshead speed of 1 mm min−1. Before measuring, all the samples were conditioned in the controlled environment for at least 24 h. Dumbbell-shaped samples were used (4 × 50 mm2, 50–60 μm in thickness), and 10 replicates were tested to check repeatability.
Thermal stability. The thermal stability of the films was carried out using Netzsch TG209 F1 thermogravimetric analyzer (TGA). The samples (5–10 mg) were heated from room temperature to 600 °C at a rate of 10 °C min−1 using a dynamic nitrogen atmosphere (30 mL min−1).
Water absorption. The water absorption for neat PHBV and the nanocomposite films were determined by our previous reported method.2 The samples were thin rectangular strips with an area of 10 cm2, which were dried in a desiccator at 0% RH for 1 week until a constant weight was attained. Then the films were placed in a beaker at 100% RH and allowed to absorb water until a constant weight was reached. Water uptake was calculated as follows:| |
 | (2) |
where W0 and Wt are the weights of the sample before exposure to 100% RH and after t hours of exposure to 100% RH, respectively. Average values for five replicates were reported.
Water vapor permeability (WVP). Water vapor permeability (WVP, in kg m m−2 s−1 Pa−1) was determined according to previous reported methods.1,2,9 Briefly, a 10 cm2 sample was sealed in a bottle mouth and then into an ES-315 portable autoclave sterilizer at 120 °C for 10 min with a pressure of 110 kPa. When the temperature was cooled to room temperature, the penetration of water vapor through the film was almost finished, and the condensation water inside bottle was weighed. Finally, the WVP can be calculated as follows:| |
 | (3) |
where Δm is the mass change of the samples (kg) at time t (s), S is the test area (m2), e is the film thickness (m), and P is the saturation pressure (Pa) at 120 °C.
Overall migration tests. Overall migration tests were performed in two liquid food simulants (isooctane and 10% (v/v) ethanol) according to the Commission Regulation EU no. 10/2011 as previously reported.1,2,16,17 Nanocomposite films with a total area of 10 cm2 were immersed in a glass tube with 10 mL of each food simulant. Then the tube was completely sealed to avoid loss of the simulants. Samples in 10% ethanol were kept in a controlled chamber at 40 °C for 10 days according to the Regulation EU no. 10/2011 (Commission Regulation EU 10/2011), while samples in isooctane were kept at 20 °C for 2 days according to the EN 1186-1:2002 (European Standard EN 1186-1:2002). When the incubation period was finished, the films were removed, the simulants were evaporated and the residue was weighed using an analytical balance with ±0.1 mg precision. Then overall migration of simulants was taken as the weight ratio of residue per total simulant. For each sample, three replicates were performed and the average values were reported.
Results and discussion
Morphology and structure of CNC-me
Generally, the hydrophobic modification of cellulose nanocrystals is beneficial to improve the compatibility of CNCs within polymer matrix, thus leading to the enhancement of polymer properties.13,18,19 As shown in Fig. 1(a), the MCC was small irregular particles, and the dimension of the MCC particle was distributed in the range of 5–20 μm. By HCOOH–HCl acid hydrolysis of MCC, the TEM image of CNC-me confirms that the hydrolysis conditions could efficiently digest the amorphous cellulose domains, giving rise to rod-like structures with an approximate diameter of 10–20 nm and length of 200–300 nm (Fig. 1(b)). As shown in Fig. 1(c), it is found that the O–H stretching of 3270 cm−1 and out-of-plane O–H bending at 710 cm−1 appeared in both samples, implying the crystalline Iβ characteristic of the samples. However, a new peak at 1720 cm−1 corresponded to ester carbonyl stretching appeared in the spectrum of CNC-me, indicating that the hydrolysis of amorphous cellulose chains can be performed simultaneously with Fischer esterification reaction between the hydroxyl groups of CNCs and carboxyl groups of HCOOH, to form ester groups of CNC-me in a single step as shown in Scheme 1. Moreover, Fig. 1(d) shows that both MCC and CNC-me displayed the typical diffraction pattern of cellulose I, suggesting that no regeneration-crystalline happened in the process of Fischer esterification. In addition, the CNC-me have higher contact angle of 62° than 44.6° for unmodified CNC18,19 and 30° for MCC, indicating the improved hydrophobicity due to the existence of ester groups.
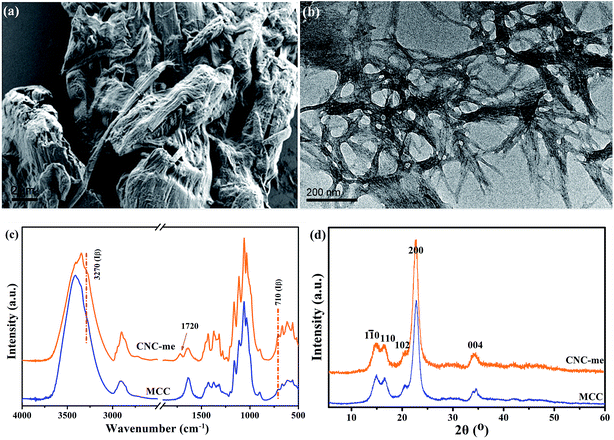 |
| | Fig. 1 FE-SEM image of MCC (a), TEM images of CNC-me (b), FT-IR spectra (c) and wide-angle X-ray diffraction (WAXD) patterns (d) of MCC and CNC-me. | |
Optical property
To determine the dispersion of CNC-me within the PHBV matrix, nanocomposite films with various CNC-me concentrations were visually examined for qualitative differences in transparency and external appearance (insert in Fig. 2). PHBV was a transparent polymer (transmittance of 84% at 800 nm wavelength). The transparency of PHBV matrix can be maintained with addition of below 10 wt% CNC-me concentration, suggesting that the CNC-me had good dispersion within the PHBV matrix so that the nanocomposites were free from light scattering. However, the nanocomposite films became fuzzy when CNC-me concentration exceeded 10 wt%. The UV-Vis transmittance spectra of neat PHBV and the nanocomposite films at visible wavelength range of 200–800 nm are shown in Fig. 2. With an increase of the CNC-me concentrations, the transmittance at 800 nm was decreased from 84% to 36% for the nanocomposite with 20 wt% CNC-me. At the same time, the color of nanocomposite film was becoming slightly opaque. These changes in the transmittance and color change may be due to the formation of fewer agglomerates in the nanocomposite films with high loading levels, even through CNC-me surface with many ester groups had good compatibility with PHBV matrix.
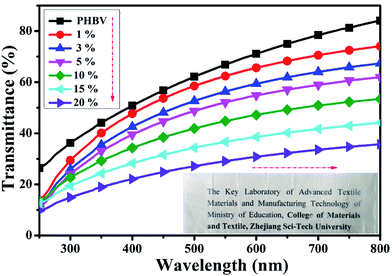 |
| | Fig. 2 UV-Vis transmittance spectra for neat PHBV and the nanocomposites with various CNC-me concentrations (the inset photographs of the samples shown in the direction). | |
Fractured morphology
Fig. 3 shows FE-SEM images of CNC-me and the nanocomposites. It was observed that CNC-me had a rod-like shape with 20 nm in average diameter and 200–300 nm in length. With incorporation of CNC-me, random and homogeneously dispersed CNC-me can be observed in the nanocomposite, without any agglomerates (yellow circle in Fig. 3). It suggests that the hydrophobic ester groups of CNC-me should be helpful to improve the compatibility between the nanofillers and matrix phases, and prevent nanoparticle aggregation. When CNC-me concentration was reached at 20 wt%, the diameter of more white dots became larger, and coarse film surfaces were observed, indicating the occurrence of slight agglomeration of CNC-me. However, there was no evidence of micro-scale agglomerates of CNC-me in any of the FE-SEM images. The good CNC-me dispersion and its compatibility within the PHBV matrix would greatly affected the transparency, thermal and mechanical properties of the resulting nanocomposites.
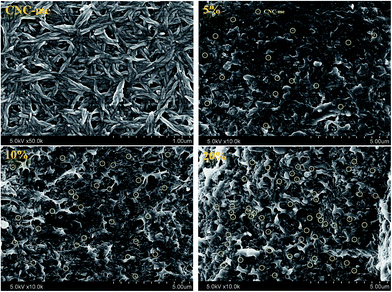 |
| | Fig. 3 FE-SEM images for CNC-me and the fractured morphologies of the nanocomposites with the CNC-me concentrations of 5, 10 and 20 wt%. | |
Chemical structure
Fig. 4(a) shows the FT-IR spectra for neat PHBV, CNC-me and the nanocomposites with various CNC-me concentrations. All the characteristic bands of PHBV and CNC-me appeared in the FT-IR spectra of the nanocomposites. For example, two bands at 2900 and 1636 cm−1 were assigned to C–H stretching and O–H bending vibrations for the CNC-me, respectively. They were also observed in the spectra for the nanocomposites. Moreover, two bands at 3436 and 3342 cm−1 were corresponded to free and hydrogen bonded O–H stretching vibrations, respectively.11,12 With the increase of CNC-me concentrations from 0 to 20 wt%, the intensity and area for the hydrogen bonded O–H band were increased. It indicates that the hydrogen bonding interaction between the residual hydroxyl groups of CNC-me as proton donors and carbonyl groups of PHBV as proton acceptors can be formed. In addition, with the increase of CNC-me concentration, the intensities of the two crystalline bands at 1054 and 975 cm−1 corresponding to C–O–C and C–C stretching vibration, respectively,9,20,21 were increased gradually, suggesting an increase of crystalline components in the nanocomposites.
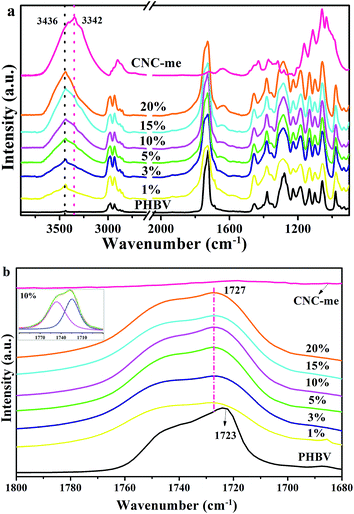 |
| | Fig. 4 FT-IR spectra (a) and carbonyl stretching region (νC![[double bond, length as m-dash]](https://www.rsc.org/images/entities/char_e001.gif) O) in the infrared spectra (b) for neat PHBV, CNC-me and the nanocomposites with various CNC-me concentrations and peak deconvolution for the nanocomposites with 10 wt% CNC-me (insert). O) in the infrared spectra (b) for neat PHBV, CNC-me and the nanocomposites with various CNC-me concentrations and peak deconvolution for the nanocomposites with 10 wt% CNC-me (insert). | |
FT-IR spectra of the carbonyl band in the range from 1800 and 1680 cm−1 were curve-fitted by using Gauss/Lorentz spectral function, which can be used to calculate the hydrogen bond fraction (FH–CO). As shown by the insert presented in Fig. 4(b), the band situated at around 1727 cm−1 can be assigned to the hydrogen bonded CO groups, and 1746 cm−1 to free CO groups.5,11 It was observed that compared to neat PHBV, the band position for hydrogen-bonded component increased to 1727 cm−1 for the nanocomposites. This increase in the CO band position was ascribed to weakening the CO polarity induced by intermolecular hydrogen bonding interaction between CNC-me and PHBV.
To further analyze the change of hydrogen bonding interaction in the nanocomposites, FH–CO values were calculated by the equation reported by previous work.11,22 Table 1 gives the FH–CO values of the nanocomposites as a function of the CNC-me concentrations. With an increase of the CNC-me concentrations, FH–CO value firstly increased from 0.12 to 0.28 for 20 wt% CNC-me. From above, it is clearly seen that the strongest intermolecular interaction appeared in the nanocomposite with 20 wt% CNC-me. Additionally, it should be noted that at the same loading levels, the FH–CO of the PHBV/CNC-me nanocomposites was lower than that for the PHBV/CNC nanocomposites (0.37, 10 wt% CNCs).12 It could be explained that many hydroxyl groups of CNC-me were esterified with carboxyl groups of HCOOH during preparation process of CNC-me (Fig. 1(c)), and thus the numbers of the formed hydrogen bonding interactions were reduced.
Table 1 Hydrogen bond fractions (FH–CO), crystallinities (Xc) and thermal parameters of non-isothermal crystallization and melting behaviors of neat PHBV, CNC-me and the nanocomposites with various CNC-me concentrations
| Sample |
FH–COa |
Xcb (%) |
D002b (nm) |
Tmc (°C) |
ΔHmc (J g−1) |
Tcc (°C) |
Tm1 (°C) |
Tm2 (°C) |
Tm3 (°C) |
ΔHm (J g−1) |
Tc(onset) − Tc (°C) |
| FH–CO was obtained from deconvoluted FT-IR spectra. Xc and D002 values were calculated from the WAXD patterns. |
| PHBV |
— |
58.1 |
30.9 |
— |
— |
41.2 |
97.0 |
111.7 |
130.7 |
74.7 |
24.3 |
| 1% |
0.12 |
58.3 |
17.3 |
36.2 |
12.8 |
38.6 |
101.5 |
122.9 |
136.9 |
74.1 |
22.9 |
| 3% |
0.16 |
58.8 |
16.1 |
42.2 |
31.9 |
36.7 |
105.7 |
125.9 |
138.2 |
73.6 |
21.0 |
| 5% |
0.22 |
59.5 |
12.5 |
44.9 |
34.9 |
34.9 |
102.8 |
123.4 |
137.4 |
72.6 |
20.9 |
| 10% |
0.25 |
60.0 |
9.7 |
54.1 |
42.6 |
— |
108.0 |
129.6 |
138.9 |
69.4 |
16.3 |
| 15% |
0.27 |
61.2 |
8.8 |
59.6 |
43.0 |
— |
118.2 |
136.6 |
144.8 |
66.5 |
14.8 |
| 20% |
0.28 |
62.4 |
7.9 |
62.8 |
45.3 |
— |
124.7 |
142.1 |
147.7 |
64.3 |
17.6 |
| CNC-me |
— |
84.8 |
6.0 |
— |
— |
— |
— |
— |
— |
— |
— |
Crystal structure
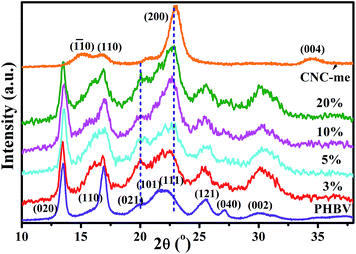
Fig. 5 shows the wide-angle X-ray diffraction (WAXD) patterns for neat PHBV, CNC-me and the nanocomposites. The CNC-me showed three characteristic cellulose I reflections, corresponding to the (1![[1 with combining macron]](https://www.rsc.org/images/entities/char_0031_0304.gif) 0), (110), and (200) crystallographic planes of the monoclinic cellulose I lattice.19,23 It was expected that CNC-me presents higher crystallinity (Xc) than that of MCC (Fig. 1(d)), suggesting the removal of the amorphous cellulose contents and other amorphous residues after hydrolysis. In addition, it confirms that the Fischer esterification reaction occurred only at the CNC-me surface. Moreover, compared to neat PHBV, an obvious reduction in the intensity for the (110) plane of the nanocomposites was observed, and accompanied by appearance of a shoulder (16.0°). It indicates that the crystal growth of PHBV in the (110) plane was restricted, but its preferential growth in other crystal planes occurred, such as (021) and (002) plane. Further, when the CNC-me concentrations increased from 0 to 20 wt%, the intensities for the (021) and (002) plane were obviously increased. Besides, compared to neat PHBV, the width at half-height of diffraction peak in the nanocomposites became broad, indicating the formation of smaller PHBV crystals. A similar phenomenon was also observed in the PHBV/modified CNC nanocomposites.13
0), (110), and (200) crystallographic planes of the monoclinic cellulose I lattice.19,23 It was expected that CNC-me presents higher crystallinity (Xc) than that of MCC (Fig. 1(d)), suggesting the removal of the amorphous cellulose contents and other amorphous residues after hydrolysis. In addition, it confirms that the Fischer esterification reaction occurred only at the CNC-me surface. Moreover, compared to neat PHBV, an obvious reduction in the intensity for the (110) plane of the nanocomposites was observed, and accompanied by appearance of a shoulder (16.0°). It indicates that the crystal growth of PHBV in the (110) plane was restricted, but its preferential growth in other crystal planes occurred, such as (021) and (002) plane. Further, when the CNC-me concentrations increased from 0 to 20 wt%, the intensities for the (021) and (002) plane were obviously increased. Besides, compared to neat PHBV, the width at half-height of diffraction peak in the nanocomposites became broad, indicating the formation of smaller PHBV crystals. A similar phenomenon was also observed in the PHBV/modified CNC nanocomposites.13
 |
| | Fig. 5 Wide-angle X-ray diffraction (WAXD) patterns of neat PHBV, CNC-me and the nanocomposites with various CNC-me concentrations. | |
Table 1 lists the crystallinity (Xc) and crystallite sizes (D002) of neat PHBV, CNC-me and the nanocomposites. The nanocomposites showed higher crystallinity than that of neat PHBV. With increasing CNC-me concentration, the Xc increased gradually from 58.1% to a maximum value of 62.4% for the nanocomposite with 20 wt% CNC-me. These results indicate that the CNC-me as a heterogeneous nucleating agent can greatly increase the nucleation and crystallization rate, leading to more perfect PHBV crystals. Moreover, the D002 of the nanocomposite was lower than that of neat PHBV, and decreased dramatically with the CNC-me concentrations, which indicated that CNC-me hindered the diffusion and folding of PHBV chains due to the confinement effects.10–13 The strongest confinement effects in the nanocomposites might be ascribed to larger interfacial areas resulting from homogeneous dispersion of CNC-me within PHBV as revealed by FE-SEM observations (Fig. 3). Similar phenomenon was found in PHBV/CNC nanocomposites reported by Ten et al.10 and our group.11,12 In general, the refined crystal structures could contribute to an improvement in the mechanical properties of the nanocomposites.
Non-isothermal crystallization and melting behavior
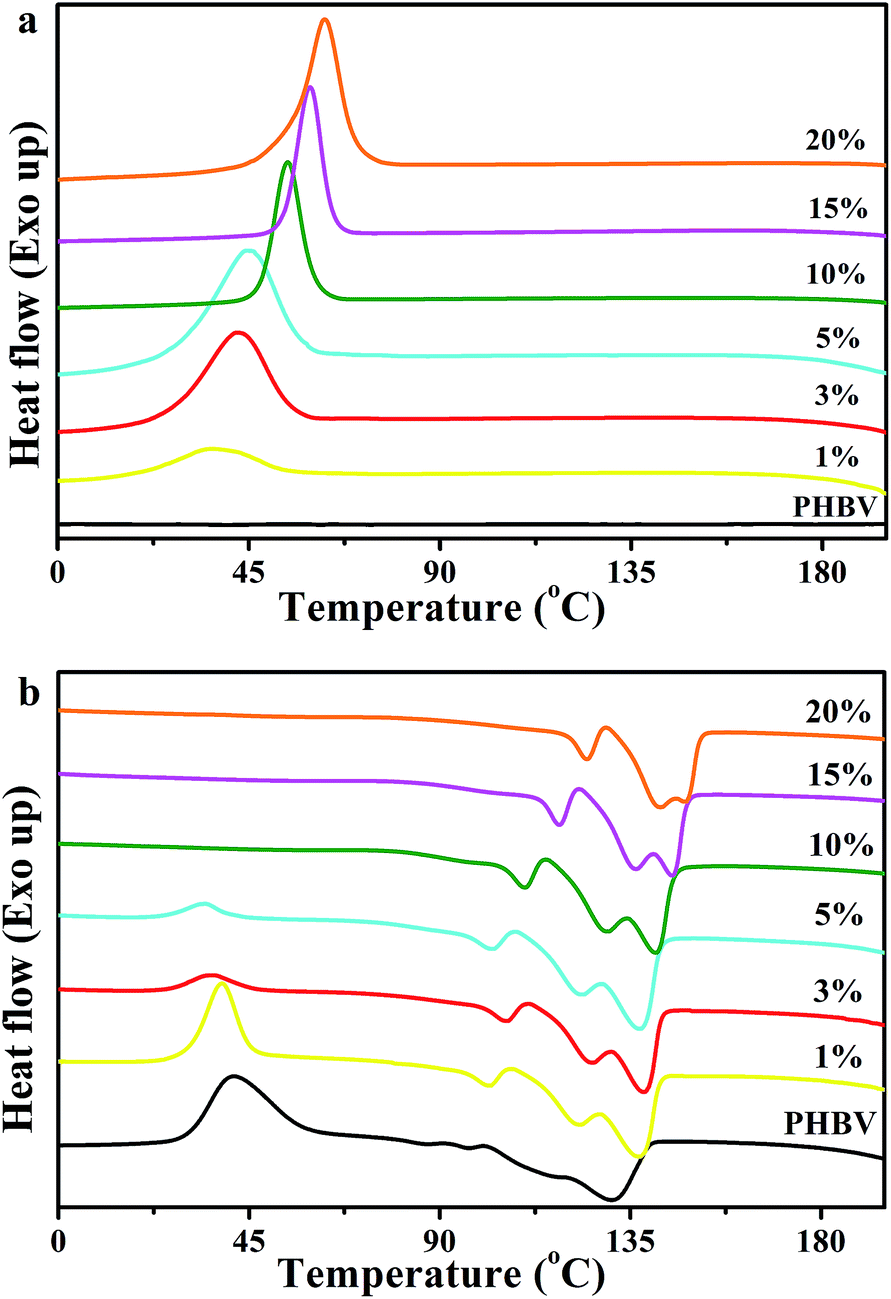
Fig. 6 shows the DSC curves of neat PHBV and the nanocomposites, and Table 1 summarizes the corresponding thermal parameters, such as melt crystallization temperature (Tmc), melt crystallization enthalpies (ΔHmc), cold crystallization temperature (Tcc), cold crystallization enthalpies (ΔHcc), melting temperature (Tm1, Tm2, Tm3), melting enthalpies (ΔHm), the onset temperature of crystallization (Tc(onset)) and the crystallization temperature (Tc). As shown in Fig. 6(a), no obvious melt crystallization peaks of neat PHBV were observed during the first cooling trace, a cold crystallization peak was found in the second heating trace. On one hand, with an increase of the CNC-me concentrations from 1 to 20 wt%, the melt crystallization temperature (Tmc) was increased from 36.2 °C to 62.8 °C for 20 wt% CNC-me. At the same time, the width of melt crystallization peaks became narrow. These results illustrate that the crystallization of PHBV was becoming easier due to the lower activation energy barrier by introducing CNC-me.11,12,18 On the other hand, Tc(onset) − Tc value was also decreased from 24.3 °C for neat PHBV to a minimum value of 14.8 °C for 15 wt% CNC-me, and then increases to 17.6 °C for 20 wt% CNC-me. The parameter Tc(onset) − Tc is used to be a measure of the overall rate of crystallization, and the smaller the Tc(onset) − Tc is, the greater the crystallization rate is.11,12,24 Therefore, the incorporation of CNC-me would increase the crystallization rate, resulting in an increase in the crystallinity of the nanocomposites. This result was consistent with the WAXD results (Table 1).
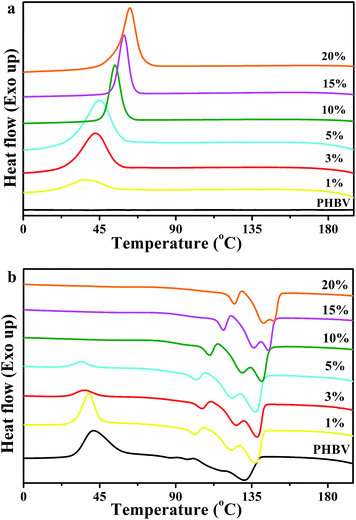 |
| | Fig. 6 DSC curves of neat PHBV and the nanocomposites with various CNC-me concentrations. (a) the first cooling trace; (b) the second heating trace. | |
The cold crystallization peaks of neat PHBV and the nanocomposites are shown in Fig. 6(b). With the increase of CNC-me concentrations, the cold crystallization peak became weak together with a decrease in Tcc, and finally disappeared once the CNC-me concentration reached to 5 wt%. On the contrary, the cold crystallization peak was still found for the nanocomposite with 5 wt% sulfuric acid hydrolyzed CNCs, and the Tcc was decreased by only 10 °C as compared to PHBV.10 This result suggests that the easier crystallization of PHBV was obtained in our nanocomposite system. Moreover, neat PHBV and the nanocomposites exhibited triple melting peaks (Tm1, Tm2 and Tm3), which were caused by the melt of the imperfect PHBV crystals, melting–recrystallization–melting process of PHBV crystals, respectively.5,10–12,25 This means that the second endothermic peak (Tm2) could be used as the melting temperature of the nanocomposites. With the increase of CNC-me concentrations, the melting temperature increased from 111.7 °C (PHBV) to 142.1 °C (20 wt% CNC-me), indicating the formation of PHBV crystals with higher perfection and thicker lamellar layers in the nanocomposites. In addition, with an increase of the CNC-me concentrations, the crystallinity (XDSC) obtained from DSC curves for the nanocomposites was gradually increased. This result was in agreement with FT-IR and WAXD results.
Mechanical properties
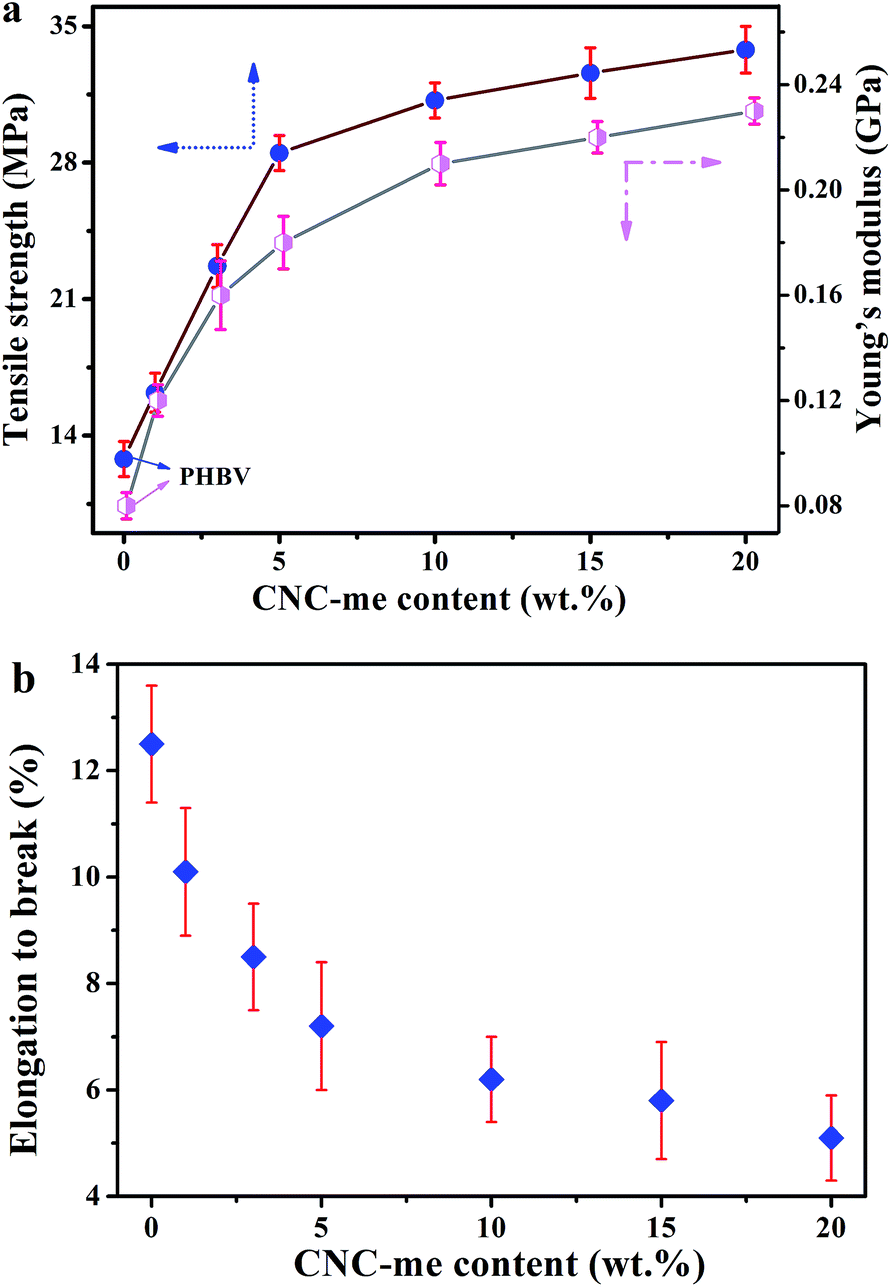
The good interfacial affinity between nanofillers and polymer phases was a prerequisite for achieving excellent mechanical properties of the nanocomposites. In general, food packaging materials should have enough strength to be self-supporting and resist handling damage.1 Thus PHBV and the nanocomposite films were examined by tensile testing. Fig. 7 gives the tensile strength, Young's modulus and elongation to break for neat PHBV and the nanocomposites. It is clear that a strong reinforcement effect in the mechanical properties of the nanocomposite films was achieved by adding CNC-me. When an increase of CNC-me concentrations, both the tensile strength and Young's modulus of the nanocomposites were increased gradually, which was ascribed to an efficient dispersion of the CNC-me and efficient stress transfer at the interface, resulting from a strong adhesion between the reinforcing phase and the matrix. The addition of 20 wt% CNC-me promoted 164% and 188% increments in the tensile strength and Young's modulus, respectively. These improvements could be attributed to the restrained chain movement and refined crystalline structure during the deformation. Moreover, we compare mechanical properties of PHBV/CNC nanocomposites obtained by different research groups.8–11,13 As show in Table 3, at the same concentrations, the nanocomposites in our work exhibited higher Young's modulus and tensile strength than those of the nanocomposites reinforced with freeze-dried CNCs prepared by H2SO4 hydrolysis8,10 and bacterial cellulose nanocrystals.9 However, our nanocomposites exhibited the lower Young's modulus and tensile strength than those of the nanocomposites reinforced with solvent exchanged CNCs prepared by HCl hydrolysis.11 Because CNCs with similar size were applied in these works, the mechanical reinforcement was dependent on the dispersion state of the nanofillers within PHBV matrix and hydrogen bonding interactions between two components. Due to ester groups on CNC-me, its dispersion within the matrix was improved, so its reinforcing effect was stronger than the H2SO4 hydrolyzed-CNC (via direct solution casting and residual sulfate groups).8,10 It should be noted that the esterification reaction between CNC surface and HCOOH would reduce the amount of hydroxyl groups of CNC-me and thus the formed hydrogen bonding interaction was weaker than that of the PHBV nanocomposites with HCl hydrolyzed-CNCs (only abundant hydroxyl groups). As a result, the nanocomposites in this study showed relatively poorer mechanical properties than that of the nanocomposites.11
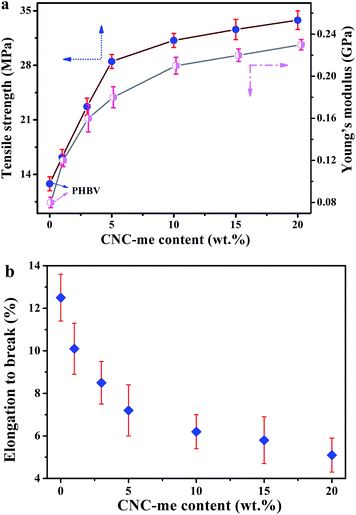 |
| | Fig. 7 Tensile strength and Young's modulus (a), and elongation to break (b) as a function of CNC-me concentrations for neat PHBV and the nanocomposites. | |
Thermal stability
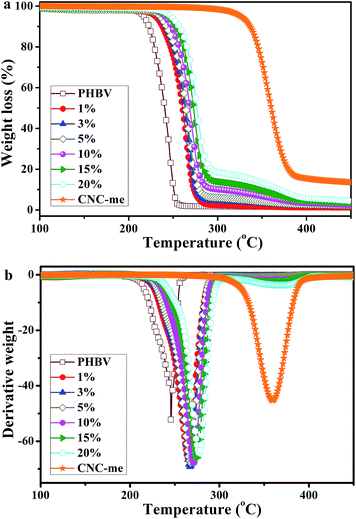
Fig. 8 shows the TGA curves of neat PHBV, CNC-me and the nanocomposites, and Table 3 summarizes their main thermal parameters. In Fig. 8, the TGA curve of the PHBV matrix exhibited a typical single weight-loss step, with a maximum decomposition rate at 245.8 °C. The thermal decomposition process of the nanocomposites also presented a single weight-loss step profile, but their thermal stability depended on the CNCs used and the reinforcement concentrations. A similar behavior was previously reported for acetylated bacterial cellulose nanocomposites with poly(lactic acid).26 The thermal decomposition temperature of the nanocomposites was shifted to higher temperature, which indicated that their thermal stabilities were better than that of neat PHBV. This result was due to hydrogen bonding interactions between PHBV chains and CNC-me, which could restrict the formation of six-membered ring ester during the degradation process of PHBV, and thus thermal stability, was enhanced. Moreover, at the same CNC loadings, the thermal stability in this study was higher than H2SO4 hydrolyzed CNCs reinforced PHBV nanocomposites (Table 2),8–10,13 but the poorer than that of the nanocomposites reinforced with HCl hydrolyzed CNCs11 due to the decrease in the number of hydrogen bonding interactions.
 |
| | Fig. 8 TGA curves for neat PHBV, CNC-me and the nanocomposites with various CNC-me concentrations. | |
Table 2 The comparisons of mechanical and thermal properties of PHBV/CNC nanocomposites obtained by different research groups
| CNC loading (wt%) |
Compatibilizer or surfactant |
Improvement magnitudesa |
Ref. |
| Tensile strength (%) |
Young's modulus (%) |
Tmax (°C) |
| Improvement magnitude were determined by results of neat PHBV and the nanocomposites. |
| 5 |
PEG |
35.5 |
77 |
−5 |
8 and 10 |
| 1 |
— |
5 |
−5.6 |
3.1 |
9 |
| 5 |
Lauric acid–p-toluenesulfonyl chloride mixture |
— |
— |
−11 |
13 |
| 10 |
— |
166 |
282 |
47.5 |
11 |
| 10 |
— |
147 |
250 |
24.5 |
This work |
As shown in Table 3, with an increase of the CNC-me concentrations, the maximum decomposition temperature (Tmax) gradually increased from 245.8 °C to 277.5 °C for the nanocomposite with 20 wt% CNC-me. The similar trends for initial decomposition temperature (T0), temperature at 5% weight loss (T5%) and complete decomposition temperature (Tf) were also observed. Compared with those for neat PHBV, the T0, T5%, Tmax and Tf for the nanocomposites with the best thermal stability were increase by 35.4 °C, 30.7 °C, 31.7 °C and 36.2 °C, respectively. Such enhancement was attributed to the strongest hydrogen bonding interactions and improved crystalline structure, which was consistent with FT-IR, WAXD and DSC results. In addition, the T0 − Tm3 values of higher than that for neat PHBV, indicating the nanocomposites had the wider melt-processing window. Moreover, with an increase of CNC-me concentration from 1 to 20 wt%, the T0 − Tm3 values increased from 110.5 to 115.1 °C, suggesting that the nanocomposites with 20 wt% CNC-me exhibited the widest melt-processing window.
Table 3 Thermal analysis parameters and water vapour permeability (WVP) for neat PHBV, CNC-me and the nanocomposites with various CNC-me concentrations
| Sample |
T0a (°C) |
T5%a (°C) |
Tmaxa (°C) |
Tfa (°C) |
T0 − Tm3b (°C) |
WVP × 1014 (kg m m−2 s−1 Pa−1) |
| T0, T5%, Tmax and Tf were obtained from the TGA curves at the heating rate of 10 °C min−1. T0 − Tm3 stood for the melt-processing window. |
| PHBV |
229.4 |
216.8 |
245.8 |
252.3 |
99.4 |
7.8 |
| 1% |
247.4 |
231.4 |
265.4 |
273.9 |
110.5 |
6.2 |
| 3% |
250.4 |
234.7 |
267.2 |
275.2 |
111.2 |
4.4 |
| 5% |
250.8 |
235.4 |
268.1 |
276.8 |
113.4 |
3.1 |
| 10% |
254.9 |
239.7 |
270.3 |
280.2 |
113.9 |
2.6 |
| 15% |
259.4 |
245.4 |
274.7 |
284.4 |
114.6 |
2.2 |
| 20% |
264.8 |
247.5 |
277.5 |
288.5 |
115.1 |
2.6 |
| CNC-me |
338.2 |
316.5 |
359.4 |
376.0 |
— |
— |
Water uptake, water vapour permeability and overall migration
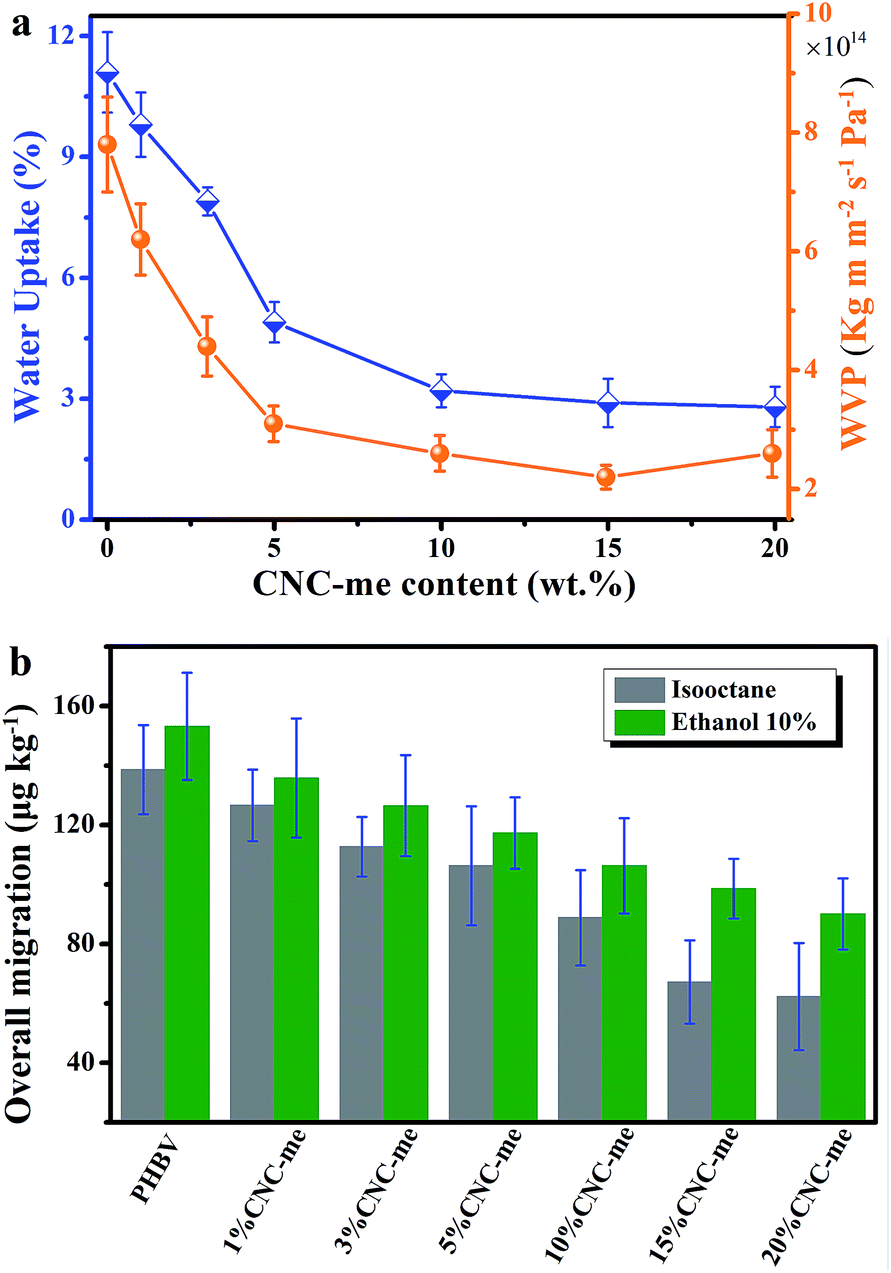
When the nanofillers were added to biopolymers for food packages, the barrier properties to gases, vapours and organic compounds should be evaluated. Excess moisture, organic compounds and oxygen is easy to cause food spoilage, resulting in a continuous damage in product quality and shelf-life.1–4 Additionally, migration has also been regarded as a negative problem because many substances represent a danger to human health and/or modify the food composition. An ideal packaging material requires positive effect on food preservation, water resistance and lower overall migration in food simulants. Therefore, the water uptake and water vapour permeability (WVP) of the nanocomposite films were tested. Fig. 9(a) illustrates that a noticeable reduction in water uptake and WVP were observed as the CNC-me concentrations increased. Compared to neat PHBV, the water uptake and WVP values were decreased by 74% and 56%, respectively (Table 3). It indicates that the improved barrier properties against water and water vapor were obtained for the nanocomposites. These improvements were larger than those reported for ZnO,1 MWCNT2,4 or carbon nanofiber-reinforced PHBV.4 It has reported that the presence of cellulose nanocrystals can increase the tortuosity in the nanocomposite films, resulting in slower diffusion processes and thus a lower permeability.9,27 Besides, good dispersion of CNCs within the matrix was beneficial to improve the barrier properties. In the present study, the more significant improvement in the barrier property of the nanocomposites was achieved, which was ascribed to higher tortuosity of the transport path. As we know, the increases in CNC-me loading, the more perfect crystalline structure and crystallinity of the nanocomposites could result in higher tortuosity of the transport path and prevent water and water vapor molecules permeating the nanocomposite films.1,2,4,5,26–28
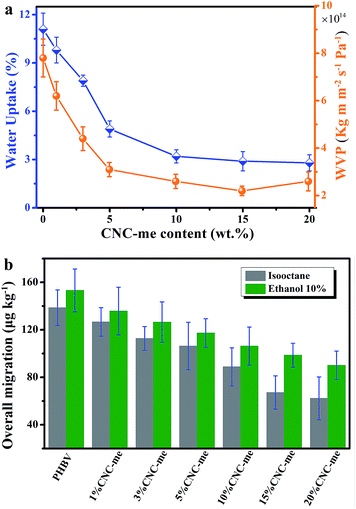 |
| | Fig. 9 Water uptake and water vapour permeability (WVP) (a), and overall migration data in ethanol 10% (v/v) and isooctane (b) as a function of CNC-me concentrations for neat PHBV and the nanocomposites. | |
Overall migration tests with simulants were conducted to determine the total amount of non-volatile substances that might migrate into foodstuff from neat PHBV and the nanocomposite films. As shown in Fig. 9(b), it is observed that the nanocomposites possess the lower maximum migration levels in both simulants than the migration limits for food contact materials (60 mg per kg of simulant) according to the Commission Regulation EU no. 10/2011 (the legislation of European commission).1,2,16,17 Moreover, CNC-me with increasing concentration significantly decreased the migration level of stimulants, which was attributed to good interfacial adhesion or interaction between CNC-me and polymer matrix, as previously discussed.
Conclusions
Transparent nanocomposites with improved properties were successfully prepared by incorporation of functionalized cellulose nanocrystals (CNC-me) into PHBV matrix via simple solution casting, in which CNC-me was fabricated through HCOOH–HCl hydrolysis of MCC and esterification of hydroxyl groups in one-pot process. The rod-like CNC-me with hydrophobic ester groups showed good interfacial compatibility with the PHBV matrix. As a result, the incorporation of CNC-me has a positive effect on the thermal stability, mechanical, barrier and migration properties due to good dispersion of CNC-me, improved interfacial adhesion and increased crystallinity. The high performance nanocomposites have great potential applications as food packaging materials and green plastics as replacements for traditional petrochemical materials.
Acknowledgements
The financial supports from the National Natural Science Foundation of China (51403187), the Natural Science Foundation of Zhejiang Province of China (LQ14E030007), the Scientific Research Foundation of Zhejiang Sci-Tech University (ZSTU) under Grant. no. 13012115-Y, and Top Priority Discipline of Zhejiang Province in Zhejiang Sci-Tech University (2013YBZX01) are greatly acknowledged.
References
- A. M. Díez-Pascual and A. L. Diez-Vicente, ACS Appl. Mater. Interfaces, 2014, 6, 9822–9834 Search PubMed.
- H. Y. Yu, Z. Y. Qin, B. Sun, X. G. Yang and J. M. Yao, Compos. Sci. Technol., 2014, 94, 96–104 CrossRef CAS PubMed.
- A. Martínez-Abad, J. M. Lagaron and M. J. Ocio, J. Agric. Food Chem., 2012, 60, 5350–5359 CrossRef PubMed.
- M. D. Sanchez-Garcia, J. M. Lagaron and S. V. Hoa, Compos. Sci. Technol., 2010, 70, 1095–1105 CrossRef CAS PubMed.
- H. Y. Yu, Z. Y. Qin, C. F. Yan and J. M. Yao, ACS Sustainable Chem. Eng., 2014, 2, 875–886 CrossRef CAS.
- L. N. Carli, J. S. Crespo and R. S. Mauler, Composites, Part A, 2011, 42, 1601–1608 CrossRef PubMed.
- G. F. Shan, X. Gong, W. P. Chen, L. Chen and M. F. Zhu, Colloid Polym. Sci., 2011, 289, 1005–1014 CAS.
- L. Jiang, E. Morelius, J. Zhang, M. Wolcott and J. Holbery, J. Compos. Mater., 2008, 42, 2629–2645 CrossRef CAS PubMed.
- M. Martínez-Sanz, M. Villano, C. Oliveira, M. G. Albuquerque, M. Majone, M. Reis, A. Lopez-Rubio and J. M. Lagaron, New Biotechnol., 2013, 31, 364–376 CrossRef PubMed.
- E. Ten, J. Turtle, D. Bahr, L. Jiang and M. Wolcott, Polymer, 2010, 5, 2652–2660 CrossRef PubMed.
- H. Y. Yu, Z. Y. Qin, L. Liu, X. G. Yang, Y. Zhou and J. M. Yao, Compos. Sci. Technol., 2013, 87, 22–28 CrossRef CAS PubMed.
- H. Y. Yu, Z. Y. Qin, Y. N. Liu, L. Chen, N. Liu and Z. Zhou, Carbohydr. Polym., 2012, 89, 971–978 CrossRef CAS PubMed.
- R. Zhang, C. Zhu, X. Shan, J. Xia, Q. Zhu and Y. Hu, J. Appl. Polym. Sci., 2013, 130, 2015–2022 CrossRef CAS.
- N. Butchosa, C. Brown, P. T. Larsson, L. A. Berglund, V. Bulone and Q. Zhou, Green Chem., 2013, 15, 3404–3413 RSC.
- Y. Habibi, A. L. Goffin, N. Schiltz, E. Duquesne, P. Dubois and A. Dufresne, J. Mater. Chem., 2008, 18, 5002–5010 RSC.
- E. Fortunati, M. Peltzer, I. Armentano, A. Jiménez and J. M. Kenny, J. Food Eng., 2013, 118, 117–124 CrossRef CAS PubMed.
- E. Fortunati, M. Peltzer, I. Armentano, L. Torre, A. Jiménez and J. M. Kenny, Carbohydr. Polym., 2012, 90, 948–956 CrossRef CAS PubMed.
- N. Lin, J. Huang, P. R. Chang, J. Feng and J. Yu, Carbohydr. Polym., 2011, 83, 1834–1842 CrossRef CAS PubMed.
- W. Shang, J. Huang, H. Luo, P. R. Chang, J. Feng and G. Xie, Cellulose, 2013, 20, 179–190 CrossRef CAS.
- M. L. Cheng, Y. M. Sun, H. Chen and Y. C. Jean, Polymer, 2009, 50, 1957–1964 CrossRef CAS PubMed.
- J. Zhang, H. Sato, I. Noda and Y. Ozaki, Macromolecules, 2005, 538, 4274–4281 CrossRef.
- N. Hameed, Q. Guo, F. H. Tay and S. G. Kazarian, Carbohydr. Polym., 2011, 86, 94–104 CrossRef CAS PubMed.
- H. Sehaqui, T. Zimmermann and P. Tingaut, Cellulose, 2014, 21, 367–382 CrossRef CAS PubMed.
- J. Li, M. F. Lai and J. J. Liu, J. Appl. Polym. Sci., 2004, 92, 2514–2521 CrossRef CAS.
- J. Wang, Z. Wang, J. Li, B. Wang, J. Liu, P. Chen, M. Miao and Q. Gu, Carbohydr. Polym., 2012, 87, 784–789 CrossRef CAS PubMed.
- L. C. Tomé, R. J. Pinto, E. Trovatti, C. S. Freire, A. J. Silvestre, C. P. Neto and A. Gandini, Green Chem., 2011, 13, 419–427 RSC.
- H. Azeredo, L. H. C. Mattoso, D. Wood, T. G. Williams, R. J. Avena-Bustillos and T. H. McHugh, J. Food Sci., 2009, 74, 31–35 CrossRef PubMed.
- I. Zembouai, M. Kaci, S. Bruzaud, A. Benhamida, Y. M. Corre and Y. Grohens, Polym. Test., 2013, 32, 842–851 CrossRef CAS PubMed.
|
| This journal is © The Royal Society of Chemistry 2014 |
Click here to see how this site uses Cookies. View our privacy policy here. 

 , where XDSC is the crystallinity, ϕCNC-me is the weight fraction of CNC-me. The ΔHm is the measured melting enthalpies and ΔH100 is chosen as 146.6 J g−1 for heat of fusion of 100% crystalline PHBV due to the low HV concentration of PHBV in our study.5,7