
Controlled synthesis of hexagonal mesostructure silica and macroporous ordered siliceous foams for VOCs adsorption†
Hongning Wanga,
Xiao Ronga,
Lu Hand,
Mei Tanga,
Meihua Yuc,
Jun Zhangc,
Weiqiu Huangb and
Ruoyu Chen*a
aJiangsu Key Laboratory of Advanced Catalytic Materials and Technology, Changzhou University, 1 Gehu Road, Changzhou, Jiangsu 213164, P. R. China. E-mail: cxdcry@163.com
bJiangsu Provincial Key Laboratory of Oil and Gas Storage and Transportation Technology, Changzhou University, Xingyuan Road, Changzhou, Jiangsu 213016, P. R. China
cAustralian Institute for Bioengineering and Nanotechnology, The University of Queensland, Brisbane, QLD 4072, Australia
dResearch and Development Center, China Tobacco Anhui Industrial Co., Ltd., 9 Tianda Road, Hefei, Anhui 230028, P. R. China
First published on 15th December 2014
Abstract
In this study, ordered hexagonal mesostructure siliceous materials and macroporous ordered siliceous foams were synthesized in pH = 5 buffer solution by simply adjusting the reaction temperature with P123 (EO20PO70EO20) as a structure-directing agent and tetramethoxysilane (TMOS) as the silica source. Increasing the reaction temperature from 15 to 35 °C led to a structural evolution from ordered hexagonal mesostructure siliceous material with a pore size of 10 nm to macroporous ordered siliceous foam with a pore size of ∼100 nm. The adsorption and desorption performance of hexagonal mesostructure and macroporous ordered siliceous samples (HMS and MOSF) were investigated under static (water vapor, n-hexane and 93# gasoline) and dynamic (n-hexane) conditions. Compared with commercial silica gel (SG), activated carbon (AC) and HMS, MOSF show higher static adsorption capacity of n-hexane and 93# gasoline, higher dynamic n-hexane adsorption capacity, and more stable breakthrough time under dynamic adsorption conditions. The designed MOSF with highest volatile organic compounds (VOCs) removal capacity and recyclability show great potential for VOCs controlling.
1 Introduction
Since the discovery of mesoporous materials,1,2 diverse siliceous porous structures have been developed due to the availability of various surfactants used as structure-directing agents, such as ordered mesostructures, hierarchical mesoporous and macroporous materials, and vesicle-like hollow particles, etc.3 The pore structure, such as channel connectivity and pore symmetry, of porous materials is one of the most important physical parameters for their applications.4–6 Therefore, the controlled synthesis of porous materials with tunable structures and pore sizes has attracted increasingly attention.7By using liquid crystal templating (LCT)1,8 or cooperative self-assembly,2,9,10 ordered mesostructured organic–inorganic composites have been synthesized and this field has attracted thousands of documents. Vesicles11–14 and liquid crystals15,16 are formed in different regions in the phase diagram of surfactants or block copolymers. The phase transition from liquid crystals to uni- or multi-lamellar vesicular structures is theoretically predictable in the process of surfactant self-assembly by using the concept of surfactant packing parameter (g),12 and has also been experimentally achieved through decreasing the hydrophilic/hydrophobic block ratio,17 or decreasing reaction temperature.18 Moreover, the structure transformation of organic–inorganic hybrid materials is also achieved by tuning the reaction temperature,19,20 or adding organic additives,19,21–25 or using mixed surfactants,26–29 or mixed silica sources.30–32 Nevertheless, such structure transition has rarely been achieved in surfactant-templated organic–inorganic composites by adjusting a single parameter. A cooperative vesicle templating (CVT) approach was proposed to synthesize siliceous unilamellar vesicles and foams using nonionic block copolymers,33–35 where the synthesis condition (pH of ∼5) was different from that of SBA-15 type ordered mesoporous materials (at strong acidic condition).10 Compared to the enthusiasm for the study of ordered mesostructured materials, much less attention has been paid in the synthesis and applications of vesicular materials directed by organic templates.
Herein, we report a structure evolution from ordered hexagonal mesostructure siliceous materials (HMS) with pore diameter ≈ 10 nm to macroporous ordered siliceous foams (MOSF) with pore diameter ≈ 118 nm in pH = 5 buffer solution by finely tuning reaction temperature, with a ∼10 times pore expansion. In this approach, the structure directing agent used is EO20PO70EO20 (denoted P123, BASF), where EO is poly(ethylene oxide) and PO is poly(propylene oxide) and tetramethyl orthosilicate (TMOS) used as silica source. The obtained HMS and MOSF can be used for VOCs adsorption. The adsorption and desorption performance of HMS and MOSF was studied under static (water vapor, n-hexane and 93# gasoline) and dynamic (n-hexane) conditions, with commercial silica gel (SG) and activated carbon (AC) as references.
2 Experimental methods
2.1 Materials
Triblock copolymers Pluronic P123 was purchased from Sigma-Aldrich. TMOS was purchased from BASF Corp. 93# gasoline was purchased from Sinopec. AC was bought from Xinsen Carbon Industry Co., Ltd., Shaowu, Fujian, China. SG is a gift from Qingdao Xinli trade limited company. Other chemicals were purchased from Shanghai Chemical Corp. All chemicals were used as received without any further purification. Millipore water was used in all experiments.2.2 Synthesis
The synthesis includes two steps. The first step involves reactant mixing and ripening, while the second step is ageing. In a typical synthesis, 1.0 g of P123 and 1.7 g of Na2SO4 (0.40 M) were dissolved in 30 g of pH = 5.0 NaAc–HAc buffer solution [Ct = 0.02 M, where Ct = C(NaAc) + C(HAc)] to form a homogenous solution under stirring at 15 °C. 1.52 g of TMOS was added to this mixture solution under stirring. After 5 minutes, the stirring was stopped. The resultant mixture was kept at static condition for 24 h. During the above reactant mixing and ripening step, the temperature was fixed at 15 °C by using a constant temperature thermostatic water bath (±0.1 °C). Then, all the reactants were transferred into an autoclave and heated at 100 °C for 24 h. The white precipitates were filtered, repeatedly washed with water to remove the inorganic salts, and then dried at room temperature. The final products were obtained by calcination at 550 °C for 5 h. The other reaction conditions are exactly the same in all synthesis except that the temperature in the reactant mixing and ripening step was changed systematically in the range of 5–35 °C.2.3 Characterization
Powder X-ray diffraction (XRD) patterns were recorded with a Bruker D4 powder X-ray diffractometer using Cu Kα radiation (40 kV, 40 mA). Scanning electron microscopy (SEM) images were recorded on a Philips XL30 electron microscope (Netherlands) operating at 20 kV. A thin gold film was sputtered on the sample before characterization. Transmission electron microscopy (TEM) images were taken with a JEOL 2011 microscope (Japan) operating at 200 kV. For the TEM measurements, the samples were dispersed in ethanol and then dried on a holey carbon film Cu grid. Nitrogen sorption isotherms were measured at 77 K with a Micromeritics Tristar 3000 analyzer (USA). Before measurements, the samples were degassed in a vacuum at 180 °C for at least 5 h. The Brunauer–Emmett–Teller (BET) method was utilized to calculate the specific surface areas (SBET) based on the linear part of the BET plot (P/P0 = 0.05–0.25). By using the Barrett–Joyner–Halenda (BJH) model, the pore volumes and pore size distributions were derived from the adsorption branches of isotherms, and the total pore volumes (Vt) were estimated from the adsorbed amount at a relative pressure P/P0 of 0.992. The micropore volumes (Vm) and micropore surface areas (Sm) were calculated from the t-plot method.2.4 Static adsorption and desorption measurements
Static adsorption equilibrium measurements at room temperature were carried out using a digital microbalance (Model YP/1002) with a sensitivity of 0.1 mg.36 The adsorption–desorption properties of the VOCs or water were determined in a desiccator with a series of VOCs or distilled water under the plate. The desiccator was placed in a constant-temperature water container and equipped with an analytical balance. First, the powder sample was loaded on a weighting bottle (50 mm × 30 mm) without lid. Under a high-vacuum of 0.9 mbar, the sample was heated to 100 °C for at least 2 h to remove all adsorbed impurities. After that, the weighting bottle (with lid) was cooled to the room temperature in drying apparatus. Then the weighing bottle (without lid) with adsorbent inside keep in contact with the VOCs or water for sufficient time at 25 °C. After the adsorption became saturated, desorption procedure was carrying out by heating the sample to 100 °C in a vacuum environment for 75 min (until the mass of the sample do not change any more). All the static adsorption experiments were performed in triplicate (each including 5 adsorption–desorption cycles) to ensure the reproducibility of the data. According to the mass change of the sample before and after the adsorption and desorption procedure, the adsorption capacity and desorption percentage of the sample could be calculated as follows:
 | (1) |
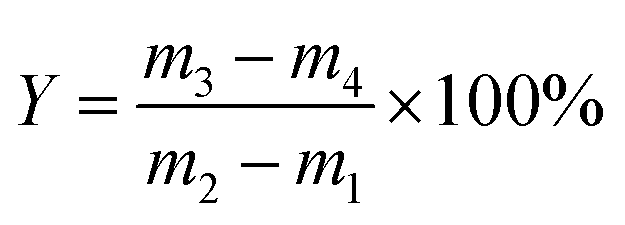 | (2) |
2.5 Titration of surface hydroxyl
The density of surface hydroxyl was determined according to Boehm titration.37–40 Typically, 0.50 g of sample was dispersed in 100 mL mixture of ethanol and NaCl and then sealed and shaken thoroughly for 24 h. The pH value of the resulting suspension was first adjusted to 4.0 by 0.01 M HCl or 0.018 M NaOH and then the pH was further titrated from 4.0 to 9.0 with 0.018 M NaOH. The density of surface hydroxyl was calculated as follow:| D = CVNA × 10−3 | (3) |
2.6 Dynamic adsorption and desorption measurements
The dynamic adsorption was carried out by a flow method reported by Hu et al.41 Adsorbent was loaded in a fixed-bed reactor (internal diameter of 0.80 cm, length of 8.00 cm). Before adsorption measurements, samples were degassed at 100 °C overnight under vacuum condition to remove the physically adsorbed water molecules and small organic impurities. Air was taken as a carrier gas and adjusted to keep a total flow rate of 0.03 L min−1, and the concentration of n-hexane was controlled at 0.25 g L−1. The adsorbed amount of adsorbate was determined by the concentration change before and after adsorption measurements tested by using a GC equipped with a flame ionization detector. The equilibrium dynamic adsorption capacity (q) of the adsorbents was calculated from the breakthrough curves according to the equation as follows:
 | (4) |
3 Results and discussion
3.1 Characterization of the materials
Fig. 1 shows scanning electron microscopy (SEM) images of the calcined materials synthesized at 15, 25, 26, 27, 30, 35 °C, respectively. Sample (a) (synthesized at 15 °C) has a rod-like morphology with a length of ∼1 μm and a diameter ranging from 150 to 300 nm (Fig. 1a), similar to that of SBA-15 materials synthesized at acidic conditions in the presence of inorganic salts.42 Sample (b) (25 °C) shows a mixed rod-like and spherical morphologies (Fig. 1b). The rod-like morphology disappears in samples (c) and (d) synthesized at 26 and 27 °C, respectively (Fig. 1c and d). When the reaction temperature is further increased to 30 °C, the macroporous foam-like structure can be observed for sample (e) (Fig. 1e). Macroporous ordered foam structure can be obtained within the temperature of 30–35 °C, and the structure synthesized at 35 °C (f) is most ordered (Fig. 1f). | ||
| Fig. 1 SEM images of siliceous materials (a)–(f) synthesized at 15, 25, 26, 27, 30 and 35 °C, respectively. | ||
The X-ray diffraction (XRD) patterns and transmission electron microscopy (TEM) images of samples (a)–(f) are shown in Fig. 2 and 3, respectively. The XRD pattern of sample (a) (15 °C) shows three well-resolved reflections at 2θ = 0.94, 1.62, and 1.86°, which can be attributed to the (100), (110), and (200) diffractions of the two-dimensional p6mm symmetry with a lattice parameter of a = 10.9 nm (Fig. 2a). The TEM image of sample (a) confirms the highly ordered hexagonal mesostructure (Fig. 3a). As the temperature increased to 25 °C, three diffraction peaks at 2θ = 0.81, 1.42, and 1.65° can be observed in the XRD pattern of sample (b) (25 °C) (Fig. 2b), which can be indexed to a two-dimensional hexagonal structure in general. However, TEM image of sample (b) reveals that the hexagonal mesostructure co-exists with spherical vesicular structure (Fig. 3b). When the temperature was further increased to 26 °C, one weak broad diffraction peak is observed, indicating a disordered mesostructure (Fig. 2c). The vesicular structures are the major phase in the TEM image of sample (c) (Fig. 3c). A further slight increase of temperature to 27 °C leads to the formation of dominant vesicular structures in the TEM image of sample (d) (Fig. 3d). No diffraction peak is observed for sample (d) (Fig. 2c), in accordance with the structure revealed by TEM observation. The disordered (sample (e)) and ordered (sample (f)) foam-like structures shown in SEM images (Fig. 1e and f) are also confirmed in their TEM images (Fig. 3e and f).
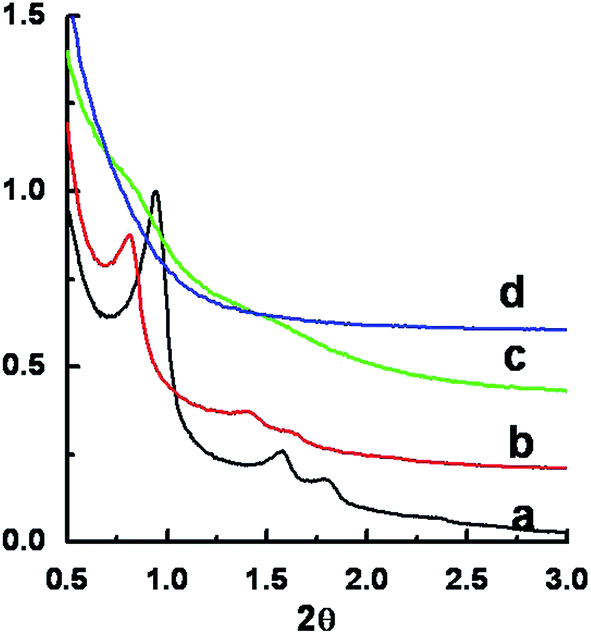 | ||
| Fig. 2 XRD patterns (a)–(d) of siliceous materials synthesized at 15, 25, 26 and 27 °C, respectively. | ||
 | ||
| Fig. 3 TEM images (a)–(f) of siliceous materials synthesized at 15, 25, 26, 27, 30 and 35 °C, respectively. Scale bar is 100 nm. | ||
The N2 sorption isotherms and pore size distribution curves of samples (a)–(f) are shown in Fig. 4. For sample (a), only one capillary condensation step occurs at P/P0 = 0.7–0.8 (Fig. 4A-a), and the pore size is calculated to be 10 nm (Fig. 4B-a) (for other physicochemical properties, see Table 1). The isotherm of sample (b) shows two steps of capillary condensation in the adsorption branch, occurred at P/P0 = 0.7–0.8 and P/P0 > 0.9, respectively (Fig. 4A-b). The existence of bimodal pores should come from the mesoporous and vesicular structures in sample (b). When the reaction temperature is further increased in the range of 26–35 °C (sample (c)–(f)) (Fig. 4A-b–f), the volume adsorbed in smaller pores (∼10 nm) is even less, while the capillary condensation in macropores (>50 nm) is dominant (Fig. 4B-b–f). Sample (f) has a uniformly distributed macropores of about 118 nm (Fig. 4B-f), in agreement with its ordered macrostructure.19
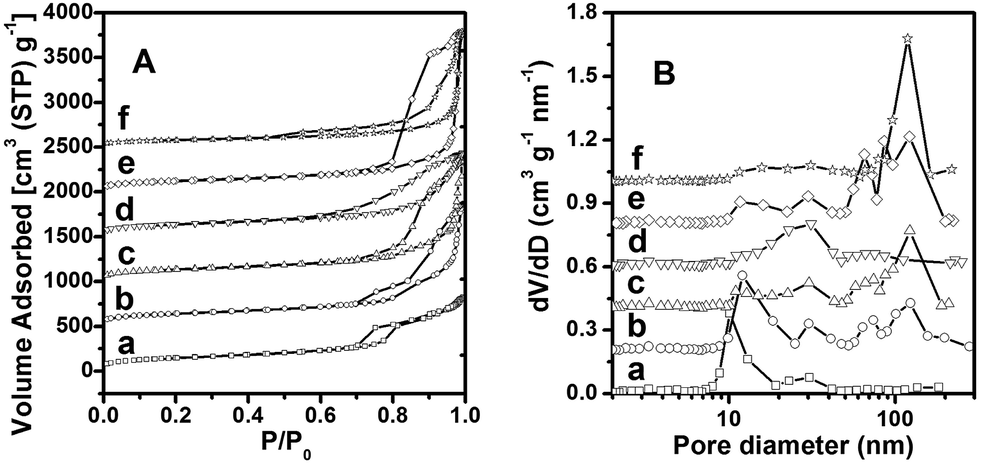 | ||
| Fig. 4 Nitrogen sorption isotherms (A) and pore size distribution curves (B) of siliceous materials (a)–(f) synthesized at 15, 25, 26, 27, 30 and 35 °C, respectively. The Y-axes value is raised 500, 1000, 1500, 2000 and 2500 cm3 g−1 (A) and 0.2, 0.4, 0.6, 0.8 and 1.0 cm3 g−1 nm−1 (B) for (b), (c), (d), (e) and (f), respectively. | ||
The hexagonal structure can also be obtained at 5 and 20 °C (Fig. S1–3†). However, careful TEM investigation indicates that the formation of vesicular structures commences at 20 °C (Fig. S3†). On the basis of these observations, the structural evolution as a function of reaction temperature is shown in Scheme S1:† the hexagonal structure transformed to vesicular structures over a temperature range of 20–26 °C, while the pore size expands ∼10 times from 15 to 35 °C. Our results demonstrate that, porous materials with different pore morphology can be achieved by simply changing the reaction temperature.
The above results show that a simple approach for the synthesis of mesoporous or macroporous siliceous materials with different structures (hexagonal and vesicular) and morphologies was achieved by simply changing the reaction temperature. Because the other reaction conditions are exactly the same, the difference should be mainly attributed to the influence of temperature on the cooperatively self-organized block copolymer/silicate composite structures. In the self-assembly of surfactants, the structure of supra-molecular aggregates is predicted mainly by the g factor of organic surfactant molecules.12,43–45 While in the case of mesostructured1,2,8–10 and vesicular organic–inorganic composites,34,35 the self organized structures are determined by not only the surfactant templates, but also the inorganic species that have interaction with the surfactants head groups. Therefore, it is the hydrophilicity/hydrophobicity ratio of both templates and inorganic precursors that decide the final structure of organic–inorganic composites.
In this synthesis system, nonionic surfactant P123 has both the hydrophilic poly(ethylene oxide) (PEO) chains and hydrophobic poly(propylene oxide) (PPO) chains, which drives the formation of micelles with PPO as the core and PEO chains as the corona.22,46–48 Aggregation of P123 in water is sensitive to the additives. The addition of “salting out” electrolyte Na2SO4, would decrease critical micelle concentration temperature, thus micellization is favored, and highly ordered mesoporous silicates with hexagonal structure can be therefore prepared at 5–15 °C, which is consistent with the reported by Yu et al.49 The amphiphilic behavior of (PEO)x–(PPO)y–(PEO)x polymers is temperature dependent. At low temperature, PEO is more hydrophilic.23 As the temperature increases, the PEO chains dehydrate and become more hydrophobic.50 Therefore PEO groups are less available for interaction with the silica source. This tends to increase the hydrophobic volumes of the surfactant aggregates. At the same time, temperature also affects the hydroxylation and condensation behaviors of TMOS. As the temperature increased, the hydrolysis and condensation rate of TMOS increased.51 This in turn changes size of the headgroup, length of the hydrophobic tail, and the ratio between hydrophilic and hydrophobic volumes,30,52 finally led to increasing g, realizing the transformation from hexagonal to vesicular silica. Then, siliceous materials with different structures can be obtained with the cooperation assembly of P123 and TMOS under the experimental conditions varying the synthetic temperature, and the transformation between the LCT and CVT was realized.
Our observations provide direct support for the competition between CVT and LCT pathways in the same organic templating system. In the case of P123 as a template while TMOS as the silica source, it is the change in the hydrophilicity/hydrophobicity ratio of both templates and inorganic precursors induced by temperature that finally leads to a great structural variation form conventional ordered mesostructures to vesicles in cooperatively organized organic–inorganic composites. Our results demonstrate that the LCT and CVT approach can be adjusted by finely control reaction temperature, a selective synthesis of vesicular or mesostructured silica materials by the CVT or LCT approach can be rationally designed and successfully achieved for further application.
3.2 Static adsorption and desorption properties
Sample synthesized at 15 (a) and 35 °C (f) (specified as HMS and MOSF, respectively) with different morphologies and structures, were selected to estimate their adsorption properties for water vapor and VOCs, comparing with commercial SG and AC. The study of static adsorption–desorption capacity of water vapor and VOCs was based on the mass change of the samples before and after the adsorption or desorption procedure. The histograms of water vapor adsorption capacity are presented in Fig. 5a. The water vapor desorption capacities and the titrated surface hydroxyl density are listed in Table 2. The HMS presents the highest water vapor adsorption capacity of about 0.706 g g−1 owing to high density of surface hydroxyl (2.34 × 10²⁰ g−1), which is higher than that of traditional SBA-15 and hollow spheres calcined at 550 °C (0.643 g g−1 and 0.264 g g−1, respectively, unpublished data). MOSF adsorbs a smaller amount of water vapor (0.632 g g−1) as compared to HMS, but higher than that of SG (0.445 g g−1) and AC (0.604 g g−1). The results confirm that HMS and MOSF are somewhat hydrophilic in nature due to a certain amount of hydrophilic silanol groups on the surface. The small pore size of HMS favors hydrogen bonding of the surface hydroxyls. On the contrary, the silanols are too far apart in the wide pores of MOSF, so with larger pore size of MOSF, an increased distance between silanol groups on the pore surfaces would improve the hydrophobicity. The relationship between water vapor adsorption capacities of all the samples and the corresponding densities of surface hydroxyl groups is linear, where the linear fitting coefficient R2 = 0.995 (as shown in the inset of Fig. 5b), which reveals that the amount of adsorbed water molecules on the adsorbents is greatly influenced by the accessible hydroxyl groups. | ||
| Fig. 5 The histogram of static water vapor adsorption capacities from triplicate measurements on different materials (a) and the relationship between static water vapor adsorption capacities and the densities of surface hydroxyl group (b). | ||
| Samples | Adsorption (g g−1) | Desorption (%) | Density of surface hydroxyl (×1020 g−1) |
|---|---|---|---|
| SG | 0.445 | 97.6 | 1.77 |
| HMS | 0.706 | 99.8 | 2.34 |
| MOSF | 0.632 | 99.4 | 2.21 |
| AC | 0.604 | 98.1 | 2.13 |
Fig. 6 shows the FT-IR patterns of calcined HMS, MOSF, and commercial SG. The almost absence of peaks corresponding to the strong C–H stretching and bending vibrations in the 2971, 2933, 2886, 1464, and 1384 cm−1 implied P123 was almost completely removed from HMS and MOSF through calcination process. The band in the region of 3420–3440 cm−1 is from the Si–OH groups while the peak at 1633 cm−1 can be attributed to the O–H bending vibration mode of the adsorbed water molecules.53 The intensities of the bands related to the Si–OH and O–H groups for HMS were stronger than that of MOSF and SG, which was correspond to the corresponding titrated results of the densities of surface hydroxyl groups.
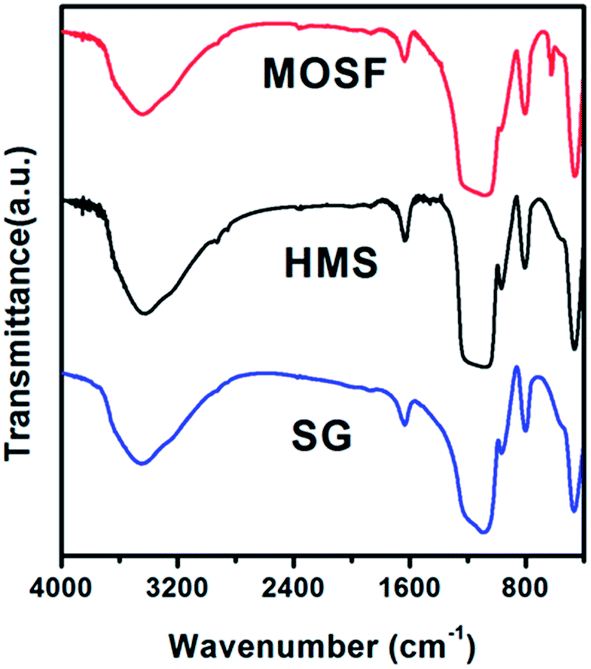 | ||
| Fig. 6 FT-IR patterns of calcined HMS, MOSF and SG. | ||
N-Hexane and 93# gasoline have been used as model adsorbates to evaluate the static VOCs adsorption capacity of different materials. As shown in Fig. 7a and b, the first n-hexane and 93# gasoline adsorption capacity of HMS is 0.840 and 0.958 g g−1, respectively, higher than that of traditional SBA-15 (0.481 g g−1 for n-hexane and 0.493 g g−1 for 93# gasoline, respectively, unpublished data) and hollow silicious spheres (HSSs) (0.641 for hexane and 0.256 for 93# gasoline, respectively, unpublished data) calcined at 550 °C, far lower than that of MOSF (1.80 and 1.24 g g−1, respectively). The n-hexane and 93# gasoline adsorption capacity of commercial SG in the first cycle is 0.449 g g−1 and 0.434 g g−1, respectively. As to commercial AC, n-hexane and 93# gasoline adsorption capacities are 0.619 g g−1 and 0.668 g g−1, respectively. As can also be seen from Fig. 7a and b, all the siliceous samples (HMS, MOSF and SG) have stable n-hexane and 93# gasoline adsorption capacities. However, the n-hexane and 93# gasoline adsorption capacity of AC decreased in the second adsorption cycle and kept constant during the following adsorption process.
 | ||
| Fig. 7 The histograms of static adsorption capacities (a), (b) and desorption efficiencies (c), (d) from triplicate measurements of n-hexane and 93# gasoline on different adsorbents. | ||
The desorption behavior of the adsorbents is very important for their reuse. It would be ideal for practical applications if VOCs can be recovered using mild heat treatment and simultaneously the adsorbents can be regenerated. As for the water vapor desorption efficiency of all the samples, a nearly complete desorption can be found (Table 2). All the siliceous samples (MOSF, HMS and SG) also show almost 100% desorption of n-hexane and 93# gasoline (Fig. 7c and d). As to AC, the desorption efficiencies are low (72.3% for n-hexane and 56.6% for 93# gasoline, respectively) during the first desorption process, and the desorption efficiencies can reach 100% during the second and the following desorption process. And the N2 sorption results of AC after 3rd repetitive adsorption–desorption processes show that the surface area and pore volume decreased distinctly (Table. S1†), which is called the degeneration of AC. The main reasons may be the adsorbed large molecule hydrocarbons in the micropores of AC cannot be easily desorbed under experimental conditions, thus the microspores will cease to be effective during next cycle adsorption. For the chemical adsorption because of the thermal effect during VOCs adsorption, or the unsaturated hydrocarbon, sulphur and so on in oil vapor, the surface of AC will be covered by carbon, polymer and other compounds, leading to the partly disappearing of micropores.54,55 The remarkable stable and high adsorption capacity of n-hexane and 93# gasoline, along with the complete desorption capacity can reveal that the synthesized HMS and MOSF are excellent VOC absorbents.
3.3 Dynamic adsorption and desorption behaviors
The breakthrough measurement is a direct method designed to make clear the dynamic performance of VOCs adsorption. In many cases the actual adsorption processes of VOCs are associated with adsorption using a fixed bed in which adsorbents are packed, into which air with VOCs flows. HMS and MOSF with different morphologies and structures were adopted here as representative samples to estimate the breakthrough behaviors for n-hexane, comparing with AC and SG. To determine the dynamic adsorption performance of adsorbents, the breakthrough time, the equilibrium adsorption capacity, and the stability are important parameters. The breakthrough curves of HMS, MOSF, SG and AC are shown in Fig. 8. The typical breakthrough curves give the evolution of the CA/C0 ratio as a function of time, where CA is the concentration of n-hexane at the outlet of the adsorption bed and C0 is the concentration of hexane at the inlet.56 The dynamic adsorption capacity was obtained by measuring the area between the maximum baseline and experimental curves.57 | ||
| Fig. 8 The first breakthrough curves of HMS, MOSF, AC and SG. (a) is the first time, (b) is the third time, (c) and (d) are the comparison of the breakthrough times and equilibrium adsorption capacities of the three times, respectively. | ||
As shown in Fig. 8c, the breakthrough times of the four samples are in the order of AC (30 min) > MOSF (26 min) > HMS (19 min) > SG (16 min) for the first dynamic adsorption process. Compared with MOSF and SG, the concentrations of n-hexane for HMS and AC increase more rapidly after the breakthrough, implying less diffusion resistance of HMS and AC during the adsorption process because of their higher micropores (Table SI†). However, the first equilibrium dynamic adsorption capacities (q) of n-hexane are in the order of MOSF (1.63 g g−1) > HMS (0.773 g g−1) > AC (0.483 g g−1) > SG (0.334 g g−1).
Adsorption experiments with three consecutive cycles were performed to investigate the regeneration and re-use properties of four adsorbents. After each adsorption cycle, the saturated adsorbent was heated to 100 °C under vacuum for 75 min so that the adsorbed n-hexane can be desorbed. The desorbed adsorbents were then re-used for the next adsorption procedure. The corresponding desorption efficiencies of n-hexane on four adsorbents for three consecutive cycles are shown in Fig. S4† for comparison. As can be seen from Fig. S4,† the first desorption efficiency of n-hexane on HMS, MOSF and SG are 99.1, 99.7 and 98.6%, respectively. The almost complete desorption may be due to the relatively weak adsorption of n-hexane on the external surface or the open mesopores. MOSF, SG, and HMS have stable breakthrough time, equilibrium adsorption time, and dynamic capacity after three consecutive adsorption–desorption cycles. However, AC can only be desorbed partially (59.6%) during the first desorption process under the same desorption conditions. The result indicates that regeneration under the chosen experimental conditions was unsuccessful in desorbing the adsorbed n-hexane from some of the adsorption sites of AC. It may be due to that AC has rich micropores, the n-hexane (with large molecular weight) adsorbed in the micropores of AC is strongly held by adsorption forces and the strongly adsorbed molecules cannot be easily desorbed efficiently under this mild desorption conditions.54,55 The breakthrough time, equilibrium adsorption time and dynamic adsorption capacity of AC decrease dramatically (Fig. 8c and d) and keep stable after 2nd repetitive dynamic adsorption–desorption cycles.
The stable breakthrough times of the four samples are in the order of MOSF (27 min) > AC (25 min) > HMS (20 min) > SG (15 min) (Fig. 8c), and the stable q of n-hexane are in the order of MOSF (1.62 g g−1) > HMS (0.778 g g−1) > AC (0.375 g g−1) > SG (0.326 g g−1) (Fig. 8d). Although the adsorption capacity in the dynamic adsorption was less than that in static one because of limited and lower diffusion into compressed samples, the order of adsorption capacity for the samples coincided with that in static adsorption. However, it is worthy to note that after 3 cycles of adsorption for AC, the adsorption capacity of for n-hexane remains constant and almost 77.6% of that of the corresponding 1st cycle value. The dynamic desorption behavior of n-hexane also shows a good agreement with that of the static experiments.
Fig. S5† depicts the relationships between the first dynamic n-hexane adsorption capacities and the corresponding structure parameters of different adsorbents. The dynamic n-hexane adsorption capacities of different adsorbents are irrelevant to the respective micro surface areas, micro pore volumes and surface areas (Fig. S5a–c†). As can be seen in Fig. S5d,† a higher pore volume directly leads to an increase in the adsorption capacities for n-hexane and is therefore an essential factor in determining the adsorption capacity of adsorbents. However, the macroscopic morphology also plays a great part in the adsorption process. The slower adsorption behavior of the MOSF and SG was the result of hindered diffusion,58 and the MOSF with polyhedric cells similar to the Weaire–Phelan structure33,35 and SG with smaller pore size39 show more diffusion resistance under this dynamic adsorption conditions. It is suggested that the adsorption behaviors of samples for VOC is concerned with both pore structures and morphology. From the dynamic adsorption data for four samples, it is concluded that the dynamic adsorption performance for gaseous n-hexane depends both on macroscopic morphology, pore characteristics and the compositions. The synthesized MOSF exhibits an excellent adsorption performance with higher dynamic adsorption capacity than SG, AC and HMS.
4 Conclusions
We have demonstrated a simple approach for the synthesis of mesoporous or macroporous silica materials with different structures (hexagonal and vesicular) and morphologies by using triblock copolymers P123 as template and TMOS as silica sources through simply changing the reaction temperature. Highly ordered mesoporous silica materials with hexagonal structure (HMS) can be synthesized at low reaction temperature (15 °C). The hexagonal structure transformed to vesicular structures over a temperature range of 20–26 °C, while macroporous ordered siliceous foams (MOSF) with the ultra large pore size (expanding ∼10 times from HMS) were obtained at 35 °C. The adsorption and desorption performance of HMS and MOSF under static (water vapor, n-hexane and 93#gasoline) and dynamic (n-hexane) conditions were investigated with commercial SG and AC as references. MOSF have higher VOCs adsorption capacity, good stability and comparable water vapor capacity under static conditions, and the best adsorption–desorption performance and recyclability under dynamic conditions, compared with AC, SG and HMS. Both pore structural and morphological characteristics differ from each other, and these characteristics have proven to be important factors that affect the dynamic VOC adsorption–desorption properties of silica samples. MOSF with hierarchical structures could have a promising future in the reduction of VOCs emissions.Acknowledgements
This work is supported by the National Science Foundations of China (21101017), Jiangsu province science and technology support program (BE2011651), Key University Science Research Project of Jiangsu Province (11KJA610002), the Opening Fund from Provincial Key Laboratory of Oil & Gas Storage and Transportation Technology, Jiangsu, P. R. China (cy1201), the Priority Academic Program Development of Jiangsu Higher Education Institutions (PAPD) and Jiangsu Key Laboratory of Advanced Catalytic Materials and Technology (BM2012110).References
- C. T. Kresge, M. E. Leonowicz, W. J. Roth, J. C. Vartuli and J. S. Beck, Nature, 1992, 359, 710–712 CrossRef CAS.
- D. Y. Zhao, J. L. Feng, Q. S. Huo, N. Melosh, G. H. Fredrickson, B. F. Chmelka and G. D. Stucky, Science, 1998, 279, 548–552 CrossRef CAS.
- Y. Wan and D. Y. Zhao, Chem. Rev., 2007, 107, 2821–2860 CrossRef CAS PubMed.
- J. M. Kim, Y. Sakamoto, Y. K. Hwang, Y. U. Kwon, O. Terasaki, S. E. Park and G. D. Stucky, J. Phys. Chem. B, 2002, 106, 2552–2558 CrossRef CAS.
- H. Zhang, J. M. Sun, D. Ma, G. Weinberg, D. S. Su and X. H. Bao, J. Phys. Chem. B, 2006, 110, 25908–25915 CrossRef CAS PubMed.
- W. J. J. Stevens, K. Lebeau, M. Mertens, G. Van Tendeloo, P. Cool and E. F. Vansant, J. Phys. Chem. B, 2006, 110, 9183–9187 CrossRef CAS PubMed.
- H. P. Lin and C. Y. Mou, Acc. Chem. Res., 2002, 35, 927–935 CrossRef CAS PubMed.
- G. S. Attard, J. C. Glyde and C. G. Goltner, Nature, 1995, 378, 366–368 CrossRef CAS.
- A. Monnier, F. Schuth, Q. Huo, D. Kumar, D. Margolese, R. S. Maxwell, G. D. Stucky, M. Krishnamurty, P. Petroff, A. Firouzi, M. Janicke and B. F. Chmelka, Science, 1993, 261, 1299–1303 CAS.
- Q. S. Huo, D. I. Margolese, U. Ciesla, D. G. Demuth, P. Y. Feng, T. E. Gier, P. Sieger, A. Firouzi, B. F. Chmelka, F. Schuth and G. D. Stucky, Chem. Mater., 1994, 6, 1176–1191 CrossRef CAS.
- L. F. Zhang and A. Eisenberg, Science, 1995, 268, 1728–1731 CAS.
- M. Antonietti and S. Forster, Adv. Mater., 2003, 15, 1323–1333 CrossRef CAS.
- K. Kita-Tokarczyk, J. Grumelard, T. Haefele and W. Meier, Polymer, 2005, 46, 3540–3563 CrossRef CAS PubMed.
- B. M. Discher, Y. Y. Won, D. S. Ege, J. C. M. Lee, F. S. Bates, D. E. Discher and D. A. Hammer, Science, 1999, 284, 1143–1146 CrossRef CAS.
- P. Alexandridis, U. Olsson and B. Lindman, Langmuir, 1998, 14, 2627–2638 CrossRef CAS.
- F. S. a. Bates and G. H. Fredrickson, Annu. Rev. Phys. Chem., 1990, 41, 525–557 CrossRef CAS PubMed.
- S. Forster, M. Zisenis, E. Wenz and M. Antonietti, J. Chem. Phys., 1996, 104, 9956–9970 CrossRef PubMed.
- P. Bhargava, Y. F. Tu, J. X. Zheng, H. M. Xiong, R. P. Quirk and S. Z. D. Cheng, J. Am. Chem. Soc., 2007, 129, 1113–1121 CrossRef CAS PubMed.
- J. M. Sun, D. Ma, H. Zhang, C. L. Wang, X. H. Bao, D. S. Su, A. Klein-Hoffmann, G. Weinberg and S. Mann, J. Mater. Chem., 2006, 16, 1507–1510 RSC.
- T. S. Davies, A. M. Ketner and S. R. Raghavan, J. Am. Chem. Soc., 2006, 128, 6669–6675 CrossRef CAS PubMed.
- G. W. Zhou, Y. J. Chen, J. H. Yang and S. H. Yang, J. Mater. Chem., 2007, 17, 2839–2844 RSC.
- J. Liu, Q. H. Yang, L. Zhang, D. M. Jiang, X. Shi, J. Yang, H. Zhong and C. Li, Adv. Funct. Mater., 2007, 17, 569–576 CrossRef CAS.
- J. Liu, C. M. Li, Q. H. Yang, J. Yang and C. Li, Langmuir, 2007, 23, 7255–7262 CrossRef CAS PubMed.
- X. F. Zhou, A. J. Duan, Z. Zhao, Y. J. Gong, H. D. Wu, J. M. Li, Y. C. Wei, G. Y. Jiang, J. Liu and Y. Zhang, J. Mater. Chem. A, 2014, 2, 6823–6833 CAS.
- T. Lu, X. D. Yao, G. Q. Lu and Y. H. He, J. Colloid Interface Sci., 2009, 336, 368–373 CrossRef CAS PubMed.
- P. Yuan, S. Yang, H. N. Wang, M. H. Yu, X. F. Zhou, G. Q. Lu, J. Zou and C. Z. Yu, Langmuir, 2008, 24, 5038–5043 CrossRef CAS PubMed.
- X. Gu, C. L. Li, X. H. Liu, J. W. Ren, Y. Q. Wang, Y. L. Guo, Y. Guo and G. Z. Lu, J. Phys. Chem. C, 2009, 113, 6472–6479 CAS.
- J. Zhang, M. H. Yu, P. Yuan, G. Q. Lu and C. Z. Yu, J. Inclusion Phenom. Macrocyclic Chem., 2011, 71, 593–602 CrossRef CAS.
- P. Yuan and X. J. Bao, Mater. Lett., 2013, 109, 199–202 CrossRef CAS PubMed.
- J. Zhang, M. H. Yu, P. Yuan, H. N. Wang, K. Qian, L. Tan, Y. H. Wang and C. Z. Yu, J. Mater. Res., 2010, 25, 648–657 CrossRef CAS.
- J. Liu, L. Zhang, Q. H. Yang and C. Li, Microporous Mesoporous Mater., 2008, 116, 330–338 CrossRef CAS PubMed.
- J. Liu, Q. Yang, X. S. Zhao and L. Zhang, Microporous Mesoporous Mater., 2007, 106, 62–67 CrossRef CAS PubMed.
- P. Yuan, X. F. Zhou, H. N. Wang, N. A. Liu, Y. F. Hu, G. J. Auchterlonie, J. Drennan, X. D. Yao, G. Q. Lu, J. Zou and C. Z. Yu, Small, 2009, 5, 377–382 CrossRef CAS PubMed.
- H. N. Wang, Y. H. Wang, X. Zhou, L. Zhou, J. Tang, J. Lei and C. Yu, Adv. Funct. Mater., 2007, 17, 613–617 CrossRef CAS.
- H. N. Wang, X. F. Zhou, M. H. Yu, Y. H. Wang, L. Han, J. Zhang, P. Yuan, G. Auchterlonie, J. Zou and C. Z. Yu, J. Am. Chem. Soc., 2006, 128, 15992–15993 CrossRef CAS PubMed.
- A. J. Fletcher, E. J. Cussen, D. Bradshaw, M. J. Rosseinsky and K. M. Thomas, J. Am. Chem. Soc., 2004, 126, 9750–9759 CrossRef CAS PubMed.
- J. Sears and W. George, Anal. Chem., 1956, 28, 1981–1983 CrossRef.
- Z. H. Ouyang, L. Wu, K. B. Li, S. C. Cao, Y. Wang, L. Lian, D. L. Yi and X. R. Qin, Chem. Ind. Eng. Prog., 2005, 24, 1265–1268 CAS.
- H. N. Wang, M. Tang, K. Zhang, D. F. Cai, W. Q. Huang, R. Y. Chen and C. Z. Yu, J. Hazard. Mater., 2014, 268, 115–123 CrossRef CAS PubMed.
- H. N. Wang, M. Tang, L. Han, J. Y. Cao, Z. H. Zhang, W. Q. Huang, R. Y. Chen and C. Z. Yu, J. Mater. Chem. A, 2014, 2, 19298–19307 CAS.
- Q. Hu, J. J. Li, Z. P. Hao, L. D. Li and S. Z. Qiao, Chem. Eng. J., 2009, 149, 281–288 CrossRef CAS PubMed.
- C. Z. Yu, J. Fan, B. Z. Tian, D. Y. Zhao and G. D. Stucky, Adv. Mater., 2002, 14, 1742–1745 CrossRef CAS.
- T. Azzam and A. Eisenberg, Angew. Chem., Int. Ed., 2006, 45, 7443–7447 CrossRef PubMed.
- J. C. M. Vanhest, D. A. P. Delnoye, M. Baars, M. H. P. Vangenderen and E. W. Meijer, Science, 1995, 268, 1592–1595 CAS.
- P. L. Soo and A. Eisenberg, J. Polym. Sci. Part B Polym. Phys., 2004, 42, 923–938 CrossRef CAS.
- J. Fan, C. Z. Yu, J. Lei, Q. Zhang, T. C. Li, B. Tu, W. Z. Zhou and D. Y. Zhao, J. Am. Chem. Soc., 2005, 127, 10794–10795 CrossRef CAS PubMed.
- C. Z. Yu, J. Fan, B. Z. Tian, G. D. Stucky and D. Y. Zhao, J. Phys. Chem. B, 2003, 107, 13368–13375 CrossRef CAS.
- C. Z. Yu, J. Fan, B. Z. Tian and D. Y. Zhao, Chem. Mater., 2004, 16, 889–898 CrossRef CAS.
- C. Z. Yu, B. Z. Tian, J. Fan, G. D. Stucky and D. Y. Zhao, Chem. Commun., 2001, 2726–2727 RSC.
- M. Kruk, M. Jaroniec, C. H. Ko and R. Ryoo, Chem. Mater., 2000, 12, 1961–1968 CrossRef CAS.
- C. J. Brinker and G. W. Scherer, Sol–gel science: the physics and chemistry of sol–gel processing, 1990 Search PubMed.
- M. H. Yu, P. Yuan, J. Zhang, H. N. Wang, Y. Zhang, Y. F. Hu, Y. H. Wang and C. Z. Yu, J. Nanosci. Nanotechnol., 2010, 10, 612–615 CrossRef CAS PubMed.
- M. Kokunesoski, J. Gulicovski, B. Matovic, M. Logar, S. K. Milonjic and B. Babic, Mater. Chem. Phys., 2010, 124, 1248–1252 CrossRef CAS PubMed.
- K. Hiro and S. Renichirou, Foundation and Design of Adsorptions, Chemical Industry Press, Beijing, 1983 Search PubMed.
- W. Q. Huang, Y. L. Lv, J. Bai, Y. T. Shen, S. H. Zhao and J. Zhong, Chin. J. Environ. Chem., 2011, 5, 1586–1591 CAS.
- M. Guillemot, J. Mijoin, S. Mignard and P. Magnoux, Ind. Eng. Chem. Res., 2007, 46, 4614–4620 CrossRef CAS.
- K. Kosuge, S. Kubo, N. Kikukawa and M. Takemori, Langmuir, 2007, 23, 3095–3102 CrossRef CAS PubMed.
- K. Kosuge, T. Sato, N. Kikukawa and M. Takemori, Chem. Mater., 2004, 16, 899–905 CrossRef CAS.
Footnote |
| † Electronic supplementary information (ESI) available. See DOI: 10.1039/c4ra12553c |
| This journal is © The Royal Society of Chemistry 2015 |