Meng Jua,
Jian Lvbc,
Xiao-Yu Kuang*a,
Li-Ping Dinga,
Cheng Lu*d,
Jing-Jing Wanga,
Yuan-Yuan Jina and
George Maroulis*e
aInstitute of Atomic and Molecular Physics, Sichuan University, Chengdu 610065, China. E-mail: scu_kuang@163.com
bBeijing Computational Science Research Center, Beijing 100084, China
cState Key Laboratory of Superhard Materials, Jilin University, Changchun 130012, China
dDepartment of Physics, Nanyang Normal University, Nanyang 473061, China. E-mail: lucheng@calypso.cn
eDepartment of Chemistry, University of Patras, GR-26500 Patras, Greece. E-mail: maroulis@upatras.gr
First published on 17th December 2014
The structural properties of neutral and charged (FeO)nμ (n = 1–8, μ = 0, ±1) clusters have been studied using an unbiased CALYPSO structure searching method. As a first step, an unbiased search relying on several structurally different initial clusters has been undertaken. Subsequently, geometry optimization by means of density-functional theory with the Perdew and Wang (PW91) exchange–correlation functional is carried out to determine the relative stability of various candidates for low-lying neutral, anionic and cationic iron oxide clusters obtained from the unconstrained search. It is shown that the mostly equilibrium geometries of iron oxide clusters represent near planar structures for n ≤ 3. No significant structural differences are observed between the neutral and charged iron oxide clusters beyond sizes with n = 6. The relative stabilities of (FeO)nμ clusters for the ground-state structures are analyzed on the basis of binding energies and HOMO–LUMO gaps. Our theoretical results confirm that the binding energies of neutral and anionic (FeO)n0/− tend to increase with cluster size. Cationic (FeO)n+ exhibits a slight downward trend. It is worth noticing that (FeO)5 and (FeO)4−/+ are the most stable geometries for (FeO)nμ (n = 1–8, μ = 0, ±1) clusters. Lastly, an evident local oscillation of magnetic behavior is present in the most stable (FeO)nμ (n = 1–8, μ = 0, ±1) clusters, and the origin of this magnetic phenomenon is analyzed in detail.
Iron oxide clusters and nanoparticles are of primary significance in a wide spectrum of subjects ranging from astrophysics and astrochemistry to nanomedicine and materials science. Iron monoxide nanoparticles are now thought of being responsible for the 21 μm emission feature in post-asymptotic giant branch stars.11,12 In nanomedicine, iron oxide nanoparticles and alternating magnetic fields are used to produce local hyperthermia in cancer therapy.13 Among other materials science implications,14 recent work by Lin et al.15 shows that iron oxide nanoparticle and graphene nanoribbon composites display remarkable potential in new-generation lithium-ion battery anodes. Advancing to fundamental physicochemical characteristics, it is worth noticing that of all metal oxide clusters, iron oxide ones are of particular interest because of their remarkable electronic and structural features. It is now fairly obvious that in-depth studies on iron oxide clusters not only provide a new avenue to detailed information about the interaction between oxygen and iron but also provide insight into the chemical processes in corrosion, biological oxygen transport, and oxide film formation.16–18 In addition, some iron oxide clusters, such as Fe2O3, seem to be potential candidates for CO oxidation and NO reduction which are undesirable chemical products in many industrial processes and their removal is one of the most important industrial and environmental problems nowadays.19
On the experimental side, Wang et al. reported the first study of a series of small FenOm clusters, containing up to four Fe and six oxygen atoms in molecular beams, by using size-selected anion photoelectron spectroscopy.20 Their results indicated that small FenOm clusters can be viewed as sequential oxygen atom adsorption to the surfaces of the Fen (n = 3, 4) clusters, leading to nearly linear increase of the electron affinity with the number of O atoms. Shin et al. studied the neutral cluster distribution of iron oxide clusters formed by laser ablation of iron metal and reaction of the metal plasma plume with oxygen in the gas phase under a wide variety of experimental conditions, including oxygen concentration and 193 nm ionization laser power, among other variables.21,22 The most stable clusters observed under conditions of excess oxygen are of the form FemOm and FemOm+1,2. Wang et al. measured the infrared spectra of mass-selected oxygen-rich cation complexes in the gas phase and studied the geometric and electronic structures of iron dioxygen Fe(O2)n+ (n = 3–5) cluster by infrared photodissociation spectroscopy.23 In order to elucidate the growth behavior of the iron oxide clusters, Gutsev et al. investigated the electronic and geometrical structures of oxygen-rich neutral and negatively charged FeOn clusters by employing density functional theory with generalized gradient approximation.24 However, a systematic theoretical understanding of the interaction of oxygen with iron is still lacking, in particular for large architectures.
In order to systematically study the interaction of oxygen with iron and structural evolution in iron oxide clusters, we here present extensive structure searches to explore the global minimum geometric structures of neutral and charged iron oxide clusters in the size range of 2 ≤ n ≤ 8, by combining our developed CALYPSO (Crystal structure AnaLYsis by Particle Swarm Optimization) method with the density functional theory. Our first goal of this work is to gain a fundamental understanding of the ground state geometric structures in iron oxide clusters. The second one is to reexamine a number of neutral and charged low-energy isomers of small iron oxide clusters that have been reported previously by experiments or density functional calculations. Thirdly, we are also motivated to explore the physical mechanism of the magnetic behaviors of neutral, anionic and cationic iron oxide clusters and provide relevant information for further theoretical and experimental studies. In what follows, we will first describe the computational methodology in Section 2, and then present our results and discussions in Section 3. Finally, a summary is given in Section 4.
In order to test the reliability of our calculations, we have calculated the neutral and anionic two-atom clusters (FeO, FeO−, O2, O2−, Fe2 and Fe2−) through many different functionals (B3LYP,32,33 TPSS,34 PW91,32,35 BP86,33 PBE34 and B3PW91 32,35,36) with the 6-311+G* basis set. The calculated results are summarized in Table 1. It is seen that the PW91 method gives results of bond lengths (r), vibration frequencies (ω) and dissociation energies (D) of the two-atom dimers closest to the experimental values.37–45 To further confirm the reliability of the computational method, the vertical detachment energies (VDEs = Eneutral at optimized anion geometry − Eoptimized anion) and adiabatic electronic affinities (AEAs = Eoptimized neutral − Eoptimized anion) for the ground state of (FeO)n− (n = 1–8) clusters are also calculated. The theoretical results as well as the experimental data are listed in Table 2. The agreement between the experimental data and the calculated results is also excellent. The reasonable agreement between the calculated values strengthens our choice of theoretical methods.
Clusters | Multi. | Para. | Methods | Exp. | |||||
---|---|---|---|---|---|---|---|---|---|
B3LYP | TPSS | PW91 | BP86 | PBE | B3PW91 | ||||
a Ref. 37.b Ref. 38.c Ref. 39.d Ref. 40.e Ref. 41.f Ref. 42.g Ref. 43.h Ref. 44.i Ref. 45. | |||||||||
FeO | 5 | r | 1.63 | 1.61 | 1.61 | 1.61 | 1.61 | 1.60 | 1.62a |
ω | 910 | 913 | 908 | 909 | 905 | 912 | 881b | ||
D | 4.37 | 5.07 | 4.49 | 5.33 | 5.46 | 4.80 | 4.20b | ||
FeO− | 4 | r | 1.65 | 1.63 | 1.63 | 1.63 | 1.63 | 1.64 | 1.63b |
ω | 812 | 858 | 855 | 854 | 851 | 826 | 849f | ||
D | 6.31 | 6.28 | 6.86 | 6.77 | 6.79 | 6.11 | |||
O2 | 3 | r | 1.21 | 1.22 | 1.22 | 1.22 | 1.22 | 1.20 | 1.21c |
ω | 1633 | 1544 | 1546 | 1537 | 1549 | 1677 | 1580c | ||
D | 5.19 | 5.35 | 5.05 | 5.89 | 6.06 | 5.25 | 5.12h | ||
O2− | 2 | r | 1.35 | 1.37 | 1.36 | 1.36 | 1.36 | 1.33 | 1.28c |
ω | 1165 | 1092 | 1101 | 1096 | 1103 | 1203 | 1131c | ||
D | 5.77 | 5.78 | 5.56 | 6.45 | 6.49 | 5.66 | |||
Fe2 | 7 | r | 1.98 | 2.00 | 2.01 | 2.01 | 2.01 | 1.98 | 2.02d |
ω | 428 | 406 | 400 | 402 | 397 | 431 | 418g | ||
D | 1.38 | 1.93 | 1.48 | 2.31 | 2.47 | 1.18 | 1.15i | ||
Fe2− | 8 | r | 2.05 | 2.06 | 2.06 | 2.06 | 2.07 | 2.04 | 2.10e |
ω | 369 | 355 | 352 | 353 | 349 | 370 | 270e | ||
D | 1.35 | 2.24 | 1.73 | 2.61 | 2.71 | 1.46 | 1.90i |
![]() | ||
Fig. 1 Lowest-energy and low-lying structures of (FeO)n (n = 1–8) clusters. The red and blue balls represent oxygen and iron atoms, respectively. |
![]() | ||
Fig. 2 Lowest-energy and low-lying structures of (FeO)n− (n = 1–8) clusters. The red and blue balls represent oxygen and iron atoms, respectively. |
![]() | ||
Fig. 3 Lowest-energy and low-lying structures of (FeO)n+ (n = 1–8) clusters. The red and blue balls represent oxygen and iron atoms, respectively. |
Sta. | Sym. | ΔE | Freq. | Sta. | Sym. | ΔE | Freq. | Sta. | Sym. | ΔE | Freq. | |||
---|---|---|---|---|---|---|---|---|---|---|---|---|---|---|
1a | 5Σ | C∞v | 0.00 | 82, 259 | 1a* | 4Σ | C∞v | 0.00 | 76, 315 | 1a+ | 4Σ | C∞v | 0.00 | 79, 286 |
2a | 7B | C2 | 0.00 | 113, 688 | 2a* | 10A | C2 | 0.00 | 144, 625 | 2a+ | 10B | C2 | 0.00 | 108, 685 |
2b | 9B | C2 | 0.14 | 185, 680 | 2b* | 6A | C2 | 0.07 | 243, 702 | 2b+ | 4B | C2 | 0.58 | 161, 733 |
2c | 11B | C2 | 1.04 | 87, 662 | 2c* | 6Bg | C2h | 0.50 | 37, 863 | 2c+ | 12B | C2 | 1.12 | 195, 644 |
3a | 5A′′ | Cs | 0.00 | 89, 579 | 3a* | 4A2 | C2v | 0.00 | 157, 687 | 3a+ | 6A | C1 | 0.00 | 74, 685 |
3b | 13A2 | C2v | 0.14 | 141, 708 | 3b* | 8A1 | C2v | 0.95 | 110, 686 | 3b+ | 14A′′ | Cs | 0.43 | 97, 684 |
3c | 7A′′ | Cs | 0.64 | 85, 701 | 3c* | 8A | C1 | 1.94 | 57, 893 | 3c+ | 8A | C1 | 0.65 | 44, 750 |
4a | 9A | C2 | 0.00 | 39, 619 | 4a* | 8A | C2 | 0.00 | 49, 661 | 4a+ | 8A | Cs | 0.00 | 129, 649 |
4b | 9A′ | Cs | 0.24 | 136, 700 | 4b* | 6A | C1 | 0.68 | 32, 654 | 4b+ | 6B | C2 | 0.12 | 37, 744 |
4c | 11B | C2 | 0.92 | 41, 753 | 4c* | 6A | C1 | 1.58 | 65, 877 | 4c+ | 4A | C2 | 0.13 | 50, 710 |
5a | 11A | C1 | 0.00 | 78, 643 | 5a* | 10A′′ | C1 | 0.00 | 54, 701 | 5a+ | 4A′ | Cs | 0.00 | 21, 708 |
5b | 9A | C1 | 0.11 | 51, 720 | 5b* | 12A′′ | C1 | 0.18 | 19, 691 | 5b+ | 4A | C1 | 0.66 | 74, 657 |
5c | 9A | C1 | 1.24 | 85, 696 | 5c* | 6A | C1 | 1.70 | 63, 675 | 5c+ | 4A′ | Cs | 0.89 | 31, 735 |
6a | 9A | C1 | 0.00 | 50, 747 | 6a* | 8A | C1 | 0.00 | 51, 698 | 6a+ | 8A | C1 | 0.00 | 34, 708 |
6b | 7A | C1 | 0.95 | 56, 691 | 6b* | 10A | C1 | 0.41 | 48, 725 | 6b+ | 6A | C1 | 0.03 | 38, 716 |
6c | 9A | C1 | 1.00 | 62, 920 | 6c* | 8A | C1 | 1.80 | 66, 660 | 6c+ | 8A | C1 | 1.17 | 64, 769 |
7a | 5A | C1 | 0.00 | 62, 680 | 7a* | 8A | C1 | 0.00 | 72, 675 | 7a+ | 4A | C1 | 0.00 | 56, 648 |
7b | 9A | C1 | 0.92 | 67, 681 | 7b* | 4A | C1 | 0.98 | 41, 782 | 7b+ | 10A | C1 | 0.45 | 48, 667 |
7c | 9A | C1 | 0.98 | 26, 953 | 7c* | 8A | C1 | 1.61 | 32, 912 | 7c+ | 8A | C1 | 1.45 | 28, 880 |
8a | 11A | C1 | 0.00 | 41, 706 | 8a* | 8A | C1 | 0.00 | 58, 659 | 8a+ | 4A | C1 | 0.00 | 48, 694 |
8b | 13A | C1 | 0.86 | 38, 761 | 8b* | 8A | C1 | 0.48 | 24, 691 | 8b+ | 10A | C1 | 0.37 | 30, 640 |
8c | 9A | C1 | 1.17 | 46, 777 | 8c* | 6A | C1 | 1.33 | 48, 706 | 8c+ | 6A | C1 | 1.12 | 41, 682 |
For neutral iron oxide clusters, the calculated results indicate that the planar ring structures are slightly more stable than the distorted isomers for n ≤ 3. Conversely, the ground state structures begin to exhibit the hollow three-dimensional (3D) configurations at n = 4. Our theoretical results show that the ground state of (FeO)2 is 7B, followed by other two states 9B(2b) and 11B(2c). The three isomers have the same point symmetry of C2. The Fe–O bond length in ground state is 1.79 Å which is almost the same as the bond length of (CuO)2 measured by Wang et al.46 Besides, the structure (2b), which is only 0.14 eV higher in energy than the ground state, shows a butterfly structure with the Fe–Fe bond for the “body” of the insect plus four Fe–O bonds at the edges of the “wings”. In fact, the lowest energy structure of (FeO)4 is an open ring structure with the C2 point symmetry, and the O atoms located at the apex are slightly tilted. From Fig. 1, we can clearly see that the higher sizes in this sequence consist of structures built via vertically assembling stable rings to form layer-like structures. For example, the ground state structure of (FeO)5 is a approximate hollow triangular prism with a (FeO)3 ring at the bottom. Subsequently, for (FeO)7, the most stable structure is a tower structure, which can be constructed by one (FeO)3 ring and one (FeO)4 ring. This interesting phenomenon has also been observed in (MnO)n clusters.47 The structural evolution also shows that the layered structures become energetically more favorable for n ≥ 5. This may be due to the enhanced complex interaction between iron and oxygen atoms as the increasing of the cluster size.
For anion clusters, the ground state structure of (FeO)2− (2a*) is a flat structure of diamond (10A) with bond length Fe–O = 1.85 Å. It is in good agreement with the similar theoretical result reported by Shiroishi et al. (1.87 Å).48 The ground state structure of (FeO)6− shows an approximate hollow triangular prism, which can be viewed as a (FeO)4 ring on each sides. The isomers (6b*) and (6c*) are less stable than the respective ground state (6a*) by 0.41 eV and 1.80 eV, respectively. For (FeO)8−, a “cage-shaped” structure with 8A state is obtained. The relative high octet spin multiplicity is more stable than sextet and quartet state. In order to gain more insight into the electronic properties of the iron oxide clusters, the vertical detachment energies (VDEs) and adiabatic electronic affinities (AEAs) of the ground state of (FeO)n− (n = 1–8) clusters are also predicted. The theoretical results are listed in Table 2 together with available experimental values for comparison.20 It can be seen from Table 2 that the calculated AEA values of (FeO)n− (n = 1–4) clusters are mostly in good agreement with experimental values, with the average discrepancy of 4%. These results further give us confidence to confirm that our searched lowest-energy structures are true minima. However, there is no any available experimental data to compare with our obtained VDE and AEA results for (FeO)n− (n = 5–8) clusters. Thus, we hope that our theoretical results would provide more available information for further experimental investigation.
For cationic charged iron oxide clusters, the geometrical optimization of the final structures confirm that the (FeO)n+ clusters become more compact and symmetrical. The ground state structures begin to show layer-like structures at n = 4, as shown in Fig. 3. For the (FeO)3+ cluster, the preferred lowest energy structure is a hexagon ring. This configuration is similar to the structure of (ZnO)3 reported by Wang et al.49 The low-lying isomers (3b+) and (3c+) have the similar structures but higher electronic states (14A′′) and (8A), which lead to the deviation of energy. (FeO)4+ is an approximate hollow triangular prism with Cs symmetry. It can be viewed as the result of the removal of a FeO chain from the neutral (FeO)5 cluster. Interestingly enough, the lowest-energy structure of (FeO)5+ is similar to the corresponding neutral and anionic clusters. This phenomenon can be also found in other low-lying isomers (5c and 5c*, 6c* and 6c+ etc.), just with small distortions. The present calculations indicate that within each size, the Fe atom tends to form the largest probable number of bonds with O atoms, which is similar to iron sulfur clusters.50
As discussed above, we find that the ground state structures of (FeO)n0/−/+ clusters are “ring structures” when n ≤ 3, which is similar to the previous reported FenOm clusters.51 When n ≥ 4, the ground state structures of (FeO)n0/−/+ exhibit layer-like 3D configurations. It should be pointed out that all the low-lying structures are found to prefer high spin state. There are no significant differences between the neutral and charged clusters.
![]() | (1) |
![]() | ||
Fig. 4 Size dependence of the binding energy per atom Eb (a) and HOMO–LUMO energy gap Egap (b) for the lowest-energy structures of (FeO)nμ (n = 1–8, μ = 0, ±1) clusters. |
The highest occupied-lowest unoccupied molecular orbital (HOMO–LUMO) energy gaps have been proved to be a powerful tool to represent the ability of the molecule to participate in the chemical reaction in some degree. The larger values of HOMO–LUMO energy gaps correspond to a stronger chemical stability. The calculated values of HOMO, LUMO and HOMO–LUMO energy gaps for the lowest-energy (FeO)nμ (n = 1–8, μ = 0, ±1) clusters are listed in Table 4. In addition, the HOMO–LUMO energy gap Egap as a function of the cluster size n is presented in Fig. 4(b). It can be seen from Table 4 that the values of HOMO and LUMO for (FeO)n− clusters are higher than those of their corresponding neutral and cationic clusters. The local maximum values (0.57 eV, 0.51 eV, 0.58 eV) of HOMO–LUMO energy gaps are found at n = 5 for neutral and n = 4 for charged iron oxide cluster, respectively. This indicates that these clusters are more stable than their neighboring clusters. From Fig. 4(b), we can clearly find a conspicuous valley appear at (FeO)6−, meaning that the stability of (FeO)6− cluster is increased when removing an extra electron.
Cluster size | (FeO)n | (FeO)n− | (FeO)n+ | ||||||
---|---|---|---|---|---|---|---|---|---|
HOMO | LUMO | HO–LU gap | HOMO | LUMO | HO–LU gap | HOMO | LUMO | HO–LU gap | |
n = 1 | −4.55 | −4.08 | 0.47 | 1.40 | 1.79 | 0.39 | −13.09 | −12.89 | 0.20 |
n = 2 | −4.28 | −3.84 | 0.44 | 0.55 | 0.95 | 0.40 | −10.87 | −10.50 | 0.37 |
n = 3 | −4.90 | −4.78 | 0.12 | 0.36 | 0.77 | 0.41 | −11.23 | −11.12 | 0.11 |
n = 4 | −5.23 | −5.04 | 0.18 | −0.45 | 0.07 | 0.51 | −10.52 | −9.94 | 0.58 |
n = 5 | −5.58 | −5.01 | 0.57 | −0.74 | −0.26 | 0.47 | −10.01 | −9.81 | 0.20 |
n = 6 | −5.14 | −4.77 | 0.37 | −1.03 | −0.90 | 0.13 | −10.03 | −9.75 | 0.28 |
n = 7 | −5.04 | −4.58 | 0.46 | −1.34 | −0.91 | 0.42 | −9.10 | −8.90 | 0.20 |
n = 8 | −5.09 | −4.92 | 0.17 | −1.02 | −0.82 | 0.20 | −9.06 | −8.93 | 0.13 |
Fig. 5 shows the molecular orbital energy levels of the three relative stable (FeO)5, (FeO)4− and (FeO)4+ clusters together with their molecular orbital maps. The blue and red lines show the occupied orbital while the yellow and azure lines represent the unoccupied orbital. It can be seen from Fig. 5 that the (FeO)5 is characteristic of the degeneration of the molecular orbital energy level of HOMO and LUMO, which probably leads to its largest value for the energy gap. Moreover, to understand the relative stability of the remaining clusters, we have also calculated the molecular orbital energy levels of their lowest-energy structures, as shown in Fig. S1–S4 (see ESI†). In addition, we can also note that their highest occupied molecular orbitals with bonding character between O-2p and Fe-3d orbitals as shown in their molecular orbital plots. The result is further confirmed by calculating molecular orbital maps of the HOMO−1 and LUMO+1 of (FeO)5, (FeO)4− and (FeO)4+ clusters (see Fig. S5†).
![]() | ||
Fig. 5 Calculated molecular orbital energy levels of (FeO)5, (FeO)4− and (FeO)4+ clusters together with the molecular orbital maps of the HOMOs and LUMOs. |
![]() | ||
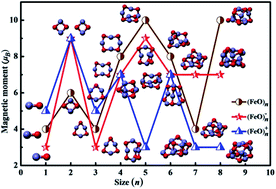
Fig. 6 Size dependence of spin magnetic moments together with the corresponding geometries for the lowest-energy structures of (FeO)nμ (n = 1–8, μ = 0, ±1) clusters. |
Clusters | Moment (μB) | |||
---|---|---|---|---|
Fe | ||||
3d | 4s | 4p | Local | |
FeO | 2.86 | 0.46 | 0.09 | 3.41 |
(FeO)2 | 5.34 | 0.10 | 0.12 | 5.56 |
(FeO)3 | 3.33 | 0.11 | 0.01 | 3.45 |
(FeO)4 | 6.75 | 0.14 | 0.04 | 6.93 |
(FeO)5 | 8.89 | 0.22 | 0.03 | 9.14 |
(FeO)6 | 7.09 | 0.14 | 0.11 | 7.34 |
(FeO)7 | 3.42 | 0.09 | 0.05 | 3.56 |
(FeO)8 | 9.41 | 0 | 0.04 | 9.45 |
(FeO)− | 2.84 | −0.29 | 0.02 | 2.57 |
(FeO)2− | 6.78 | 0.64 | 0.38 | 7.8 |
(FeO)3− | 2.75 | −0.03 | −0.03 | 2.69 |
(FeO)4− | 6.12 | 0.02 | 0.01 | 6.15 |
(FeO)5− | 8.20 | 0.04 | 0.2 | 8.44 |
(FeO)6− | 6.24 | 0.69 | 0.03 | 6.96 |
(FeO)7− | 5.48 | 0 | 0.12 | 5.60 |
(FeO)8− | 6.98 | 0 | −0.05 | 6.93 |
(FeO)+ | 3.54 | 0.23 | 0.03 | 3.8 |
(FeO)2+ | 7.16 | 0.1 | 0.08 | 7.34 |
(FeO)3+ | 3.99 | 0.13 | −0.05 | 4.07 |
(FeO)4+ | 6.37 | 0.12 | 0.03 | 6.52 |
(FeO)5+ | 2.86 | 0.04 | −0.05 | 2.85 |
(FeO)6+ | 6.28 | 0.16 | 0 | 6.44 |
(FeO)7+ | 2.12 | 0.02 | 0.01 | 2.15 |
(FeO)8+ | 2.87 | 0.3 | −0.02 | 3.15 |
In order to explore the origin of the magnetic behavior, the total density of states (TDOS) and partial density of states (PDOS) of (FeO)3 and (FeO)5 for neutral clusters, (FeO)2− and (FeO)5− for anionic clusters as well as (FeO)2+ and (FeO)5+ for cationic clusters are discussed. Overall, the total DOS show clear spin polarization near the Fermi energy, as Fig. 7 illustrated. By comparing the total and partial DOS, it is obviously found that the total magnetic moments mainly come from Fe-d states, while the magnetic moments of O-s and O-p states are nearly negligible, indicating that spin polarization is mainly localized on the Fe atoms. This result is in agreement with the findings of Palotás et al.52
Generally, the hybridization between s, p, and d states causes the closed-shell Fe atoms to have an incomplete d-shell configuration, which is usually responsible for the magnetism of transition-metal clusters. The up- and down-spin sub-bands of the Fe-d states of (FeO)5 and (FeO)3 (see Fig. 7(b) and (d)) appear similar to each other while the sub-bands of the O-p states of (FeO)5 cluster are more closely spaced in comparison to that of (FeO)3 cluster, which enhances the depletion of Fe-d states through p–d hybridization. This may be due to the fact (FeO)5 has a larger magnetic moment than the (FeO)3 cluster. In addition, systematically sharp and prominent peaks are observed in the DOS of Fe-d states in (FeO)2− and (FeO)2+ clusters, as shown in Fig. 7(f) and (j). The results suggest that the electrons are relatively localized and the corresponding energy bands are relatively narrow. The partial DOS of (FeO)5− and (FeO)5+ clusters is presented in Fig. 7(h) and (l). A similar trend is observed in Fe-d states, and slightly weakening of the O-p states is found by comparing with the (FeO)5 cluster. Namely, the attachment or deprivation of an extra electron can slightly reduce the depletion through hybridization. This result is further confirmed by the calculation of the total and partial DOS of (FeO)4 and (FeO)6, (FeO)4− and (FeO)6−, (FeO)4+ and (FeO)6+ clusters, as plotted in Fig. S6–S8 (see ESI†).
Clusters | n | Q (Fe) | Q (O) | NEC (Fe) | NEC (O) |
---|---|---|---|---|---|
(FeO)n | 1 | 0.726 | −0.726 | 4s0.503d6.644p0.13 | 2s1.932p4.773p0.01 |
2 | 1.706 | −1.706 | 4s0.333d6.614p0.204d0.01 | 2s1.872p4.973p0.01 | |
3 | 2.663 | −2.663 | 4s0.31–0.383d6.46–6.564p0.24–0.264d0.01 | 2s1.84–1.852p5.01–5.053s0.013p0.01 | |
4 | 3.401 | −3.401 | 4s0.26–0.423d6.39–6.514p0.22–0.344d0.01–0.02 | 2s1.82–1.832p4.96–5.043p0.01 | |
5 | 3.965 | −3.965 | 4s0.20–0.423d6.39–6.624p0.27–0.394d0.025p0–0.01 | 2s1.80–1.822p4.87–5.143s0–0.013p0.01 | |
6 | 4.779 | −4.779 | 4s0.23–0.373d6.58–6.854p0.25–0.514d0.025p0–0.01 | 2s1.78–1.802p4.67–5.063s0–0.013p0–0.01 | |
7 | 5.581 | −5.581 | 4s0.23–0.363d6.48–6.674p0.22–0.494d0.02–0.045p0–0.01 | 2s1.77–1.802p4.90–5.053s0.013p0.01–0.02 | |
8 | 6.123 | −6.123 | 4s0.23–0.363d6.34–6.714p0.31–0.524d0.02–0.035p0–0.01 | 2s1.75–1.812p4.84–5.063s0.013p0–0.01 | |
(FeO)n− | 1 | −0.119 | −0.881 | 4s1.343d6.564p0.25s0.024d0.01 | 2s1.912p4.953p0.01 |
2 | 1.020 | −2.020 | 4s0.743d6.434p0.314d0.01 | 2s1.882p5.113s0.013p0.01 | |
3 | 1.867 | −2.867 | 4s0.36–0.483d6.61–6.654p0.27–0.304d0.01–0.02 | 2s1.832p5.10–5.123p0.02 | |
4 | 2.624 | −3.624 | 4s0.38–0.473d6.50–6.604p0.27–0.404d0.01–0.02 | 2s1.81–1.822p5.04–5.103p0.01–0.02 | |
5 | 3.210 | −4.210 | 4s0.21–0.463d6.44–6.664p0.30–0.444d0.02–0.035p0–0.01 | 2s1.79–1.812p4.95–5.163s0–0.013p0–0.02 | |
6 | 4.078 | −5.078 | 4s0.24–0.423d6.51–6.704p0.30–0.494d0.02–0.035p0–0.01 | 2s1.77–1.812p4.89–5.143s0–0.013p0.01–0.02 | |
7 | 4.634 | −5.634 | 4s0.26–0.383d6.43–6.734p0.26–0.524d0.02–0.045p0–0.01 | 2s1.75–1.812p4.94–5.103s0.01–0.023p0–0.01 | |
8 | 5.246 | −6.246 | 4s0.23–0.373d6.45–6.804p0.29–0.444d0.02–0.035p0–0.01 | 2s1.76–1.792p4.93–5.053s0.01–0.023p0–0.01 | |
(FeO)n+ | 1 | 1.415 | −0.415 | 4s0.273d6.264p0.064d0.01 | 2s1.962p4.443p0.01 |
2 | 2.687 | −1.687 | 4s0.193d6.324p0.144d0.01 | 2s1.902p4.923s0.013p0.01 | |
3 | 3.420 | −2.420 | 4s0.22–0.263d6.26–6.544p0.204d0.01 | 2s1.85–1.862p4.88–5.013s0.013p0.01 | |
4 | 4.150 | −3.150 | 4s0.19–0.353d6.29–6.464p0.20–0.344d0.01–0.02 | 2s1.83–1.842p4.86–5.133s0.013p0.01–0.02 | |
5 | 4.652 | −3.652 | 4s0.19–0.373d6.31–6.564p0.19–0.364d0.01–0.02 | 2s1.81–1.822p4.83–5.073s0.013p0.01 | |
6 | 5.285 | −4.258 | 4s0.20–0.373d6.35–6.654p0.19–0.444d0.01–0.035p0–0.01 | 2s1.80–1.832p4.76–5.073s0–0.013p0.01–0.02 | |
7 | 6.431 | −5.431 | 4s0.19–0.353d6.27–6.894p0.17–0.394d0.01–0.035p0–0.01 | 2s1.78–1.812p4.89–5.063s0.013p0.01–0.02 | |
8 | 7.045 | −6.045 | 4s0.19–0.373d6.44–6.584p0.27–0.404d0.02–0.035p0–0.01 | 2s1.77–1.812p4.77–5.063s0–0.023p0.01–0.02 |
It was mentioned above that (FeO)5 cluster has a larger magnetic moment. There is a need for an in-depth description of the structural information. In view of the intended assignment of the IR and Raman spectra, this is best done in relationship with its charged isomers (Fig. 8). It can be seen from Fig. 8 that the highest intense IR frequency of (FeO)5 cluster is found at 683 cm−1. It is assigned to the Fe–Fe bond in-plane wagging vibration. The two very close peaks at 643 cm−1 and 652 cm−1 correspond to the similar Fe–O bonds in (FeO)5 cluster. This IR property is quite different from those of the corresponding anionic and cationic species, in which the strongest peak exists at 632 cm−1 and 644 cm−1, respectively.
Raman activity mainly corresponds to the breathing modes and in these modes all the ions in clusters having high symmetry move together. Fig. S10† clearly shows that the neutral and charged (FeO)nμ clusters have similar Raman activities and the Raman peaks of the (FeO)nμ clusters are evenly distributed in the low frequency region (0–400 cm−1), implying that the Raman activity of the (FeO)nμ clusters are stronger in the low frequency band. As for (FeO)5μ clusters, the topmost intensity is the breathing mode of Fe atoms in the cluster. In this mode all O atoms remain static. Furthermore, it is worth noting that there are some more breathing modes present in Fig. 8(b), where all O atoms vibrate in the same phase and all Fe atoms are static. The intensities of these breathing modes are much less than the breathing mode of the Fe atoms.
Footnote |
† Electronic supplementary information (ESI) available: The calculated molecular orbital energy levels, density of states, infrared and Raman spectra, and coordinates of the low-lying structures for (FeO)nμ (n = 1–8, μ = 0, ±1) clusters. See DOI: 10.1039/c4ra12259c |
This journal is © The Royal Society of Chemistry 2015 |