Active phase of highly active Co3O4 catalyst for synthetic natural gas production
Baowei Wang*,
Sihan Liu,
Zongyuan Hu,
Zhenhua Li and
Xinbin Ma*
Tianjin University, Key Laboratory for Green Chemical Technology, School of Chemical Engineering Technology, No. 92, Weijin Road, Nankai District, Tianjin, China. E-mail: wangbw@tju.edu.cn
First published on 21st October 2014
Abstract
Co3O4 catalyst was studied with respect to methanation in synthetic natural gas (SNG) production. Nanosized Co3O4 particles were prepared using a facile precipitation method. The different chemical valence states of Co species were obtained by adopting various reduction processes prior to methanation. The physicochemical properties of the obtained catalysts were characterized by N2-physisorption, TPR, TEM, XRD, XPS and TG technologies. The catalytic activities for CO methanation were investigated over catalysts with different reduction treatments. The catalyst subjected to a mild reduction process with the appearance of CoO species immediately exhibited 100% conversion of CO with a high space velocity of 11![[thin space (1/6-em)]](https://www.rsc.org/images/entities/char_2009.gif) 500 mL g−1 h−1 at 300 °C, 3 MPa. The catalyst without reduction of Co3O4 achieved the same high activity after 3 h exposure to syngas. When Co oxides were fully reduced to metallic Co, they showed no activity for methanation. Combining the results of characterization with evaluation of catalytic performance, it can be concluded that CoO is the active phase for CO methanation. The reduction treatment can improve the stability of the catalyst.
500 mL g−1 h−1 at 300 °C, 3 MPa. The catalyst without reduction of Co3O4 achieved the same high activity after 3 h exposure to syngas. When Co oxides were fully reduced to metallic Co, they showed no activity for methanation. Combining the results of characterization with evaluation of catalytic performance, it can be concluded that CoO is the active phase for CO methanation. The reduction treatment can improve the stability of the catalyst.
1. Introduction
The production of synthetic natural gas (SNG) has been of worldwide interest due to its promising prospect of solving energy problems. It has a high conversion efficiency, and the existing gas distribution infrastructure could help to facilitate its convenient implementation. Coal can be converted into SNG by thermo-chemical processes. These consist of gasification, gas cleaning and conditioning, followed by methanation of syngas, and subsequent gas upgrading.1 With the exception of the methanation, other steps are not problematic due to already industrialized processes such as ammonia synthesis, etc.Therefore, the methanation step is limiting and has attracted great attention. It is a highly exothermic reaction:
| CO + 3H2 ↔ CH4 + H2O, ΔH0R = −206 kJ mol−1 |
From a thermodynamic point of view, methanation favors low temperature and high pressure. However, operating at high pressure generates a large amount of heat. Thus the methanation technologies of existing SNG processes incorporate a series of reactors to remove the heat by adding an intermediate or gas recycle cooling process.2 G. Alex Mills et al.3 concluded that CO methanation should be operated at the lowest temperatures that are consistent with acceptable catalyst activity, and with H2/CO ratios of or above 3. Therefore, research has long been focused on the development of catalysts that are both highly active at low temperature and stable at high temperature.
It is known that noble metals such as Pd, Rh, and Ru can catalyze methanation, exhibiting high activity at low temperature.1,4 Ni-based catalysts are commonly chosen for CO methanation due to their low cost, high catalytic activity and selectivity to methane. However, Ni-based catalysts are vulnerable to deactivation due to sintering and carbon deposition. CO dissociates quickly on Ni-based catalysts to form carbon intermediates, while the hydrogenation of those intermediates to generate CH4 is slow. Thus, carbon deposition leads to the deactivation of catalysts.4 It was previously considered that Co catalysts tended to deposit carbon more than nickel catalysts under the same operating conditions.3 However, in research of the CO methanation mechanism over impregnated Co/Al2O3 catalysts, the authors observed two steady-states for sulfur-free methanation over Co/Al2O3 catalysts. In the upper pseudo steady state, only very small amounts of carbon were observed on the catalysts surface.5
Nanostructures exhibit excellent properties in electronic, optical, mechanical, and catalysis fields. Nanosized Co3O4 is widely used in magnetism, photovoltaics, chemical sensors, and homogeneous catalysis. Large amounts of work has been done on the catalytic performance of nanosized Co3O4 catalysts in the low-temperature methanation of CO,6 Fischer–Tropsch (FT) synthesis,7,8 low temperature CO oxidation,9,10 selective reduction of nitrogen oxides,11 and oxidation of arene derivatives.12,13
Co3O4 is an important oxide with a spinel structure consisting of Co2+ in a tetrahedral coordination and Co3+ in an octahedral coordination, and O2− is cubic close packed. It has been demonstrated that metallic Co is the active phase for FT synthesis.8 While for low temperature CO oxidation, Xie et al.9 considered Co3+ as the only active site. Zhu’s group6 believed Co3+ and Co2+ were the active sites for CO methanation together. Saputra et al.13 thought Co3+ and Co2+ are active in generating hydroxyl radicals via a Fenton-like reaction for advanced oxidation processes. In the selective catalytic reduction of nitrogen oxides with ammonia, Meng et al.11 demonstrated that the high activity of Co3O4 results from the Co3+ species on the surface.
A lot of research has been focused on the preparation of different shapes of nano-Co3O4, including nanorods, nanoparticles, nanotubes, nanosheets, and nanowires.10,11,14,15 This research has shown great discrepancy in the catalytic activity of these different morphologies. Generally, Co3O4 nanorods exhibit superior performance in CO oxidation and NOx reduction, which can be attributed to the abundance of {110} planes that are present in Co3+ species. The conventional nanoparticles, in which the {001} and {111} planes are mainly exposed, contain only Co2+ sites on the surface, and appear to be less active in NOx reduction and inactive in CO oxidation.9,11 In formaldehyde oxidation, the Co3+ species on the {110} planes are also the active site.16 Hu et al. reported that {112} planes exhibit excellent activity for methane oxidation.17
It has been reported in the literature that a higher selectivity to CH4 was observed in FT synthesis when Co catalysts were partially reduced or when the catalysts contained smaller Co3O4 particles.6,7 Zhu et al.6 studied the size effects of Co3O4 nanoparticles for CO methanation in coke oven gas. It was found that a smaller particle size of 20 nm resulted in excellent performance with the H2/CO ratio being higher than 8.0. However, the use of nanosized Co3O4 for CO methanation in coal to SNG production, especially its preparation, structure and property in CO methanation, was not found in the open literature. Herein, we report the use of Co3O4 nanoparticles with high catalytic activity for CO methanation in coal to SNG production, with an H2/CO ratio of 3, low temperature of 300 °C, and high space velocity and pressure. It is demonstrated that CoO is the active phase for CO methanation through evaluating catalysts subjected to different degrees of reduction.
2. Experimental
2.1 Preparation of Co3O4
Nanosized Co3O4 was prepared via a precipitation method. Cobalt nitrate hexahydrate (Kemiou chemical reagent Co. Ltd., Tianjin) was dissolved in ethylene glycol, and the mixture was gradually heated to 160 °C. An aqueous solution of 0.2 M (NH4)2CO3 solution was then added dropwise. The slurry was stirred vigorously for 40 min with a continuous flow of nitrogen and then aged for 0.5 h. After filtration and washing with deionized water, the solid was dried at 50 °C overnight under vacuum, and calcined in air at 450 °C for 4 h. The catalyst for evaluation, which consists of Co3O4 and Al2O3, was then prepared by physical mixing. Typically, 1.3 g Co3O4 powder was diluted with 1.3 g Al2O3 powder. Thus approximately 2.6 g catalyst was used for each evaluation.2.2 Catalyst characterization
2.3 Catalyst reduction
To obtain different valence states of Co, the catalysts were subjected to different procedures of reduction prior to the methanation activity test. The catalyst (mixture of Co3O4 and Al2O3) without any reduction was referred as cat. 1. Correspondingly, catalysts reduced at 230 °C for 2 h and 450 °C for 4 h with an H2 flow rate of 100 mL min−1 were labelled as cat. 2 and cat. 3, respectively.2.4 Evaluation of catalytic activity
Catalytic activity tests were performed in a continuous flow fixed-bed reactor with a stainless steel tube (12 mm I.D. and 700 mm in length). The catalyst was sieved, in order to select particles in the size range 0.43–0.85 mm. The volume of each catalyst was 3.0 mL. The methanation reaction temperature and pressure were 300 °C and 3.0 MPa, respectively. A gas mixture containing 20% CO, 60% H2, and 20% N2 was continuously passed through the catalysts at a space velocity of 11![[thin space (1/6-em)]](https://www.rsc.org/images/entities/char_2009.gif) 500 mL g−1 h−1. The outlet gases were quantitatively analyzed by an online gas chromatograph (BEIFEN 3420A) equipped with a TCD and a FID. The conversion of CO and selectivity to CH4 were calculated using the following equations:
500 mL g−1 h−1. The outlet gases were quantitatively analyzed by an online gas chromatograph (BEIFEN 3420A) equipped with a TCD and a FID. The conversion of CO and selectivity to CH4 were calculated using the following equations:
 | (1) |
 | (2) |
 | (3) |
 | (4) |
 | (5) |
3. Results
3.1 Physicochemical properties of as-prepared nanosized Co3O4 sample
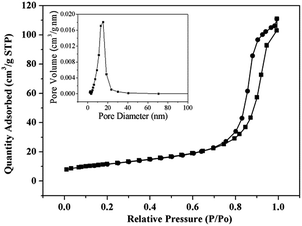
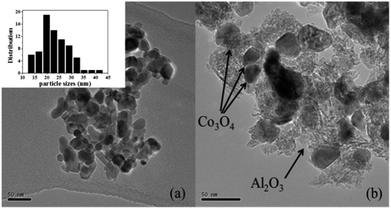
The BET specific surface area, pore volume and pore size of the as-prepared Co3O4 are listed in Table 1. The small BET surface area suggests that the as-prepared Co3O4 is a non-perforated material. Fig. 1 shows the N2 isothermal adsorption–desorption profiles and pore distribution curves of nanosized Co3O4. The hysteresis loop indicates the profile is of type IV (IUPAC), revealing the mesoporous structure of the Co3O4 sample. A TEM image of the fresh as-prepared Co3O4 is presented in Fig. 2(a). The Co3O4 particles generally possess rounded contours. It can be seen that the particle size of the nano-Co3O4 is around 20–30 nm.| Catalyst | SBET (m2 g−1) | VP (cm3 g−1) | DP (nm) |
|---|---|---|---|
| a SBET: BET specific surface area; VP: pore volume; DP: average pore diameter. | |||
| Co3O4 | 41.4 | 0.17 | 13.80 |
 | ||
| Fig. 2 TEM images of (a) nanosized Co3O4 and (b) catalyst of Co3O4 diluted with Al2O3 after 2 h reduction at 230 °C. | ||
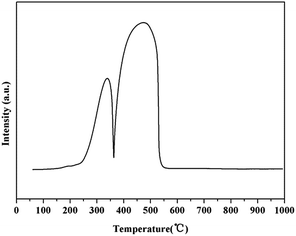
An H2-TPR profile of nanosized Co3O4 is shown in Fig. 3, in which two peaks can clearly be seen. The lower temperature peak at around 330 °C corresponds to the reduction of Co3+ to Co2+, and the higher temperature peak at 480 °C is ascribed to the reduction of Co2+ to Co0. The area of the lower temperature peak is much smaller than the higher one, which demonstrates that Co3+ is reduced at first, and then the produced Co2+ and the Co2+ in the catalyst itself are further reduced into metallic Co.16 According to this TPR profile, a reduction temperature of 450 °C was used in the experiment to attain metallic Co prior to the methanation reaction. To avoid excessive reduction, a temperature of 230 °C was adopted to obtain CoO from Co3O4.
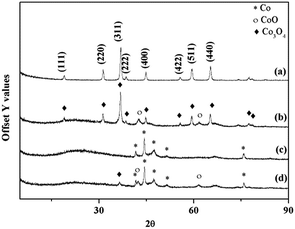
An XRD pattern of nano-Co3O4 is displayed in Fig. 4(a). The results can be perfectly indexed to Co3O4 in the cubic phase with a lattice constant a = 8.065 Å. No diffraction peaks related to impurities such as CoO are observed. Diffraction peaks at 19°, 31.3°, 36.9°, 38.6°, 44.8°, 55.6°, 59.5° and 65.3° (2θ) correspond to the {111}, {220}, {311}, {222}, {400}, {422}, {511} and {440} planes, respectively. Sharp peaks suggest that the sample has a good crystallinity, and is comprised of pure Co3O4 phase. The calculated crystallite size of Co3O4 using the most intense peak at 2θ = 36.9° ({311} plane) is 21 nm, which is consistent with the result of TEM analysis.
 | ||
| Fig. 4 XRD patterns of (a) nanosized Co3O4, (b) cat. 2 after reduction at 230 °C for 2 h, and (c) cat. 3 after reduction at 450 °C for 4 h, (d) cat. 1 before deactivation. | ||
3.2 Characterization of catalysts after reduction
After being subjected to the various reduction processes, the catalysts (mixtures of Co3O4 and Al2O3) were also characterized by XRD. The results of XRD are shown in Fig. 4(b) and (c), corresponding to cat. 2 and cat. 3, respectively. From Fig. 4(b), it can be observed that after reduction at 230 °C for 2 h, the diffraction peaks relating to CoO appear at 2θ = 42.6° and 61.7°, and intense peaks belonging to Co3O4 still exist. This indicates that Co3O4 was partially reduced to CoO after the reduction process. While, as presented in Fig. 4(c), after reduction at 450 °C for 4 h, the characteristic peaks of metallic Co are present. No peaks corresponding to CoO or Co3O4 can be detected, revealing the complete reduction of the Co oxides. Thus it can be inferred that the components of cat. 2 at the very beginning of the methanation reaction are CoO and Co3O4. While for cat. 3, metallic Co is the only form of Co species present. No obvious peaks of Al2O3 can be detected due to the superior crystallinity of metallic Co and Co oxides.Fig. 2(b) displays the TEM image of cat. 2 after the reduction period of 2 h at 230 °C. It can be clearly observed that the Co oxide particles are uniformly mixed with the Al2O3, and that the reduction treatment did not cause significant change to the Co oxide particles.
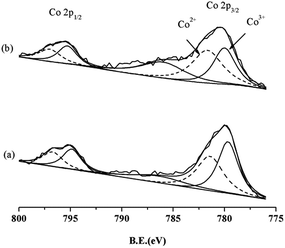
In addition, XPS analysis was used to evaluate the valence states of Co on the catalyst surface. Fig. 5 shows the deconvolution of Co 2p spectra for cat. 1 and cat. 2 before the methanation reaction. The deconvolution of Co is difficult because of the existence of satellite peaks.18 Co 2p3/2 has two components at B.E. = 779.6 and 781.4 eV, and Co 2p1/2 has two at B.E. = 794.9 and 796.7 eV, which correspond to Co3+ and Co2+ species, respectively.19 It can be calculated that the ratio of Co3+/Co2+ on the surface of cat. 1 is 1.18. After being reduced at 230 °C for 2 h, the ratio of Co3+/Co2+ decreases to 0.89 on the surface of cat. 2. This indicates that part of the surface Co3+ species are reduced to Co2+ after the mild reduction treatment, which is in agreement with the XRD results.
 | ||
| Fig. 5 XPS patterns of (a) cat. 1 without reduction and (b) cat. 2 after reduction at 230 °C for 2 h. | ||
3.3 Catalytic activity
The three catalysts prepared by different reduction processes were evaluated for use in the CO methanation reaction. The catalytic activities as a function of time on stream are shown in Fig. 6. Cat. 1 without prior reduction processing has an activation period of approximately 3 h. As the syngas used for methanation is reducible with 60 vol% H2, it is deduced that a reduction reaction is proceeding during this activation period. Therefore, when the reduction reaction reaches a certain degree, the catalyst becomes active for the methanation of CO and soon achieves 100% conversion of CO, the selectivity to methane being 82%. Cat. 2, which was subjected to a mild reduction treatment, shows excellent activity as soon as the syngas was introduced. This indicates that the mild reduction process prior to methanation can efficiently obtain the active phase for CO methanation. Cat. 3 was subjected to a strong reduction process at 450 °C for 4 h. The evaluation results show that it is inactive for the methanation reaction, revealing the absence of the active phase. To certify that the high activity of the catalyst originates from Co3O4, pure Al2O3 was also tested and showed no catalytic activity under the same conditions.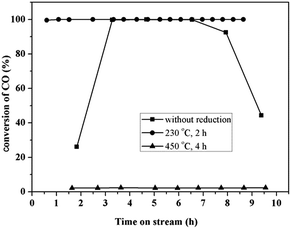 | ||
| Fig. 6 Catalytic performance with time on stream of catalysts after the different reduction treatments. | ||
Another observation can be made from Fig. 6. Cat. 1 (without reduction) was deactivated after being evaluated for 7 h, while cat. 2 retained its high activity with 100% conversion of CO throughout the evaluation period.
The selectivity of products was listed in Table 2. As cat. 3 exhibited no methanation activity, the selectivity of cat. 3 is not shown here. The displayed values are the average selectivity from 3 to 7 h on stream, during which time both catalysts performed excellently. It can be seen that cat. 1 had a higher selectivity to methane than cat. 2. This was because at a reaction temperature of 300 °C, the actual temperature on the catalyst surface can be much higher than 300 °C, which would lead to the reduction of Co2+ to metallic Co. While cat. 2 had undergone a pre-reduction treatment, the further reduction of Co species to metallic Co during methanation resulted in the lower selectivity to methane. On the other hand, the increased amount metallic Co contributes to the higher selectivity for long chain alkanes, as the observed selectivity to C2H6 revealed. The poor carbon balance of cat. 2 is due to the generation of C3+ hydrocarbons, which can also be attributed to the presence of metallic Co.
| Catalyst | SCH4 | SCO2 | SC2H6 | C balance |
|---|---|---|---|---|
| a Cat. 1: without reduction; cat. 2: reduced at 230 °C for 2 h. | ||||
| Cat. 1 | 86.22 | 10.34 | 1.84 | 1.59 |
| Cat. 2 | 81.16 | 7.21 | 3.95 | 7.68 |
However, Water Gas Shift (WGS) reaction also occurred on the catalysts surfaces, with higher selectivity to CH4 producing more H2O, thus promoting the WGS reaction as follows: CO + H2O ↔ CO2 + H2
Therefore, the selectivity to CO2 was higher for cat. 1 than for cat. 2, as shown in Table 2.
3.4 Characterization of catalysts after evaluation
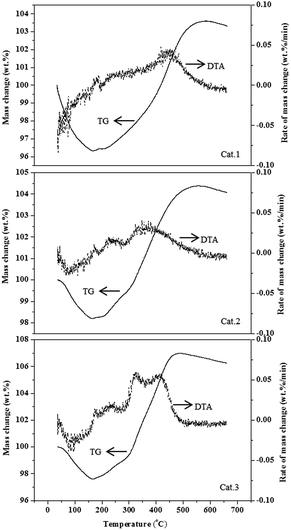
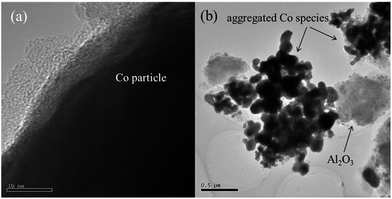
In order to study the deactivation of the catalysts, TEM and TG-DTA were used to characterize the catalysts after their evaluation in the CO methanation reaction. Fig. 7 shows the results of the TG-DTA analysis of the spent catalysts after 10 h on stream. The TG curves can be divided into three regions: temperatures below 180 °C, 180–500 °C, and above 500 °C. The mass loss below 180 °C is due to the removal of moisture. The mass gain from 180 °C to 500 °C is attributed to the oxidation of the reduced Co species. It can be deduced from the DTA results that this region includes two periods: temperatures from 180 to 300 °C in which the oxidation of metallic Co to CoO occurs, and temperatures from 300 to 500 °C in which the oxidation of CoO to Co3O4 is observed. The divided peaks of cat. 3 in the temperature range 300–500 °C may be due to the strong reduction of Co species at 450 °C, thus some metallic Co is difficult to be oxidized at lower temperature, and is oxidized during this period. The slight mass loss above 500 °C is ascribed to the minimal carbon deposition during methanation evaluation. Comparing the curves of the three catalysts, cat. 1 with a lower extent of reduction increases least in weight during the oxidation period in the second region, while cat. 3 which experienced a strong reduction exhibits the largest mass gain during the oxidation. The extent of reduction of the catalysts resulted in different amounts of reduced Co species (Co2+ and Co0), thus resulting in different increases in mass during the oxidation period, which was in reasonable agreement with the results of TG experiments. In the third region above 500 °C, the slight loss of mass indicates that there is a tiny amount of residual carbon on the catalysts’ surfaces. However, this mass loss is less than 1% for all of the spent catalysts, and the loss observed for cat. 3 is relatively larger. This is due to the absorbed CO having not been converted to hydrocarbons, and instead remaining on the catalyst surface.TEM images of cat. 1 after evaluation are presented in Fig. 8, and severe sintering of the catalyst can be seen in Fig. 8(b). It is obvious that Co species aggregated after the methanation reaction, however a closer observation of the catalyst surface in Fig. 8(a) revealed that no obvious carbon deposition occurred during methanation. This result is in good agreement with the TG result. Therefore, sintering may be the main reason for catalyst deactivation.
4. Discussion
4.1 Active phase of Co3O4 for methanation
It is generally accepted that the reduction of Co3O4 to metallic Co undergoes two periods, with an intermediate phase of CoO.7,19 Co3O4 is the active phase for CO oxidation, and metallic Co is the active phase for FT synthesis. Although CoO particles can easily exist at ambient room temperature and oxygen partial pressure, pure CoO is difficult to obtain by a simple chemical route, usually existing with a small amount of Co3O4 and Co metal.20In our experiment, cat. 1, without prior reduction treatment, remained in the Co3O4 form until the syngas was introduced. It did not show any activity after feeding in the syngas for 2 h, and it can therefore be deduced that Co3O4 is not the active phase of CO methanation. However, after 3 h evaluation with a flow of syngas, cat. 1 became highly active. It is believed that a sufficient amount of the active phase was generated after 3 h exposure to syngas, suggesting that the active phase is the reduced state of Co3O4.
While for cat. 3, having been subjected to a complete reduction treatment, Co oxide had been converted to metallic Co before the methanation reaction, as shown by the XRD results. As the atmosphere of the methanation reaction is reductive, the Co species of cat. 3 should remain as metallic Co for the duration of the methanation reaction. Obviously cat. 3 did not activate the methanation reaction throughout the whole evaluation period, thus it can be speculated that metallic Co is also not active for CO methanation.
For cat. 2, having been subjected to a mild reduction treatment, the CoO phase appeared after the reduction, as shown by the XRD and XPS results. It was observed to be active immediately that the syngas was introduced into the reactor. Therefore, it can be deduced that CoO is the active phase for CO methanation. To further prove this deduction, we took an evaluated cat. 1 before deactivation, which had experienced 4 h of evaluation, and characterized it by XRD as shown in Fig. 4(d). It can be observed that the Co species present on the active catalyst were Co3O4, CoO, and metallic Co. This clearly demonstrates that the catalyst reduction reaction from Co3O4 to Co occurs during the methanation reaction process. Combining the catalytic evaluation with characterization results, it is found that catalyst is only active when the CoO phase is present. Without CoO, neither Co3O4 nor metallic Co can catalyze the methanation reaction.
For CO oxidation, it is generally accepted that CO firstly adsorbs onto the surface Co3+, and then COads reacts with the oxygen species in Co3O4.9,21 According to the literature,9,11 the as-prepared Co3O4 nanoparticles have mainly exposed {001} and {111} planes with vast quantity of Co2+ on the surface. However, from our experiments, since Co3O4 is inactive at the initial stage, it can be deduced that Co2+ on the Co3O4 nanoparticles is inactive for methanation, while Co2+ on the CoO surface is highly active for the methanation reaction.
4.2 Mechanism of Co3O4 for methanation
Generally, there are two kinds of mechanisms proposed for CO methanation. The first is the “carbide mechanism” by Fischer and Tropsch: CO is first adsorbed on the catalysts surface and reduced to surface carbide CH2* by H2. The second is the “enolic complex” mechanism: adsorbed CO and H2 form an enolic complex first, then the complex is reduced by H2 to form CH2*.3,5 In spite of the discrepancy between the intermediates, both of the two mechanisms consider CO and H2 adsorption as the first step, then a surface intermediate is formed followed by reaction with H2 to generate CH4.Mills and Steffgen3 mentioned that part of the gas was irreversibly adsorbed on cobalt catalysts and this fraction did not participate in the formation of catalytic intermediates. We know from CO oxidation and other systems that Co3+ can adsorb CO. However, we consider that Co2+ on the CoO surface is active for the reaction of CO and H2 to generate CH4. Thus it can be deduced that the adsorbed CO on Co3+ species was irreversibly adsorbed and therefore unable to participate in the methanation reaction. This will then lead to a lower formation of active Co2+ sites for cat. 1. However, a mild reduction process with H2 prior to methanation could ensure that a sufficient amount of active Co2+ sites is generated. When feeding in the syngas, the abundant active Co2+ species immediately converted the adsorbed CO into methane. This cooperative effect can inhibit the loss of active sites on catalyst surface, thus effectively improving the stability of catalyst.
5. Conclusions
In this report, the Co3O4 nanoparticles showed high catalytic activity for low temperature CO methanation with an H2/CO ratio of 3, space velocity of 11![[thin space (1/6-em)]](https://www.rsc.org/images/entities/char_2009.gif) 500 mL g−1 h−1 and pressure of 3 MPa. By subjecting the catalysts to different reduction procedures prior to their use, different Co species with various phases were obtained before the methanation reaction. The above results and discussion indicate that the presence of the CoO phase in Co3O4 results in a high activity for CO methanation. The mild reduction treatment can also improve the stability of catalyst.
500 mL g−1 h−1 and pressure of 3 MPa. By subjecting the catalysts to different reduction procedures prior to their use, different Co species with various phases were obtained before the methanation reaction. The above results and discussion indicate that the presence of the CoO phase in Co3O4 results in a high activity for CO methanation. The mild reduction treatment can also improve the stability of catalyst.
Acknowledgements
The authors gratefully acknowledge the financial support from the Ministry of Science and Technology of the People’s Republic of China (Project 863-2015AAJY1602).Notes and references
- J. Kopyscinski, T. J. Schildhauer and S. M. A. Biollaz, Fuel, 2010, 89, 1763–1783 CrossRef CAS PubMed.
- A. Zhao, W. Ying, H. Zhang, H. Ma and D. Fang, Catal. Commun., 2012, 17, 34–38 CrossRef CAS PubMed.
- G. A. Mills and F. W. Steffgen, Catal. Rev. Sci. Technol., 1974, 8, 159–210 CrossRef.
- X. Yan, Y. Liu, B. Zhao, Z. Wang, Y. Wang and C. J. Liu, Int. J. Hydrogen Energy, 2013, 38, 2283–2291 CrossRef CAS PubMed.
- P. K. Agrawai, J. R. Katzer and W. H. Manogue, Ind. Eng. Chem. Fundam., 1982, 21, 385–390 Search PubMed.
- H. Zhu, R. Razzaq, L. Jiang and C. Li, Catal. Commun., 2012, 23, 43–47 CrossRef CAS PubMed.
- C. Ahn, H. M. Koo, M. Jin, J. M. Kim, T. Kim, Y. W. Suh, K. J. Yoon and J. W. Bae, Microporous Mesoporous Mater., 2014, 188, 196–202 CrossRef CAS PubMed.
- G. L. Bezemer, J. H. Bitter, H. P. C. E. Kuipers, H. Oosterbeek, J. E. Holewijn, X. D. Xu, F. Kapteijn, A. J. V. Dillen and K. P. D. Jong, J. Am. Chem. Soc., 2006, 128, 3956–3964 CrossRef CAS PubMed.
- X. Xie, Y. Li, Z. Q. Liu, M. Haruta and W. Shen, Nature, 2009, 458, 746–749 CrossRef CAS PubMed.
- C. Liu, Q. Liu, L. Bai, A. Dong, G. Liu and S. Wen, J. Mol. Catal. A: Chem., 2013, 370, 1–6 CrossRef CAS PubMed.
- B. Meng, Z. Zhao, X. Wang, J. Liang and J. Qiu, Appl. Catal., B, 2013, 129, 491–500 CrossRef CAS PubMed.
- D. Qiao, C. Xu and J. Xu, Catal. Commun., 2014, 45, 44–48 CrossRef CAS PubMed.
- E. Saputra, S. Muhammad, H. Sun, H. M. Ang, M. O. Tade and S. Wang, J. Colloid Interface Sci., 2013, 407, 467–473 CrossRef CAS PubMed.
- Y. Lv, Y. Li and W. Shen, Catal. Commun., 2013, 42, 116–120 CrossRef CAS PubMed.
- K. S. Hui, K. N. Hui, C. L. Yin and X. Hong, Mater. Lett., 2013, 97, 154–157 CrossRef CAS PubMed.
- Q. Yan, X. Li, Q. Zhao and G. Chen, J. Hazard. Mater., 2012, 209–210, 385–391 CrossRef CAS PubMed.
- C. Ma, D. Wang, W. Xue, B. Dou, H. Wang and Z. Hao, Environ. Sci. Technol., 2011, 45, 3628–3634 CrossRef CAS PubMed.
- D. Laurenti, B. Phung-Ngoc, C. Roukoss, E. Devers, K. Marchand, L. Massin, L. Lemaitre, C. Legens, A.-A. Quoineaud and M. Vrinat, J. Catal., 2013, 297, 165–175 CrossRef CAS PubMed.
- B. Bai, H. Arandiyan and J. Li, Appl. Catal., B, 2013, 142–143, 677–683 CrossRef CAS PubMed.
- Q. S. Guo, X. Y. Guo and Q. H. Tian, Adv. Powder Technol., 2010, 21, 529–533 CrossRef CAS PubMed.
- H. F. Wang, R. Kavanagh, Y. L. Guo, Y. Guo, G. Z. Lu and P. Hu, Angew. Chem., Int. Ed., 2012, 51, 6657–6661 CrossRef CAS PubMed.
| This journal is © The Royal Society of Chemistry 2014 |

