Integration of ZnO/ZnS nanostructured materials into a cotton fabric platform†
Thushara J. Athauda,
Ujith S. K. Madduma-Bandarage and
Yolanda Vasquez*
Department of Chemistry, Oklahoma State University, 107 Physical Sciences 1, Stillwater, OK 74078, USA. E-mail: yolanda.vasquez@okstate.edu
First published on 6th November 2014
Abstract
Inorganic semiconductor nanostructures coupled to flexible substrates such as natural and synthetic fibrous materials have been studied for a wide range of potential applications that include wearable electronics, protective textiles, portable and flexible photovoltaic and solar cell devices. Here, we report the fabrication of ZnO/ZnS core–shell nanorod arrays on a cotton platform via a simple, low-temperature hydrothermal growth technique. ZnO nanorods were converted to ZnO/ZnS core–shell nanorod arrays through a mild sulfidation process with sodium sulfide. TEM, XRD, and XPS were used to characterize the nanorods to reveal a highly crystalline ZnO core with a polycrystalline ZnS shell. Photoluminescence measurements demonstrate a remarkably large UV emission for the ZnO/ZnS nanorod arrays on cotton. Such materials are anticipated to be useful for wearable, portable electronic devices and as protective textiles.
Introduction
Wearable, stretchable electronics have garnered significant attention as the demand for portable consumer electronic devices increases. Inorganic semiconductor nanostructures on both flexible substrates such as natural and synthetic fibrous materials and rigid materials such as ITO, glass, and silicon wafers have been studied for a wide range of novel applications such as, UV photodetectors,1,2 photocatalysis,3 solar cells,4 nanogenerators,5,6 piezoelectric devices,7 sensors,8,9 nanoscale lasers,10 field emitters,11 optoelectronic devices,12 and protective,13 and biocidal garments.14 Traditional materials like silicon wafers, glass, and ITO, however, are brittle and rigid. The allure of fibrous materials is that they not only bend but also stretch, compress, twist, and deform into complex, curvilinear shapes while maintaining high levels of performance.15 Integration of semiconductor heterostructures, such as core–shell architectures,16,17 superlattices,18,19 and biaxial nanostructures,10,20 on flexible fibrous materials with a low-cost method is crucial for the development of functional devices and the realization of variety of wearable electronics, protective textiles, portable and flexible photovoltaic and solar cell devices.Currently, progress has been made on the synthesis of inorganic semiconductor nanostructures on flexible substrates such as plastics,21 paper,22 epoxy surfaces,23 electrospun fibers,24–27 and fabrics with a myriad of applications.13,28,29 For instance, Guo et al. have reported a technique to grow ZnO nanowires on electrospun NiO fibers with excellent UV-photosensing properties.24 Wang and co-workers have investigated a novel stretchable strain sensor based on a ZnO/polystyrene hybrid nanostructure on a polydimethylsiloxane (PDMS) film.9 ZnO nanowires on carbon fibers have also been reported as an anode material in flexible dye-sensitized solar cells.4
For natural and synthetic fibrous materials, the inorganic structure integrated onto the fiber and physical structure of the fiber surface are the key factors for device functionality and performance.30–32 A number of advantages can be offered for heterostructures such as ZnO/ZnS architectures including superior optoelectronic properties due to type-II band alignment at the interface of the two different materials.33 Both ZnO and ZnS are important II–VI semiconductors with wide band-gaps of 3.37 and 3.67 eV, with prominent applications in flat-panel displays,34 sensors,8,9 lasers,10 electroluminescent devices,3,4 photocatalysis,3 and non-linear optical devices.35,36 Importantly, the piezoelectric properties of ZnO/ZnS nanowire arrays have recently been exploited to produce nanogenerators capable of converting mechanical energy into electricity, a desirable property for wearable, portable electronic devices.5,6
In this paper, we report the growth of ZnS polycrystalline shells onto vertically oriented ZnO nanorod arrays to form ZnO/ZnS core–shell nanorods on a cotton surface via a simple sulfidation technique. This process involves treatment of the cotton substrate with ZnO nanocrystals that form nucleation sites for subsequent anisotropic growth of single crystalline ZnO nanorods by incubation in a growth solution. The thickness of the ZnS shell of the core–shell nanorods can be easily tuned by controlling the reaction time between sodium sulfide and the ZnO nanorods. The morphology, composition, crystal structure, and optical properties of the ZnO/ZnS core–shell hetero structures were systematically investigated.
Results and discussion
Arrays of ZnO nanorods which are stable under harsh washing conditions were synthesized on the cotton substrate by a simple two-step hydrothermal growth technique according to a previously published procedure (see Experimental section).28 The hydrothermal growth technique involves a seeding step where ZnO nanocrystals act as nucleation sites on the surface of the treated cotton. Subsequently, the growth of the ZnO nanoparticles into nanorods is carried out in an equimolar aqueous solution of zinc nitrate hexahydrate and hexamethylenetetramine,28 a weak base, which slowly hydrolyzes in water to produce ammonia (eqn (1)). Ammonia is then hydrolyzed (eqn (2)) to give hydroxide ions that react with the Zn2+ released from zinc nitrate hexahydrate to yield Zn(OH)2. Under mild heating (80–95 °C), Zn(OH)2 is converted into ZnO solid crystals that coalesce during the growth process to give highly crystalline ZnO nanorods (eqn (3) and (4)).37,38| (CH2)6N4(s) + 6H2O(l) → 6HCHO(aq) + 4NH3(g) | (1) |
| NH3(g) + H2O(l) → NH4+(aq) + OH−(aq) | (2) |
| Zn2+(aq) + 2OH−(aq) → Zn(OH)2(aq) | (3) |
| Zn(OH)2(aq) → ZnO(s) + H2O(l) | (4) |
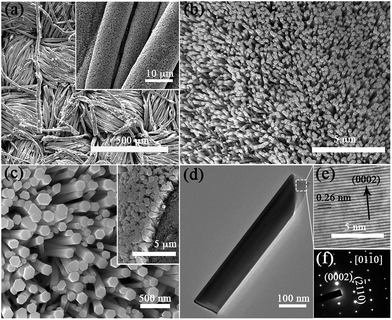
The ZnO nanorods are grown on a woven cotton fabric that consists of parallel sets of micrometer-scale fibers that intersect orthogonally in the weave structure. Cellulosic cotton consists of hollow cylinders with a diameter between 12 and 22 μm.30 Fig. 1a–c show SEM images of cellulose fibers modified with ZnO nanorods and individual hollow fibers whose surface is covered with the ZnO nanorods. Cross-sectional SEM images of the nanorod arrays vertically oriented on the cellulose fibers can be seen in Fig. 1c. The densely packed nanorods exhibit a hexagonal morphology with an average diameter of 163.11 ± 11 nm and length of 1.23 ± 0.12 μm. It must be noted, however, that small variations in the sizes of the ZnO nanorods can occur since the weave structure of the cotton surface can limit diffusion of the reactive species. Fig. 1d–f show representative TEM images and a selected area electron diffraction (SAED) pattern of ZnO nanorods. The lattice spacing was found to be approximately 0.26 nm, which corresponds to the (0002) plane of the hexagonal Wurtzite-type ZnO phase (WZ, P63mc). The SAED pattern taken from an individual ZnO nanorod demonstrates that the rods are high quality and single-crystalline in nature (Fig. 1f), with some rods showing twinning defects (Fig. 1c).
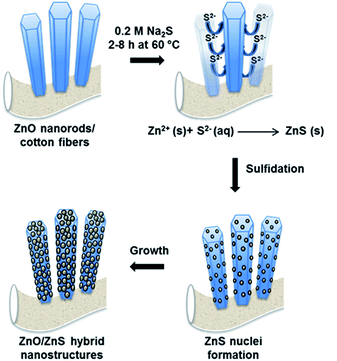
ZnO nanorods were converted into ZnO/ZnS core–shell nanorods by reacting the ZnO functionalized cotton fibers with an aqueous sodium sulfide solution at 60 °C for 2 to 8 h (Scheme 1). During the sulfidation process, sodium sulfide hydrolyzes in the aqueous solution to produce sulfide ions (S2−) at 60 °C that then react with the Zn2+ ions from the outer surface of ZnO nanorod to form ZnS nanoparticles according to eqn (5).33,39–42
| Zn2+(aq) + S2−(aq) → ZnS(s) | (5) |
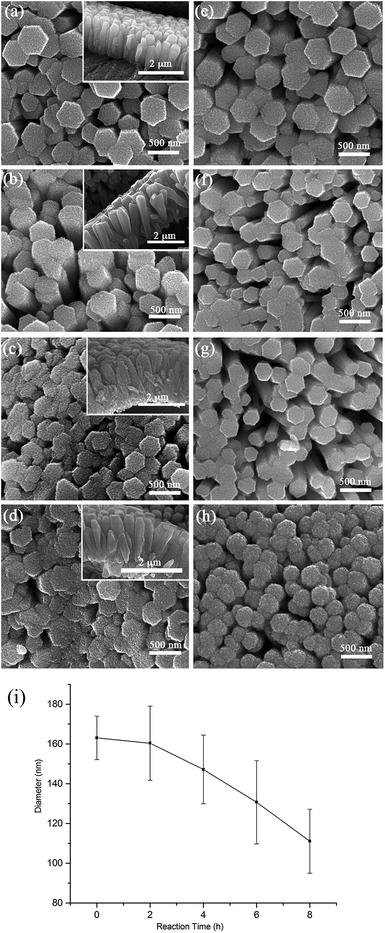
Fig. 2 shows SEM images of ZnO nanorods immersed in the sodium sulfide solution at varying time intervals. The sulfidation process results in the formation of ZnS nanocrystals at the surface of the ZnO nanorods. The ZnO/ZnS core–shell hybrid nanorods maintain the original hexagonal morphology of the ZnO nanorods; however, the surface becomes rough as the polycrystalline ZnS nanoparticle aggregates form a shell on the ZnO nanorods. This is especially evident as the sulfidation process time is increased from 2 to 8 h (Fig. 2).
Importantly, two competing factors occur in the deposition of the ZnS layer. Initially, sulfide deposition results in an increase in the thickness of the nanorod core–shell structure. At the same time, an overall decrease in the diameter of the ZnO/ZnS nanorods occurs as some ZnS particles may ultimately break away. The sulfide ions first react with Zn2+ ions to form the ZnS shell, which results in an overall increase in the size of the ZnO/ZnS core–shell nanostructure. However, as sulfidation time increases ion exchange between S2− and O2− results in the formation of nanoparticles at the surface that break away, which decreases the overall size of the ZnO/ZnS structure.41,42 We believe that there is a competition between the outward diffusion of Zn2+ and inward diffusion of S2− to form ZnS. This mechanism has also been described by Dawood and Neveux.41,42
In order to increase the grain size of the ZnS nanoparticles and ensure a robust ZnS shell, heat treatment of the ZnO/ZnS cotton samples was performed in an oven at 120 °C for 2 h (post sulfidation). SEM images of the heated samples show an increase in the grain size of the ZnS shell, while retaining the hexagonal morphology of the ZnO template (Fig. 2e–h). At longer sulfidation times, the morphology of the nanorods changes somewhat as the vertices of the hexagonal ZnO/ZnS nanostructures become rounded (Fig. 2h). The core–shell structures noticeably decrease in size from 163 ± 10.9 nm to 111 ± 16.1 nm with increased sulfidation time (Fig. 2i).
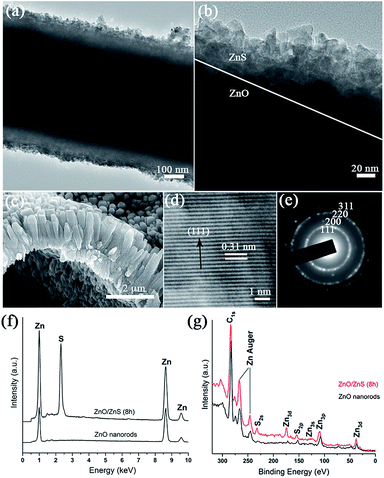
Fig. 3a and b show representative TEM images of the ZnS nanoparticle coating on the ZnO nanorod surface. ZnS nanoparticles are approximately 15–20 nm and well distributed on the surface of ZnO nanorods. Fig. 3c shows a cross-sectional view of ZnO/ZnS core–shell structures (8 h treatment), with uniform ZnS layer throughout the length of the nanorods. The lattice spacing is about 0.31 nm (Fig. 3d), which corresponds the (111) plane of the cubic ZnS structure (ZB, F![[4 with combining macron]](https://www.rsc.org/images/entities/char_0034_0304.gif) 3m). The indexed SAED pattern corresponds to polycrystalline ZnS with reflections assigned to the (111), (200), (220), and (311) planes of cubic ZB-type ZnS (Fig. 3e).
3m). The indexed SAED pattern corresponds to polycrystalline ZnS with reflections assigned to the (111), (200), (220), and (311) planes of cubic ZB-type ZnS (Fig. 3e).
Elemental analysis of the ZnO/ZnS core–shell structures was carried out using Energy Dispersive X-ray (EDX) spectroscopy. For clarity, only representative EDX spectra of the ZnO nanorods and ZnS/ZnO core–shell structures produced after treatment with Na2S for 8 h are presented (Fig. 3f, see ESI†). EDX analysis of ZnO nanorod modified cotton revealed only a Zn peak. An atomic ratio of about 79![[thin space (1/6-em)]](https://www.rsc.org/images/entities/char_2009.gif) :
:![[thin space (1/6-em)]](https://www.rsc.org/images/entities/char_2009.gif) 21 of zinc to sulfur was found for the ZnS/ZnO core–shell structures; providing evidence that sulfur was indeed incorporated to produce a ZnS shell on the ZnO nanorods. XPS measurements were performed on ZnO/cotton samples, and on ZnO/ZnS/cotton samples treated for 8 h (Fig. 3g). The two peaks located approximately at 159 eV and 233 eV correspond to the Sulfur S2p and S2s peaks, respectively, and are attributed to Zn–S bonding in the ZnO/ZnS/cotton samples.43,44 Taken together, the SAED, EDX, and XPS provide strong evidence that the ZnS shell was successfully synthesized through the chemical conversion process.
21 of zinc to sulfur was found for the ZnS/ZnO core–shell structures; providing evidence that sulfur was indeed incorporated to produce a ZnS shell on the ZnO nanorods. XPS measurements were performed on ZnO/cotton samples, and on ZnO/ZnS/cotton samples treated for 8 h (Fig. 3g). The two peaks located approximately at 159 eV and 233 eV correspond to the Sulfur S2p and S2s peaks, respectively, and are attributed to Zn–S bonding in the ZnO/ZnS/cotton samples.43,44 Taken together, the SAED, EDX, and XPS provide strong evidence that the ZnS shell was successfully synthesized through the chemical conversion process.
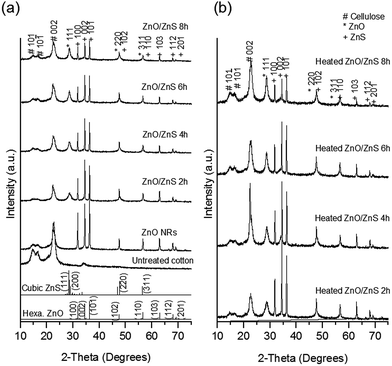
XRD patterns of nanorod modified samples before and after heating at 120 °C for 2 h are presented in Fig. 4a and b. The XRD peaks at 2θ values of 13.8°, 16.3°, and 22.9° correspond to (101), (10![[1 with combining macron]](https://www.rsc.org/images/entities/char_0031_0304.gif) ), (002) planes, respectively, of the cotton fiber (cellulose I structure) (JCPDS. no. 03-0226).28 Diffraction peaks at 31.8° (100), 34.4° (002), 36.3° (101), 47.5° (102), 56.6° (110), 62.9° (103), 68.0° (112), 69.1° (201), 79.9° (202) correspond to the hexagonal-WZ type ZnO with lattice constants of a = 3.250 Å and c = 5.207 Å (JCPDS no. 01-089-7102). The strong and sharp (002) diffraction peak indicates preferential growth along the c-axis for the ZnO nanorods. No observable crystalline impurities are detected for ZnO nanorods grown on the cotton substrate.
), (002) planes, respectively, of the cotton fiber (cellulose I structure) (JCPDS. no. 03-0226).28 Diffraction peaks at 31.8° (100), 34.4° (002), 36.3° (101), 47.5° (102), 56.6° (110), 62.9° (103), 68.0° (112), 69.1° (201), 79.9° (202) correspond to the hexagonal-WZ type ZnO with lattice constants of a = 3.250 Å and c = 5.207 Å (JCPDS no. 01-089-7102). The strong and sharp (002) diffraction peak indicates preferential growth along the c-axis for the ZnO nanorods. No observable crystalline impurities are detected for ZnO nanorods grown on the cotton substrate.
XRD patterns of the ZnO and ZnO/ZnS core–shell nanostructures, obtained by varying the sulfidation reaction time are shown in Fig. 4a. ZnO/ZnS core–shell structures exhibit strong diffraction from ZnO. Only the (111) peak of ZnS is evident, since the (220) and (311) peaks of Zinc-Blende (ZB) type ZnS (JCPDS no. 01-089-2422; a = 5.318 Å) overlap with the (102) and (110) diffraction peaks of Wurtzite type ZnO.
The intensity of the ZnS (111) peak increases with reaction time, which indicates an increase in the crystallite size. The diffraction intensities of ZnO crystal planes decrease with sulfidation as a result of the conversion of ZnO to ZnS.
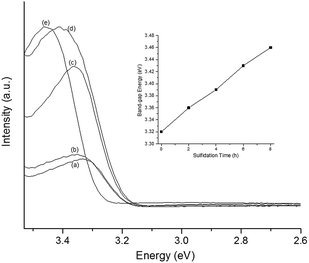
The optical properties of ZnO nanorods and ZnO/ZnS core–shell nanostructures were investigated using photoluminescence (PL) measurements under a 325 nm excitation light source over a wavelength range of 350–800 nm and at room temperature (Fig. 5). PL spectra of the ZnO nanorods shows a strong UV near band-edge emission in the range of 3.2–3.4 eV, that has been attributed to excitonic recombination of charge carriers between the conduction and valence bands of the ZnO crystal.28,45,46 The ZnO/ZnS core–shell nanostructures exhibit enhanced UV emission with increased sulfidation time when compared to ZnO nanorods alone. This is consistent with other reports of ZnO/ZnS heterostructures.28,45,47 The calculated band gap of ZnO nanorods is 3.32 eV while ZnS coated ZnO nanostructures show 3.36, 3.39, 3.43, and 3.46 eV for 2, 4, 6, and 8 h treated samples, respectively (Fig. 5).
Conclusions
ZnO nanorods were used as a template to generate ZnO/ZnS core–shell nanorod arrays on flexible cotton platform via a simple sulfidation strategy. This optimized growth technique is straightforward, cost-effective, environmentally benign, reproducible, and scalable. The presence of a uniform ZnS shell around the ZnO nanorod enhances the UV emission, which results in a blue-shift in the optical spectrum as compared to the ZnO nanorods alone. The ZnO/ZnS core–shell structures, specifically, can find potential applications in UV-sensing on cotton materials. Furthermore, nanoarchitectures are a stepping-stone towards producing wearable, flexible electronic devices.Experimental
Materials
Bleached, desized cotton fabric (#400) was purchased from TestFabrics (West Pittston, PA). Zinc acetate dihydrate (Zn(CH3COO)2·2H2O, ACS reagent, ≥98%), triethylamine ((C2H5)3N ≥ 99.0%), ethanol (CH3CH2OH, ACS reagent, ≥99.5% (200 proof), absolute), isopropanol (C3H8O, anhydrous, 99.0%), sodium hydroxide (NaOH, ACS reagent, ≥97.0%, pellets), Triton X-100, zinc nitrate hexahydrate (Zn(NO3)2·6H2O, reagent grade 98%), and hexamethylenetetramine (C6H12N4, ACS reagent, ≥99.5%) were purchased from Sigma-Aldrich. Citric acid (C6H8O7, ACS reagent, ≥99.0%) was purchased from Spectrum Chemical Mfg. Corp. Sodium sulfide (Na2S·9H2O, hydrated) was purchased from Fisher Science Education. All chemicals were used as purchased with no further purification.Scouring of cotton fabric
The cotton scouring solution was prepared by dissolving 2.50 g of NaOH, 0.75 g of Triton X-100, and 0.38 g of citric acid in 250 mL of high purity nanopure water (18 MΩ cm−1). Five cotton swatches (6 cm × 6 cm) were placed in a 500 mL round-bottom flask containing 250 mL of the scouring solution. The mixture was stirred at 100 °C for 1 h. The scoured swatches were removed from the solution, rinsed thoroughly with high purity water (18 MΩ cm−1), and dried under ambient conditions.Preparation of ZnO seed solution
First, 50 mM solution of Zn(CH3COO)2·2H2O was prepared by dissolving 0.55 g in 50.0 mL of isopropanol. The resulting solution was stirred (300 rpm) vigorously at 85 °C for 20 min. Then, 349 μL of triethylamine was added drop-wise to the solution and stirred at 85 °C for an additional 15 min. The final solution was allowed to cool to room temperature.Preparation of ZnO growth solution
First, a 100 mM solution of hexamethylenetetramine was prepared by dissolving 9.81 g in 700 mL of high purity water (18 MΩ cm−1). Once dissolved, 20.8 g of Zn(NO3)2·6H2O was added and the resulting solution was stirred for 24 h at room temperature. ZnO growth solution was filtered (Whatman®, 150 mm) prior to use.Hydrothermal growth of ZnO nanorod arrays
The scoured cotton swatches were dip-coated into the 50 mM ZnO seed solution for 5 min, rinsed with ethanol, then suspended from a wire rack, and cured at 120 °C for 1 h in a convection oven (BINDER Inc.). To ensure uniform deposition of ZnO nanowires on cotton surfaces in subsequent steps, the swatches were then immobilized on a glass piece (2.5 cm × 1.5 cm) using epoxy glue (LOCTITE stik'n seal ultra, Flextec Technology). The immobilized swatches were suspended vertically in 70 mL of the growth solution by affixing a piece of copper wire to the back of the glass slide in an amber jar (Jar Short Amber WM, Thermo Fisher Scientific) during growth process and incubated at 95 °C for 8 h in an oven. The container was removed from the oven, cooled to room temperature, and the swatches were thoroughly rinsed with high purity water (18 MΩ cm−1), and allowed to air-dry at room temperature.Synthesis of ZnO/ZnS core–shell nanostructures
ZnO nanorod modified cotton samples were immersed vertically in a 0.20 M Na2S·9H2O solution at 60 °C for 2–8 h. After that, the samples were rinsed with high purity water (18 MΩ cm−1) and allowed to air-dry at room temperature.Characterization
The morphology of the ZnO nanorods and ZnO/ZnS core–shell nanorods modified cotton samples were analyzed using a FEI Quanta 600 FE-ESEM scanning electron microscope equipped with EDAX TEAM system. The samples were coated with 5–10 nm Pt/Au layer for SEM imaging. TEM images were acquired on a JEOL-JEM TEM operating at 200 kV. Crystal structures were analyzed by X-ray diffraction using a Bruker D8-A25-ADVANCE X-ray diffractometer with Cu Kα radiation, employing a scanning rate of 0.02° s−1 within the range of 2θ = 10–75°, operating at 40 kV and 40 mA. Photoluminescence (PL) studies were performed at room temperature using a dual-scanning microplate Fluorolog-3 Spectrofluorimeter using the excitation wavelength at 325 nm. UV-absorbance of the samples was studied using a Varian Cary 50 UV-Vis Spectrophotometer in the wavelength range of 280–580 nm and a scan rate of 300 nm min−1.Acknowledgements
Financial support from OSU Start-up funds is gratefully acknowledged. Parts of this work were carried out in the Microscopy Laboratory, Oklahoma State University, which received funds for purchasing the equipment from the NSF MRI program. Prof. E. Yukihara, B. Doull, and A. Foiez are acknowledged for technical assistance with XRD and PL. Prof. N. Materer is acknowledged for XPS measurements.Notes and references
- L. Hu, J. Yan, M. Liao, H. Xiang, X. Gong, L. Zhang and X. Fang, Adv. Mater., 2012, 24, 2305–2309 CrossRef CAS PubMed.
- Y. Li, J. Gong and Y. Deng, Sens. Actuators, A, 2010, 158, 176–182 CrossRef CAS PubMed.
- T. J. Athauda, U. Butt and R. R. Ozer, RSC Adv., 2013, 3, 21431–21438 RSC.
- H. E. Unalan, D. Wei, K. Suzuki, S. Dalal, P. Hiralal, H. Matsumoto, S. Imaizumi, M. Minagawa, A. Tanioka and A. J. Flewitt, Appl. Phys. Lett., 2008, 93, 133116 CrossRef PubMed.
- M. Lu, J. Song, M. Lu, C. Lee, L. Chen and Z. L. Wang, ACS Nano, 2009, 3, 357–362 CrossRef CAS PubMed.
- Z. L. Wang and J. Song, Science, 2006, 312, 242–246 CrossRef CAS PubMed.
- W. Liu, N. Wang, R. Wang, S. Kumar, G. S. Duesberg, H. Zhang and K. Sun, Nano Lett., 2011, 11, 2983–2988 CrossRef CAS PubMed.
- X. Fang, Y. Bando, M. Liao, U. K. Gautam, C. Zhi, B. Dierre, B. Liu, T. Zhai, T. Sekiguchi and Y. Koide, Adv. Mater., 2009, 21, 2034–2039 CrossRef CAS.
- X. Xiao, L. Yuan, J. Zhong, T. Ding, Y. Liu, Z. Cai, Y. Rong, H. Han, J. Zhou and Z. L. Wang, Adv. Mater., 2011, 23, 5440–5444 CrossRef CAS PubMed.
- J. Yan, X. Fang, L. Zhang, Y. Bando, U. K. Gautam, B. Dierre, T. Sekiguchi and D. Golberg, Nano Lett., 2008, 8, 2794–2799 CrossRef CAS PubMed.
- X. S. Fang, Y. Bando, G. Z. Shen, C. H. Ye, U. K. Gautam, P. M. F. J. Costa, C. Y. Zhi, C. C. Tang and D. Golberg, Adv. Mater., 2007, 19, 2593–2596 CrossRef CAS.
- X. Fang, L. Wu and L. Hu, Adv. Mater., 2011, 23, 585–598 CrossRef CAS PubMed.
- T. J. Athauda, W. S. LePage, J. M. Chalker and R. R. Ozer, RSC Adv., 2014, 4, 14582–14585 RSC.
- T. J. Athauda, R. R. Ozer and J. M. Chalker, RSC Adv., 2013, 3, 10662–10665 RSC.
- J. Rogers, T. Someya and Y. Huang, Science, 2010, 327, 1603–1607 CrossRef CAS PubMed.
- X. Wu, P. Jiang, Y. Ding, W. Cai, S. Xie and Z. L. Wang, Adv. Mater., 2007, 19, 2319–2323 CrossRef CAS.
- L. Lauhon, M. Gudiksen, D. Wang and C. Lieber, Nature, 2002, 420, 57–61 CrossRef CAS PubMed.
- X. Fang, Y. Bando, U. K. Gautam, T. Zhai, S. Gradečak and D. Golberg, J. Mater. Chem., 2009, 19, 5683–5689 RSC.
- R. D. Robinson, B. Sadtler, D. O. Demchenko, C. K. Erdonmez, L. W. Wang and P. Alivisatos, Science, 2007, 317, 355–358 CrossRef CAS PubMed.
- X. Fan, M. L. Zhang, I. Shafiq, W. J. Zhang, C. S. Lee and S. T. Lee, Adv. Mater, 2009, 21, 2393–2396 CrossRef CAS.
- J. Rogers, T. Someya and Y. Huang, Science, 2010, 327, 1603–1607 CrossRef CAS PubMed.
- M. Lee, G. Kwak and K. Yong, ACS Appl. Mater. Interfaces, 2011, 3, 3350–3356 CAS.
- Y. Vasquez, E. M. Fenton, V. F. Chernow and J. Aizenberg, CrystEngComm, 2011, 13, 1077–1080 RSC.
- T. Guo, Y. Luo, Y. Zhang, Y. H. Lin and C. W. Nan, Cryst. Growth Des., 2014, 14, 2329–2334 CAS.
- T. J. Athauda, J. G. Neff, L. Sutherlin, U. Butt and R. R. Ozer, ACS Appl. Mater. Interfaces, 2012, 4, 6917–6926 CAS.
- T. J. Athauda, U. Butt and R. R. Ozer, MRS Commun., 2013, 3, 51–55 CrossRef CAS.
- T. J. Athauda, U. Butt and R. R. Ozer, RSC Adv, 2013, 3, 21431–21438 RSC.
- T. J. Athauda, P. Hari and R. R. Ozer, ACS Appl. Mater. Interfaces, 2013, 5, 6237–6246 CAS.
- T. J. Athauda and R. R. Ozer, Cryst. Growth Des., 2013, 13, 2680–2686 CAS.
- J. S. Jur, W. J. Sweet, C. J. Oldham and G. N. Parsons, Adv. Funct. Mater., 2011, 21, 1993–2002 CrossRef CAS.
- G. K. Hyde, G. Scarel, J. C. Spagnola, Q. Peng, K. Lee, B. Gong, K. G. Roberts, K. M. Roth, C. Hanson and C. K. Devine, Langmuir, 2010, 26, 2550–2558 CrossRef CAS PubMed.
- K. Lee, J. S. Jur, D. H. Kim and G. N. Parsons, J. Vac. Sci. Technol., A, 2012, 30, 01A163 Search PubMed.
- L. Liu, Y. Chen, T. Guo, Y. Zhu, Y. Su, C. Jia, M. Wei and Y. Cheng, ACS Appl. Mater. Interfaces, 2012, 4, 17–23 CAS.
- M. Bredol and H. Merikhi, J. Mater. Sci., 1998, 33, 471–476 CrossRef CAS.
- W. Tang and D. C. Cameron, Thin Solid Films, 1996, 280, 221–226 CrossRef CAS.
- C. Falcony, M. Garcia, A. Ortiz and J. C. Alonso, J. Appl. Phys., 1992, 72, 1525–1527 CrossRef CAS PubMed.
- B. Xu and Z. Cai, Polymer, 2008, 108, 3781–3786 CAS.
- J. Lv, J. Zhu, K. Huang, F. Meng, X. Song and Z. Sun, Appl. Surf. Sci., 2011, 257, 7534–7538 CrossRef CAS PubMed.
- C. Yan and D. Xue, J. Phys. Chem. B, 2006, 110, 25850–25855 CrossRef CAS PubMed.
- Y. Wang, Q. Guo, S. Lin, B. Chen and D. Zheng, J. Phys.: Conf. Ser., 2009, 152, 012018 CrossRef.
- F. Dawood and R. E. Schaak, J. Am. Chem. Soc., 2009, 131, 424–425 CrossRef CAS PubMed.
- L. Neveux, D. Chiche, J. Pérez-Pellitero, L. Favergeon, A. Gaya and M. Pijolat, Phys. Chem. Chem. Phys., 2013, 15, 1532–1545 RSC.
- D. Zhu, W. Li, L. Ma and Y. Lei, RSC Adv., 2014, 4, 9372–9378 RSC.
- F. Mesa, W. Chamorro, W. Vallejo, R. Baier, T. Dittrich, A. Grimm, M. C. Lux-Steiner and S. Sadewasser, Beilstein J. Nanotechnol., 2012, 3, 277–284 CrossRef PubMed.
- S. K. Panda, A. Dev and S. Chaudhuri, J. Phys. Chem. C, 2007, 5039–5043 CAS.
- Y. C. Kong, D. P. Yu, B. Zhang, W. Fang and S. Q. Feng, Appl. Phys. Lett., 2001, 78, 407–409 CrossRef CAS PubMed.
- J. V. Foreman, J. Li, H. Peng, S. Choi, H. O. Everitt and J. Liu, Nano Lett., 2006, 6, 1126–1130 CrossRef CAS PubMed.
Footnote |
| † Electronic supplementary information (ESI) available: EDX spectra and TEM images of ZnO/ZnS core–shell nanostructures. See DOI: 10.1039/c4ra12074d |
| This journal is © The Royal Society of Chemistry 2014 |

