DOI:
10.1039/C4RA12030B
(Paper)
RSC Adv., 2014,
4, 61427-61436
6-Gingerol mitigates nutritional steatohepatitis through regulating key genes related to oxidative stress, inflammation and fibrogenesis
Received
9th October 2014
, Accepted 7th November 2014
First published on 7th November 2014
Abstract
The aim of the study was to investigate the effects of 6-gingerol, a bioactive ingredient of plants belonging to the Zingiberaceae family, on experimental models of non-alcoholic steatohepatitis (NASH). Male C57BL/6 mice were fed with a methionine and choline-deficient diet (MCDD) to induce steatohepatitis. After 8 weeks of feeding, the mice were treated orally with 6-gingerol (100 mg per kg per day). All mice were sacrificed after 4 weeks of treatment, and biochemical, pathological, and molecular analyses were performed. MCDD-fed mice showed severe hepatic injury including hepatic steatosis, necro-inflammation and fibrosis. 6-Gingerol possesses a repressive property on hepatic steatosis, which is associated with inhibition of acyl-CoA:diacylglycerol acyltransferase 2 and induction of peroxisome proliferator-activated receptor α. Administration of 6-gingerol significantly lowered plasma levels of alanine aminotransferase, aspartate aminotransferase, reduced hepatic oxidative stress and ameliorated hepatic inflammation and fibrosis. These effects were associated with down-regulation of cytochrome P450 2E1; reducing Jun N-terminal kinase-signaling; suppression of pro-inflammation genes and chemokines; and inhibition of pro-fibrotic genes. Our study demonstrated the protective role of 6-gingerol in ameliorating nutritional steatohepatitis. The effect was mediated through regulating key genes related to oxidative stress, inflammation and fibrogenesis.
Introduction
Nonalcoholic fatty liver disease (NAFLD) has been recognized as the most common liver disease observed in a simple steatosis.1,2 Its progressive form, termed non-alcoholic steatohepatitis (NASH), is a significant predisposing factor for the development of cryptogenic cirrhosis, hepatic failure, and an increasingly more common indication for liver transplantation.3–5 The histopathological features of NASH include evidence of steatosis, liver cell injury, a mixed inflammatory lobular infiltrate, and variable degrees of fibrosis.6 The development of NASH is frequently described by the “two-hit” mechanism wherein liver steatosis constitutes the “first hit” and is accompanied by obesity as well as metabolic disruptions that cause excessive hepatic lipid accumulation.7 Liver steatosis then increases the vulnerability of the liver to a “second hit” in the form of oxidative stress or proinflammatory insults that result in NASH.7 Thus, approaches that suppress oxidative stress and/or proinflammatory responses would be expected to prevent the development of NASH.
Numerous drugs have been tested for the potential to alleviate fatty liver and NASH. These treatments have diverse pharmacological activities such as improvement of insulin sensitivity, stimulation of lipid oxidation, as well as reduction of de novo lipogenesis.8 However, therapies that limit hepatic injury and the related occurrence of inflammation are particularly appealing for this condition. Since NASH is a multifactorial disease, single target based therapy has limited implications. Hence, the use of herbal medicines could be a promising alternative due to their multipronged mechanisms of action.9,10 Of various phytochemicals showing various biochemical and pharmacologic activities, 6-gingerol ((S)-5-hydroxy-1-(4-hydroxy-3-methoxyphenyl)-3-decanone), a major pharmacologically active component of ginger, has been reported to exhibit varied pharmacological activities including antioxidant, anti-inflammatory, anticancer, analgesic and antiplatelet effects.11–13 It has been demonstrated that 6-gingerol exhibits a significant potential as an anti-hyperglycaemic, lipid lowering and antioxidant agent for the treatment of type 2 diabetes.14 Additionally, it has an inhibitory effect on xanthine oxidase responsible for generation of reactive oxygen species like superoxide anion.15 6-Gingerol is beneficial against cytokine-induced inflammation and oxidative stress in HuH7 cells has also been documented.16 These results may open novel treatment options whereby 6-gingerol could potentially protect against NASH.
The animal models that have been used for studying drugs against NASH are based on genetic defects or feeding a methionine and choline-deficient diet (MCDD) in rodents.17 The MCDD model has been verified as more suitable experiment model to study the human disorder, especially with respect to the histopathological features of severe pericentral steatosis and necroinflammation.18 Therefore, this study was undertaken to determine if 6-gingerol can prevent the development of NASH in a MCDD induced hepatosteatosis animal model.
Materials and methods
Animal and experimental protocols
Male 6 week old C57BL/6 mice were obtained from the National Laboratory Animal Center (Taipei, Taiwan). They were maintained in a temperature-controlled room (25 ± 1 °C) on a 12 h:12 h light–dark cycle (lights on at 06:00 h) in our animal center. Food and water were provided ad libitum. The MCDD and the methionine- and choline-sufficient diet (MCSD) were purchased from Dyets Inc. (#518810 and #518754, respectively; Bethlehem, Pennsylvania, USA). Both diets contained similar nutrients (14.2% protein, 15% fat, 3.09% ash, and 5% fiber), except that methionine and choline were not included in the MCDD, whereas 1.70 g kg−1 methionine and 14.48 g kg−1 choline bitartrate were provided in the MCSD. All animal procedures were performed according to the Guide for the Care and Use of Laboratory Animals of the National Institutes of Health, as well as the guidelines of the Animal Welfare Act. These studies were conducted with the approval of the Institutional Animal Care and Use Committee (IACUC) at Tajen University (approval number, IACUC 102-16; approval date, December 24, 2013).
After consuming a MCDD for eight weeks, mice were administered 6-gingerol (≥98%; Sigma-Aldrich Co., St. Louis, MO; Cat. no. G1046) once daily via oral gavage at doses of 100 mg kg−1 in a volume of 1.5 ml kg−1 distilled water. The dosage regimen was selected based on a previous report demonstrating that 6-gingerol was potentially effective in decrease hyperlipidemia in diabetic db/db mice.14 Another group of MCDD-fed mice was treated orally with ciprofibrate (10 mg per kg per day; Sigma-Aldrich Co.; Cat. no. C0330) dissolved in distilled water, a dose based on a study indicating long-term treatment ameliorates hyperlipidemia in hypertriglyceridemic mice.19 Vehicle-treated mice received 1.5 ml kg−1 distilled water only.
Following the further four-week treatment, animals were weighed, fasted for 12 hours, and anesthetized with ketamine. Blood samples from the inferior vena cava were collected for analysis, after which the liver was removed, rinsed with physiological saline, and stored immediately at −80 °C in liquid nitrogen until assayed. The liver relative weight was calculated as liver weight divided by body weight. Other hepatic tissues were fixed in 10% neutralized formalin for histology.
Biochemical analysis
Blood samples were centrifuged at 2000× g for 10 minutes at 4 °C. The plasma was removed and placed into aliquots for analyses. Diagnostic kits for determining plasma levels of total cholesterol (TC; Cat. # 10007640) and triglycerides (TG; Cat. # 10010303) were purchased from Cayman Chemical Company (Ann Arbor, MI, USA). Kits for determination of plasma alanine aminotransferase (ALT; EC 2.6.1.2; Cat. no. A524-780TM) and aspartate aminotransferase (AST; EC 2.6.1.1; Cat. no. A559-780TM) concentrations were purchased from Teco Diagnostics (Anaheim, CA, USA). All experimental assays were carried out according to the manufacturers' instruction; all samples were analyzed in triplicate.
Measurement of hepatic lipids
Hepatic lipid content was determined from fresh liver samples. Liver (1.25 g) was homogenized with chloroform–methanol (1
:
2, 3.75 ml) and mixed well with chloroform (1.25 ml) and distilled water (1.25 ml). After centrifuging for 10 minutes at 1500× g, the lower clear organic phase was transferred into a new glass tube and then lyophilized. The lyophilized powder was dissolved in chloroform–methanol (1
:
2) and stored at −20 °C for less than three days.20 Hepatic cholesterol and TG levels in the lipid extracts were analyzed using the same diagnostic kits used for plasma analysis.
Histological analysis
For the microscopic analysis, the liver fragment slides were stained with hematoxylin–eosin and subsequently assessed by a single pathologist who was unaware of the experimental groups. The minimum histological criterion for the diagnosis of NASH was the presence of steatosis associated with hepatocellular ballooning involving zone 3 and lobular inflammatory infiltrate.21 The histopathological features of steatohepatitis were evaluated semi-quantitatively, according to the validated histological scoring system recommended by the Pathology Committe of the NASH Clinical Research Network.22 The degree of steatosis was evaluated by the percentage of hepatocytes containing macro- or micro-vesicular fat and graded as follows: grade 0 (0 < 5%), grade 1 (5–33%), grade 2 (33–66%), and grade 3 (>66%). Lobular inflammation was classified as: 0 (no foci), 1 (<2 foci per 200× field), 2 (2–4 foci per 200× field), or 3 (>4 foci per 200× field). Hepatocellular ballooning was graded as follows: 0 (none), 1 (few balloon cells), or 2 (many cells/prominent ballooning). Fibrosis staging was classified as follows: 0 (none), 1 (perisinusoidal or periportal), 2 (perisinusoidal and portal/periportal), 3 (bridging fibrosis), or 4 (cirrhosis).
Measurement of hepatic malondialdehyde
Malondialdehyde (MDA) concentration is a presumptive marker of oxidant-mediated lipid peroxidation. Lipid peroxidation was measured using Aldetect Lipid Peroxidation Assay kit (Enzo Life Sciences, NY, USA). In brief, for each reaction, 10 μl of probucol and 640 μl of diluted R1 reagent (1
:
3 of methanol
:
N-methyl-2-phenylindole) were added to 10 mg of liver homogenate and mixed with 150 μl of 12 mmol l−1 HCl. Each reaction was incubated at 45 °C for 60 min and centrifuged at 10
000× g for 10 min. The supernatant was used to measure MDA formation at 586 nm.
Determination of hepatic antioxidant parameters
SOD activity in the liver tissue was determined using an assay kit (Dojindo Laboratories, Kumamoto, Japan), according to the manufacturer's protocol. Bovine erythrocyte SOD (Sigma Aldrich, St. Louis, MO, USA) was used as a standard.
Catalase activity in the liver tissues was determined with hydrogen peroxide as the substrate.23 The 140 ml of phosphate buffer (250 mmol l−1, pH 7.0), 150 ml of 12 mmol l−1 methanol and 30 ml of 44 mmol l−1 hydrogen peroxide were in the test tube. The reaction was initiated with 300 ml of samples or standard solutions. The reaction was allowed to proceed for 10 to 20 min and completed by the addition of 450 ml of Purpald solution (22.8 mmol l−1 of Purpald in a 2 N potassium hydroxide). The incubation mixture was mixed gently in a vortex mixer and left for 20 min at 25 °C. Added to 150 ml of potassium periodate (65.2 mmol l−1 in 0.5 N potassium hydrate) at the same tube and the tube vortexes gently again. The absorbance of the purple formaldehyde adduct produced was measured at 550 nm using a spectrophotometer (Molecular Devices).
Total GSH content in liver tissue was determined according to the previously method.24 Briefly, 50 ml aliquots of the supernatant or standard were combined with 80 ml of DTNB–NADPH mixture (10 ml of 4 mmol l−1 DTNB and 70 ml of 0.3 mmol l−1 NADPH) in a 96-well plate. Finally, 20 ml (0.06 U) of GSH-Rd solution was added to each well and incubated for 5 min, and the absorbance was measured at 405 nm after 5 min.
Western blotting
Liver samples were homogenized for 30 min in ice-cold radioimmune protection assay lysis buffer (50 mmol l−1 Tris, pH 7.4, 150 mmol l−1 NaCl, 1% Triton X-100, 1% sodium deoxycholate, 0.1% sodium dodecyl sulfate, 1 mg ml−1 leupeptin, 50 mmol l−1 sodium fluoride, 1 mmol l−1 sodium orthovanadate, and 1 mmol l−1 phenylmethylsulfonyl fluoride). Liver homogenates were then centrifuged at 12
000 rpm for 30 min at 4 °C and protein concentrations were determined using the Bradford method. Equal protein amounts (50 μg) were separated by sodium dodecyl sulfate polyacrylamide gel electrophoresis and electro-transferred onto polyvinylidene difluoride membranes, which were then blocked with 1% bovine serum albumin and probed with primary antibodies against p38 mitogen-activated protein kinase (p38; Cell Signaling Technology, Beverly, MA, USA), phospho-p38 (Thr180/Tyr182) (p-p38; Cell Signaling Technology), Jun N-terminal kinase (JNK) (Santa Cruz Biotechnology, Santa Cruz, CA, USA), phospho-JNK (Thr183/Tyr185) (Santa Cruz Biotechnology) or β-actin (Santa Cruz Biotechnology). The level of β-actin was estimated for equal loading of sample. Membranes were washed three times with Tris-buffered saline Tween 20 (TBST) and incubated for 1 hour at room temperature with appropriate horseradish peroxidase-conjugated secondary antibodies. After three additional TBST washes, the immunoreactive bands were visualized by enhanced chemiluminescence (Amersham Biosciences, Buckinghamshire, UK) according to the manufacturer's instructions. Band densities were determined using ATTO Densitograph Software (ATTO Corporation, Tokyo, Japan).
Analysis of mRNA expression of hepatic genes
To analyze gene expression, total RNA was extracted from 100 mg frozen liver samples using Trizol reagent (Invitrogen; Boston, MA, USA). RNA was quantified by A260, and its integrity verified by agarose gel electrophoresis using ethidium bromide for visualization. For the reverse transcriptase reaction, 1 μg of total RNA per sample and 8.5 μg μl−1 random hexamer primers were heated to 65 °C for 5 minutes, and then quenched on ice. This mixture was combined with 500 μmol l−1 each of dATP, dTTP, dCTP, and dGTP, 10 mmol l−1 DTT, 20 mmol l−1 Tris–HCl (pH 8.4), 50 mmol l−1 KCl, 5 mmol l−1 MgCl2, 40 units of RNaseOUT recombinant ribonuclease inhibitor (Invitrogen), and 100 units SuperScript III reverse transcriptase (Invitrogen). Samples were treated with DNase (Promega; Madison, WI, USA) for 20 minutes at 37 °C in a GeneAmp 9700 Thermal Cycler (Applied Biosystems; Foster City, California, USA) and then held at 4 °C. After aliquots were taken for immediate use in polymerase chain reaction (PCR), the remainder of the cDNA was stored at −20 °C. Messenger RNA (mRNA) expression was measured by quantitative real-time reverse transcription polymerase chain reaction (RT-PCR) in a fluorescent temperature Lightcycler 480 (Roche Diagnostics; Mannheim, Germany). Primers for amplification of each gene are listed in Table 1. The highly specific measurement of mRNA was carried out for cytochrome P450(CYP) 2E1, tumor necrosis factor (TNF)-α, monocyte chemoattractant protein (MCP)-1, α-smooth muscle actin (SMA), type IA1collagen (Col1A1), type IIIA1 collagen (Col3A1), transforming growth factor (TGF)-β, peroxisome proliferator-activated receptor (PPAR)-α, acyl-CoA:diacylglycerol acyltransferase 2 (DGAT2), and glyceraldehyde phosphate dehydrogenase (GAPDH) using the LightCycler system (Bio-Rad). Each sample was run and analyzed in duplicate. Primers were designed using Primer Express Software version 2.0 System (Applied Biosystems; Foster City, CA, USA). The PCR reaction was performed using the following cycling protocol: 95 °C for 5 minutes, 45 cycles of 95 °C for 5 seconds, 58 °C for 15 seconds, and 72 °C for 20 seconds. Dissociation curves were run after amplification to identify the specific PCR products. mRNA expression levels were normalized to GAPDH mRNA levels and calculated according to the delta–delta Ct method.25
Table 1 Sequences of oligonucleotides used as primers
Target gene |
Primers |
Sequence (5′-3′) |
CYP2E1 |
Forward primer |
ATGTCATCCCCAAGGGTACA |
Reverse primer |
CGGGGAATGACACAGAGTTT |
TNFα |
Forward primer |
CCAGGAGAAAGTCAGCCTCCT |
Reverse primer |
TCATACCAGGGCTTGAGCTCA |
MCP-1 |
Forward primer |
TCTCTTCCTCCACCACTATGCA |
Reverse primer |
GGCTGAGACAGCACGTGGAT |
α-SMA |
Forward primer |
TGCTGTCCCTCTATGCCTCT |
Reverse primer |
GAAGGAATAGCCACGTCAG |
Col1A1 |
Forward primer |
ACAGCCGCTTCACCTACAGC |
Reverse primer |
TCAATCACTGTCTTGCCCCA |
Col3A1 |
Forward primer |
TCTTGGTCAGCTCTATGCGGA |
Reverse primer |
TGTCATCGCAGAGAACGGATC |
TGFβ |
Forward primer |
CCCAGCATCTGCAAAGCTC |
Reverse primer |
GTCAATGTACAGCTGCCGCA |
PPARα |
Forward primer |
CGTCCTGGCCTTCTAAACGTAG |
Reverse primer |
CCTGTAGATCTCCTGCAGTAGCG |
DGAT2 |
Forward primer |
CATGAAGACCCTCATCGCCG |
Reverse primer |
GTGACAGAGAAGATGTCTTGG |
GAPDH |
Forward primer |
ACCCACTCCTCCACCTTTG |
Reverse primer |
CTCTTGTGCTCTTGCTGGG |
Statistical analysis
Data are expressed as mean ± standard error of mean (SEM). Statistical analyses were performed using one-way analysis of variance. Dunnett range post-hoc comparisons were used to determine the source of significant differences, where appropriate. For the histological study, a non-parametric Kruskal–Wallis test was performed and Mann–Whitney's U test was used to compare data within the groups. The SigmaPlot (Version 12.0) program was used for statistical analysis. Values of p < 0.05 were considered statistically significant.
Results
Effects of treatments on plasma lipid profile, hepatic lipids and liver relative weight in mice
Plasma levels of TC, and TG were lower in MCDD-fed mice than that in MCSD-fed animals. Treatment of MCDD-fed mice with 6-gingerol or ciprofibrate had no significant effect on plasma TC and TG (Fig. 1A).
 |
| Fig. 1 Effects of treatments on plasma lipid profile (A), hepatic lipids (B) and liver relative weight (C) in mice. MCDD-fed mice were dosed by oral gavage once daily for four weeks with 6-gingerol (100 mg per kg per day), or ciprofibrate (10 mg per kg per day). Another group of MCDD- or MCSD-fed mice receiving vehicle treatment were given the same volume of vehicle (distilled water) used to prepare the tested medication solutions. Values (mean ± SEM) were obtained from each group of 8 animals. ap < 0.05 and bp < 0.01 compared to the values of vehicle-treated MCSD-fed mice in each group, respectively. cp < 0.05 and dp < 0.01 compared to the values of vehicle-treated MCDD-fed mice in each group, respectively. | |
Hepatic cholesterol and TG levels were significantly higher in MCDD-fed mice compared with mice from the MCSD-fed group, and these were reduced by 26.3% and 36.8%, respectively, in MCDD-fed mice treated with 6-gingerol (Fig. 1B). Ciprofibrate treatment also reduced hepatic cholesterol and TG levels to 29.5% and 40.6% of that in vehicle-treated MCDD-fed mice, respectively (Fig. 1B).
MCDD remarkably decreased the relative liver weight in mice compared with the MCSD-fed group; while the change in the relative liver weight was significantly ameliorated by 6-gingerol treatment (Fig. 1C). Similar results were seen in MCDD-fed mice treated with ciprofibrate (Fig. 1C).
Effects of treatments on liver injury in mice
Plasma ALT and AST activities in MCDD-fed mice were higher than those in MCSD-fed group (Fig. 2A). The ALT and AST activities were markedly reduced in MCDD-fed mice treated for four weeks with 6-gingerol (Fig. 2A). Ciprofibrate treatment also significantly attenuated the changes in plasma ALT and AST in MCDD-fed mice (Fig. 2A).
 |
| Fig. 2 Effects of treatments on hepatic injury in mice. MCDD-fed mice were dosed by oral gavage once daily for four weeks with 6-gingerol (100 mg per kg per day), or ciprofibrate (10 mg per kg per day). Another group of MCDD- or MCSD-fed mice receiving vehicle treatment were given the same volume of vehicle (distilled water) used to prepare the tested medication solutions. Plasma ALT and AST levels were measured after the last treatments (A). Hematoxylin–eosin staining (original magnification, 200×) was performed in excised liver sections of mice (B). Scores for hepatic steatosis, hepatocyte ballooning, necroinflammation and fibrosis in mice (C). Values (mean ± SEM) were obtained from each group of 8 animals. ap < 0.05 and bp < 0.01 compared to the values of vehicle-treated MCSD-fed mice in each group, respectively. cp < 0.05 and dp < 0.01 compared to the values of vehicle-treated MCDD-fed mice in each group, respectively. | |
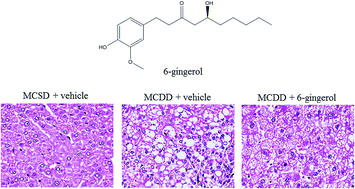
The liver sections from mice fed with MCDD exhibited disordered lobule structure, hepatocyte ballooning, moderate steatosis, and inflammatory infiltration (Fig. 2B). 6-Gingerol significantly ameliorated steatosis, lobular inflammation and ballooning degeneration in hepatocytes of MCDD-fed mice. Similar results were obtained in the ciprofibrate-treated MCS diet-fed group (Fig. 2B). Fibrosis stage was higher in the MCDD-fed mice than in the MCSD-fed group; it was especially lower by 6-gingerol or ciprofibrate treatment (Fig. 2B). Fig. 2C summarizes the histological findings of each group.
Effects of treatments on hepatic antioxidant parameters in mice
MCDD significantly depleted the antioxidant parameters including SOD and catalase activity in the liver tissue of mice, compared with those in the MCSD-fed group. The 6-gingerol treatment ameliorated the alteration of SOD and catalase activity in liver of MCDD-fed mice (Fig. 3). The hepatic GSH content was decreased in MCDD-fed mice, while 6-gingerol treatment significantly increased the hepatic GSH content. Ciprofibrate treatment did not show any significant effect on those hepatic antioxidant parameters in MCDD-fed mice (Fig. 3).
 |
| Fig. 3 Effects of treatments on hepatic antioxidant parameters in mice. MCDD-fed mice were dosed by oral gavage once daily for four weeks with 6-gingerol (100 mg per kg per day), or ciprofibrate (10 mg per kg per day). Another group of MCDD- or MCSD-fed mice receiving vehicle treatment were given the same volume of vehicle (distilled water) used to prepare the tested medication solutions. Values (mean ± SEM) were obtained from each group of 8 animals. ap < 0.05 and bp < 0.01 compared to the values of vehicle-treated MCSD-fed mice in each group, respectively. cp < 0.05 and dp < 0.01 compared to the values of vehicle-treated MCDD-fed mice in each group, respectively. | |
Effects of treatments on oxidative stress and inflammatory cytokines in livers of mice
The hepatic level of MDA in MCDD-fed mice was markedly higher than that in the MCSD-fed group (Fig. 4A). 6-Gingerol treatment significantly attenuated the changes in the hepatic MDA levels of MCDD-fed mice (Fig. 4A). Treatment MCDD-fed mice with ciprofibrate also attenuated the alterations in the hepatic MDA levels (Fig. 4A).
 |
| Fig. 4 Effects of treatments on oxidative stress and inflammatory cytokines in livers of mice. MCDD-fed mice were dosed by oral gavage once daily for four weeks with 6-gingerol (100 mg per kg per day), or ciprofibrate (10 mg per kg per day). Another group of MCDD- or MCSD-fed mice receiving vehicle treatment were given the same volume of vehicle (distilled water) used to prepare the tested medication solutions. The hepatic MDA levels in mice were determined (A). The mRNA levels of CYP2E1, MCP-1, and TNFα in livers of mice were normalized to GAPDH mRNA levels (B). Values (mean ± SEM) were obtained from each group of 8 animals. ap < 0.05 and bp < 0.01 compared to the values of vehicle-treated MCSD-fed mice in each group, respectively. cp < 0.05 and dp < 0.01 compared to the values of vehicle-treated MCDD-fed mice in each group, respectively. | |
MCDD-fed mice had greater mRNA levels of CYP2E1, MCP-1, and TNFα, compared to the MCSD-fed group (Fig. 4B). The expression levels of CYP2E1, MCP-1, and TNFα in liver of 6-gingerol-treated MCDD-fed mice were lower than those of their vehicle-treated counterparts (Fig. 4B). Ciprofibrate treatment also attenuated the changes in the hepatic levels of CYP2E1, MCP-1, and TNFα in MCDD-fed mice (Fig. 4B).
Effects of treatments on hepatic mRNA expression of fibrosis-related genes in mice
Compared with MCSD-fed group, the hepatic mRNA levels of α-SMA, type I and III collagen in MCDD-fed mice increased obviously, which were down-regulated by 6-gingerol treatment (69.2, 42.1 and 74.4% decreases, respectively; Fig. 5). The hepatic mRNA levels of α-SMA, type I and III collagen in MCDD-fed mice receiving ciprofibrate treatment were decreased to 56.5, 44.3 and 70.7% relative to the expression levels in vehicle-treated counterparts, respectively (Fig. 5).
 |
| Fig. 5 Effects of treatments on hepatic mRNA expression of fibrosis-related genes in mice. MCDD-fed mice were dosed by oral gavage once daily for four weeks with 6-gingerol (100 mg per kg per day), or ciprofibrate (10 mg per kg per day). Another group of MCDD- or MCSD-fed mice receiving vehicle treatment were given the same volume of vehicle (distilled water) used to prepare the tested medication solutions. The mRNA levels of α-SMA, type I and type III collagen, and TGFβ in livers of mice were normalized to GAPDH mRNA levels. Values (mean ± SEM) were obtained from each group of 8 animals. ap < 0.05 and bp < 0.01 compared to the values of vehicle-treated MCSD-fed mice in each group, respectively. cp < 0.05 and dp < 0.01 compared to the values of vehicle-treated MCDD-fed mice in each group, respectively. | |
The mRNA levels of TGFβ in livers of MCDD-fed mice were higher to 214.3% of those from MCSD-fed group (Fig. 5). Administration MCDD-fed mice with 6-gingerol or ciprofibrate for 4 weeks significantly down-regulated the hepatic TGFβ mRNA levels to 80.8 and 72.9% relative to those in vehicle-treated counterparts, respectively (Fig. 5).
Effects of treatments on hepatic mRNA expression of lipid metabolism-associated genes
Hepatic mRNA levels of DGAT2 were significantly reduced (by 50.6%) in 6-gingerol-treated MCDD-fed mice compared with the vehicle-treated counterparts (Fig. 6). Ciprofibrate suppressed the MCDD-induced stimulation in hepatic mRNA levels of DGAT2 to 61.4% relative to those in their vehicle-treated counterparts (Fig. 6).
 |
| Fig. 6 Effects of treatments on hepatic mRNA expression of DGAT2 and PPARα in mice. MCDD-fed mice were dosed by oral gavage once daily for four weeks with 6-gingerol (100 mg per kg per day), or ciprofibrate (10 mg per kg per day). Another group of MCDD- or MCSD-fed mice receiving vehicle treatment were given the same volume of vehicle (distilled water) used to prepare the tested medication solutions. Values (mean ± SEM) were obtained from each group of 8 animals. ap < 0.05 and bp < 0.01 compared to the values of vehicle-treated MCSD-fed mice in each group, respectively. cp < 0.05 and dp < 0.01 compared to the values of vehicle-treated MCDD-fed mice in each group, respectively. | |
The mRNA levels of PPARα in livers of MCDD-fed mice were lower to 47.2% of those from MCSD-fed group (Fig. 6). The hepatic mRNA levels of PPARα were upregulated by 6-gingerol or ciprofibrate treatment, with an increase of 44.6, and 57.4%, respectively, when compared with those observed in the vehicle-treated counterparts (Fig. 6).
Effects of Treatments on MAPK signaling pathways in mice
The JNK phosphorylation was significantly greater in the livers of MCDD-fed mice compared to the MCSD-fed group (Fig. 7). 6-Gingerol-treated MCDD-fed mice had 32.7% lower JNK phosphorylation in liver than that of their vehicle-treated counterparts (Fig. 7). Ciprofibrate suppressed the hepatic JNK phosphorylation of MCDD-fed mice by 29.9% relative to that of their untreated counterparts (Fig. 7).
 |
| Fig. 7 Effects of treatments on MAPK signaling pathways in livers of mice. MCDD-fed mice were dosed by oral gavage once daily for four weeks with 6-gingerol (100 mg per kg per day), or ciprofibrate (10 mg per kg per day). Another group of MCDD- or MCSD-fed mice receiving vehicle treatment were given the same volume of vehicle (distilled water) used to prepare the tested medication solutions. Ratios of p-JNK/JNK, or p-p38/p38 are expressed as the mean with SEM (n = 8 per group) in each column. ap < 0.05 and bp < 0.01 compared to the values of vehicle-treated MCSD-fed mice in each group, respectively. cp < 0.05 and dp < 0.01 compared to the values of vehicle-treated MCDD-fed mice in each group, respectively. | |
However, no change was observed in the phosphorylation of p38 in the livers of MCDD-fed mice compared with the MCSD-fed group (Fig. 7). Treatment MCDD-fed mice with 6-gingerol or ciprofibrate did not affect the phosphorylation of p38 in the livers (Fig. 7).
Discussion
The use of a diet deficient in essential amino acids such as methionine and choline is a well-accepted model for inducing NASH, which recapitulates many of the features of this disease in humans, including a histologic picture that mimics that seen in human fibrotic disorders associated with hepatic lipid accumulation, and the presence of inflammation and oxidative stress.18 To support the application of 6-gingerol in the treatment of NASH-like disorders, the study investigated the hepatotherapeutic effect of 6-gingerol in an animal model of MCDD-induced hepatic injury. Mice consistently developed steatosis, ballooning injury, inflammatory cell infiltration and fibrosis following the MCDD intake, which is in line with previous reports on this nutritional model of NASH.26 Fat accumulation in the liver can be recognized as the “first hit” in the pathogenesis of NASH.8 We found that 6-gingerol produced pharmaceutical effects on hepatic cholesterol and TG levels. In addition, the histopathological findings in liver of MCDD fed-mice were considerably ameliorated by 6-gingerol treatment. ALT and AST are considered to be sensitive indicators of hepatocellular damage and within limits can provide a quantitative evaluation of the degree of damage to the liver.27 In the current study, the ALT and AST activities were markedly reduced in MCDD-fed mice treated with 6-gingerol. These results indicate that 6-gingerol attenuated the liver injury in an MCDD-induced NASH animal model.
Several studies have suggested that hepatic lipogenesis is increased in hepatic steatosis, which may result from either increased TG synthesis, or decreased fatty acid oxidation through production of malony-CoA, both leading to increased TG content in the liver.28 DGAT2 is a microsomal enzyme that joins acyl-CoA to 1,2-diacylglycerol and thus constitutes the final step in TG biosynthesis.29 PPARα plays a central role in the uptake and β-oxidation of fatty acids, especially in the liver.30,31 PPARα has been reported to protect against high-fat or MCDD-induced NASH in rodents.32,33 Our results showed that DGAT2 expression in MCDD-fed mice was decreased in the 6-gingerol-treated group. PPARα mRNA level was significantly increased in 6-gingerol-treated MCDD-fed mice. These results demonstrated that 6-gingerol induced down-regulation of lipogenesis-related genes to inhibit accumulation of hepatic lipid droplets via a decrease of TG synthesis in MCDD-fed mice. In addition, the beneficial effects of 6-gingerol in the treatment of liver steatosis may be partly due to enhanced fatty acids oxidation in the liver.
Fatty acids overload in hepatocytes acts as both a substrate and an inducer of CYP2E1 and its overexpression contributes to oxidative stress, which is considered to be the critical “hit” in the transition from benign steatosis to steatohepatitis.34 In this work, 6-gingerol treatment suppressed CYP2E1 expression, and reduced hepatic MDA level, a marker of lipid peroxidation, in MCDD-fed mice, indicating that treatment with 6-gingerol could abate MCDD-induced oxidative stress in livers. Oxidative stress occurs when oxidative stressors overwhelm the defense system over antioxidant. SOD is an essential enzyme for an effective defense against reactive oxygen species, and it accelerates the formation of hydrogen peroxide using superoxide radicals.35 Furthermore, the catalase and the GSH redox systems play a central role in accelerating the degradation of unstable hydrogen peroxide to water and oxygen.36 It has been reported that the levels of these antioxidant parameters are decreased in the livers of patients with NASH.37 The MCDD significantly diminished the antioxidant-associated parameter levels, whereas these depletions were significantly improved by 6-gingerol treatment. The antioxidant action may be a possible mechanism of the hepatotherapeutic effect of 6-gingerol in an MCDD-induced NASH animal model.
Oxidative stress leads to inflammatory responses, including TNFα and MCP-1.38 In addition, these proinflammatory cytokines and chemokines are associated with the development and progression of hepatic inflammation and the progression to fibrosis and subsequent cirrhosis.38 The critical step in the generation of liver fibrosis is the activation of hepatic stellate cells (HSC), which are recognized as the main collagen-producing cells in the liver, and an increase in the expression of α-SMA in HSC strongly augmented extracellular matrix deposition, including collagen I and collagen III collagen.39 The role of profibrogenic cytokines is central for the development of fibrosis, with progression greatly dependent on TGFβ production.7 The present study demonstrates that 6-gingerol lowers mRNA levels of hepatic MCP-1, TNFα, and TGFβ that are otherwise higher following MCDD feeding. The increase expression of α-SMA, type IA1 and IIIA1 collagen in the livers of MCDD fed mice was also diminished by 6-gingerol treatment. Results from the present research suggest the attenuation of the first hit and second hit by 6-gingerol improved liver inflammation and fibrosis in this MCDD murine model. Down-regulation of inflammatory cytokines and TGFβ could be the contributor to the antifibrotic properties of 6-gingerol.
The phosphorylation of MAPK, which is required for enzyme activity, activates signaling cascades, the downstream effects of which have been linked to the regulation of cellular apoptosis, an inflammatory response.40 The activation of these regulatory MAPKs such as JNK and p38, through phosphorylation, usually leads to cell death and inflammation.41 Increased JNK phosphorylation has been reported in NASH model mice.42 In this study, we demonstrated that 6-gingerol decreased in the extent of JNK phosphorylation, which may lead to reduce inflammation by decreasing the expression of proinflammatory cytokines and chemokines in NASH. In contrast, inhibition of p38 activation did not show a clear association with the benefit effect of 6-gingerol in MCDD-fed mice. These results suggest that the attenuation of liver injury in MCDD-fed mice by treatment with 6-gingerol is related to JNK phosphorylation in particular.
Conclusion
This study demonstrated that 6-gingerol exerted a protective effect on MCDD-induced liver steatosis and injury through the modulation of lipid metabolism-related genes in mice. It is also possible that the anti-inflammation and anti-oxidation roles of 6-gingerol are integral to the protective functions of this compound in liver steatosis and its subsequent progression to steatohepatitis.
Acknowledgements
The present study was supported by a grant from the Ministry of Science and Technology (102-2320-B-127-001-MY3) of Taiwan.
Notes and references
- P. Angulo, N. Engl. J. Med., 2002, 346, 1221–1231 CrossRef CAS PubMed.
- V. J. Goh and D. L. Silver, Semin. Liver Dis., 2013, 33, 312–320 CrossRef CAS PubMed.
- G. C. Farrell and C. Z. Larter, Hepatology, 2006, 43, S99–S112 CrossRef CAS PubMed.
- D. N. Amarapurkar, M. Dharod, S. Gautam and N. Patel, Trop. Gastroenterol., 2013, 34, 159–163 CrossRef CAS.
- A. K. Singal, P. Guturu, B. Hmoud, Y. F. Kuo, H. Salameh and R. H. Wiesner, Transplantation, 2013, 95, 755–760 CrossRef PubMed.
- E. M. Brunt and D. G. Tiniakos, World J. Gastroenterol., 2010, 16, 5286–5296 CrossRef.
- M. Basaranoglu, G. Basaranoglu and H. Sentürk, World J. Gastroenterol., 2013, 19, 1158–1165 CrossRef CAS PubMed.
- M. Duvnjak, I. Lerotić, N. Barsić, V. Tomasić, L. Virović Jukić and V. Velagić, World J. Gastroenterol., 2007, 13, 4539–4550 CAS.
- M. C. Thounaojam, R. N. Jadeja, R. V. Devkar and A. V. Ramachandran, J. Appl. Biomed., 2012, 10, 119–136 CrossRef PubMed.
- R. Jadeja, R. V. Devkar and S. Nammi, J. Evidence-Based Complementary Altern. Med., 2014, 2014, 648308 Search PubMed.
- J. H. Guh, F. N. Ko, T. T. Jong and C. M. Teng, J. Pharm. Pharmacol., 1995, 47, 329–332 CrossRef CAS PubMed.
- H. Y. Young, Y. L. Luo, H. Y. Cheng, W. C. Hsieh, J. C. Liao and W. H. Peng, J. Ethnopharmacol., 2005, 96, 207–210 CrossRef CAS PubMed.
- J. K. Kim, Y. Kim, K. M. Na, Y. J. Surh and T. Y. Kim, Free Radical Res., 2007, 41, 603–614 CrossRef CAS PubMed.
- A. B. Singh, A. N. Singh, R. Maurya and A. K. Srivastava, Int. J. Med. Med. Sci., 2009, 1, 536–544 CAS.
- W. S. Chang, Y. H. Chang, F. J. Lu and H. C. Chiang, Anticancer Res., 1994, 14, 501–506 CAS.
- X. H. Li, K. C. McGrath, V. H. Tran, Y. M. Li, C. C. Duke, B. D. Roufogalis and A. K. Heather, J. Evidence-Based Complementary Altern. Med., 2013, 2013, 146142 Search PubMed.
- A. Koteish and A. Mae Diehl, Best Pract. Res., Clin. Gastroenterol., 2002, 16, 679–690 CrossRef CAS PubMed.
- D. P. Macfarlane, X. Zou, R. Andrew, N. M. Morton, D. E. Livingstone, R. L. Aucott, M. J. Nyirenda, J. P. Iredale and B. R. Walker, Am. J. Physiol.: Endocrinol. Metab., 2011, 300, E402–E409 CrossRef CAS PubMed.
- E. J. Bighetti, P. R. Patrício, A. C. Casquero and J. A. Berti, Lipids Health Dis., 2009, 8, 50 CrossRef PubMed.
- J. Folch, M. Lees and G. H. Sloane-Stanley, J. Biol. Chem., 1957, 226, 497–506 CAS.
- S. A. Harrison and B. Neuschwander-Tetri, Clin. Liver Dis., 2004, 8, 861–879 CrossRef PubMed.
- D. E. Kleiner, E. M. Brunt, M. Van Natta, C. Behling, M. J. Contos, O. W. Cummings, L. D. Ferrell, Y. C. Liu, M. S. Torbenson, A. Unalp-Arida, M. Yeh, A. J. McCullough and A. J. Sanyal, Hepatology, 2005, 41, 1313–1321 CrossRef PubMed.
- L. H. Johansson and L. A. Borg, Anal. Biochem., 1988, 174, 331–336 CrossRef CAS.
- G. L. Ellman, Arch. Biochem. Biophys., 1959, 82, 70–77 CrossRef CAS.
- K. J. Livak and T. D. Schmittgen, Methods, 2001, 25, 402–408 CrossRef CAS PubMed.
- H. Itagaki, K. Shimizu, S. Morikawa and K. Ogawa, Int. J. Clin. Exp. Pathol., 2013, 6, 2683–2696 Search PubMed.
- P. T. Giboney, Am. Fam. Physician, 2005, 71, 1105–1110 Search PubMed.
- J. D. Browning and J. D. Horton, J. Clin. Invest., 2004, 114, 147–152 CrossRef CAS.
- S. J. Stone, H. M. Myers, S. M. Watkins and B. E. Brown, J. Biol. Chem., 2004, 279, 11767–11776 CrossRef CAS PubMed.
- J. K. Reddy, N. D. Lalwani, S. A. Qureshi, M. K. Reddy and C. M. Moehle, Am. J. Pathol., 1984, 114, 171–183 CAS.
- J. C. Corton, S. P. Anderson and A. Stauber, Annu. Rev. Pharmacol. Toxicol., 2000, 40, 491–518 CrossRef CAS PubMed.
- E. Ip, G. Farrell, P. Hall, G. Robertson and I. Leclercq, Hepatology, 2004, 39, 1286–1296 CrossRef CAS PubMed.
- M. A. Abdelmegeed, S. H. Yoo, L. E. Henderson, F. J. Gonzalez, K. J. Woodcroft and B. J. Song, J. Nutr., 2011, 141, 603–610 CrossRef CAS PubMed.
- G. Robertson, I. Leclercq and G. C. Farrell, Am. J. Physiol.: Gastrointest. Liver Physiol., 2001, 281, G1135–G1139 CAS.
- J. V. Bannister, W. H. Bannister and G. Rotilio, CRC Crit. Rev. Biochem., 1987, 22, 111–180 CrossRef CAS.
- C. Giovannini, C. Filesi, M. D'Archivio, B. Scazzocchio, C. Santangelo and R. Masella, Ann. Ist. Super. Sanita, 2006, 42, 336–347 CAS.
- F. Marra, A. Gastaldelli, G. Svegliati Baroni, G. Tell and C. Tiribelli, Trends Mol. Med., 2008, 14, 72–81 CrossRef CAS PubMed.
- F. Ucar, S. Sezer, S. Erdogan, S. Akyol, F. Armutcu and O. Akyol, Redox Rep., 2013, 18, 127–133 CrossRef CAS PubMed.
- S. De Minicis and D. A. Brenner, Arch. Biochem. Biophys., 2007, 462, 266–272 CrossRef CAS PubMed.
- R. Seger and E. C. Krebs, FASEB J., 1995, 9, 726–735 CAS.
- X. Wang, J. L. Martindale, Y. Liu and N. J. Holbrook, Biochem. J., 1998, 333, 291–300 CAS.
- S. Aghazadeh and R. Yazdanparast, Clin. Nutr., 2010, 29, 381–385 CrossRef CAS PubMed.
|
This journal is © The Royal Society of Chemistry 2014 |
Click here to see how this site uses Cookies. View our privacy policy here.