Wavenumber–intensity joint SERS encoding using silver nanoparticles for tumor cell targeting

Dan Zhu, Zhuyuan Wang*, Shenfei Zong, Hui Chen, Peng Chen and Yiping Cui*
Advanced Photonics Center, Southeast University, 2# Sipailou, Nanjing 210096, Jiangsu, China. E-mail: cyp@seu.edu.cn; wangzy@seu.edu.cn; Fax: +86-25-83790201; Tel: +86-25-83792470

Received 30th September 2014 , Accepted 23rd October 2014

First published on 24th October 2014


Abstract

A new optical encoding approach, the wavenumber–intensity joint surface enhanced Raman scattering (SERS) spectral encoding method, was demonstrated by using silver nanoparticles with a core–shell structure. Using three kinds of Raman reporters, 1,4-benzenedithiol (BDT), 2-naphthalenethiol (2-NAT) and 4-methoxythiophenol (4-MT), which were self-assembled on the surfaces of a silver core, 19 codes with distinguished spectral characteristics have been achieved. By conjugating specific antibodies to silver nanoparticles with a certain code, the potential application of such an encoding system in tumor cell targeting has been investigated. The high selectivity of the assay indicates that the joint encoding method could be developed as a powerful tool for high-throughput bioanalysis in the future.

Introduction

High-throughput screening of biomarkers has great potential for clinical and medical diagnostics, which require detecting multiplex species simultaneously without separation from the biological matrix.1–4 In the past years, an important multiplex detection strategy called encoding technique has arisen.5–8 Up to now, spectrometric encoding and electronic encoding have been developed substantially, as well as graphical encoding.9 Among various encoding techniques, optically encoded beads based on surface enhanced Raman scattering (SERS) have many advantages, including high sensitivity, high resolution and narrow spectral bandwidth.10–13 Due to the fingerprint characteristics and narrow bandwidth of SERS spectra, SERS-based encoding beads have a great multiplexing capacity.13,14 A key benefit is that the sharp bands of Raman vibration provide a powerful multiplexing platform for biomedical detection with much less spectral overlap compared with fluorescence-based encoders.

In a SERS-based encoder, labels (Raman reporters) are usually adsorbed onto the roughened metal surfaces to generate strong SERS signals.15–18 By combining different kinds of Raman reporters, nanoprobes with many optical codes can be achieved.19–22 Thus, parallel detection of multiplex target molecules could be performed with several kinds of Raman reporters. Moreover, the characteristic spectral signatures from various distinct Raman labels require only a single laser excitation wavelength. However, with the increasing number of required codes, the Raman reporters involved in the encoded nanoprobes may become rather complicated. Although the amounts of available Raman reporters are abundant, similar structures of these reporter molecules make it difficult to be distinguished quite well, because many reporters have the similar chemical bonds. The above factors restrict the number of codes that can be realized practically. As far as we know, less than 10 kinds of SERS codes have been obtained.10,23 Therefore, an optical encoding method with increased encoding capacity is still required.

Here, a wavenumber–intensity joint SERS spectral encoding method has been demonstrated, where numerous different SERS characteristic signatures can be obtained using only a few Raman reporters. Silver nanoparticles (Ag NPs) were chosen as the SERS substrates while 1,4-benzenedithiol (BDT), 2-naphthalenethiol (2-NAT) and 4-methoxythiophenol (4-MT) were selected as Raman reporters. By tuning the molar ratios of three kinds of Raman reporters, SERS spectra with differences in wavenumber or intensity ratio were acquired. In total, 19 different ternary combinations were achieved. The multiplexing capacity is determined not only by the type of the Raman labels but also by the stoichiometric ratio as an additional parameter. Subsequently, these Raman reporter functionalized-silver nanoparticles were coated with a dense layer of silica for further surface modification. Furthermore, after being conjugated with specific antibodies, the SERS encoded nanoprobes could be utilized for tumor cell targeting.

Experiment

Materials

Silver nitrate (AgNO3), poly(vinylpyrrolidone) (PVP, MW 8000), poly(ethyleneimine) (PEI, MW 10[thin space (1/6-em)]000), tetraethoxysilane (TEOS), glutaraldehyde (GA, 50% aqueous solution) and absolute ethanol were purchased from Alfa Aesar. 1,4-Benzenedithiol (BDT), 2-naphthalenethiol (2-NAT), 4-methoxythiophenol (4-MT) and transferrin were obtained from Sigma Aldrich. Trisodium citrate dehydrate was purchased from Shanghai Heiwei Co., Ltd. Mouse anti-HER2 monoclonal antibody was purchased from Fuzhou Maxim Biotech, Inc. Deionized water with a resistivity of 18 MΩ cm−1 was used in all the experiments.

Preparation of Ag nanoparticles (denoted as Ag NPs)

The Ag NPs were prepared as described by Lee and Meisel.24 Briefly, AgNO3 solution (50 mL, 10 mM) in 500 mL of deionized water was boiled under continuous stirring. Then, 10 mL of 1% sodium citrate was added. The mixture was boiled with stirring for about 1 h. The final prepared Ag nanoparticles were greenish yellow in color.

Preparation of the Raman reporter-functionalized Ag NPs (denoted as Ag@reporter NPs)

Raman reporters were adsorbed on the surfaces of Ag NPs to generate SERS signals. 5 μL of 1,4-benzenedithiol (BDT), 2-naphthalenethiol (2-NAT) and 4-methoxythiophenol (4-MT) ethanol solutions (10 mM) were added to 5 mL of the as-prepared Ag NPs solution and stirred for 4 h at room temperature. Two or three Raman reporter co-functionalized Ag NPs were prepared in the similar way. The only difference was that a mixture of Raman reporter solution was added instead of single type of Raman reporter solution. The details of molar ratios used in different codes are listed in Table S1 (ESI).

Silica encapsulating of the SERS reporter-functionalized Ag NPs (denoted as Ag@reporter@SiO2 NPs)

The as-prepared Ag@reporter NPs were coated with an outer silica shell by a modified Stöber method.25 Typically, 1 mL of 25 mg mL−1 PVP aqueous solution was added to 5 mL of the Ag@reporter solution and gently stirred for 15 h. The mixture was centrifuged once at 6500 rpm for 15 min and the precipitate was dispersed in 5 mL of ethanol. Then 150 μL of ammonia water (25 wt%) was added. The growth of the outer silica shell was initiated by 5 injections of 2 μL TEOS into the above mixture with an interval of 30 min. The reaction was further continued for 8 h. Finally, the silica coated SERS active Ag@reporter@SiO2 NPs were collected by centrifugation at 6000 rpm for 15 min and washed repeatedly with ethanol and deionized water. The purified Ag@reporter@SiO2 NPs were finally suspended in 5 mL of deionized water.

Conjugation of antibody

The SERS encoder with a cancer cell targeting ability was acquired by covalently conjugating antibodies on the surfaces of the Ag@reporter@SiO2 NPs. In a typical experiment, 50 μL of 10% PEI aqueous solution was added to 5 mL of the as-synthesized Ag@reporter@SiO2 solution and gently stirred for 1 h. Afterwards, the excess PEI was removed by centrifugation thrice at 6000 rpm for 15 min. Then, antibodies were conjugated to nanoparticles using the well-established glutaraldehyde spacer method.26 After purification, the sediment was re-dispersed in 5 mL of 1% GA aqueous solution and the mixture was left reacting for 1 h. Then, the GA modified nanoparticles were separated from solution by centrifugation at 6000 rpm for 15 min. After removal of the excess GA in supernatant, the sediment was resuspended in 5 mL of deionized water. Afterwards, 250 μL of anti-HER2 monoclonal antibody (or transferrin) solution was added and then reacted with these aldehyde groups modified nanoparticles for 2 h. The antibody conjugated-nanoparticles were further purified by centrifugation at 5000 rpm for 10 min. The supernatant solution was discarded and the precipitated particles were redispersed in 5 mL of deionized water.

Cell culture

SKBR3 breast cancer cells, human cervical cancer (HeLa) cells and human embryonic lung fibroblasts (MRC5) cells were purchased from the Cell Bank of Type Culture Collection of the Chinese Academy of Sciences and cultured in Dulbecco's modified Eagle's media (DMEM) under a humidified atmosphere (5% CO2 plus 95% air) at 37 °C. Media were supplemented with 10% fetal bovine serum (Biochrom) and 1% penicillin–streptomycin (Nanjing KeyGen Biotech. Co., Ltd.).

In the targeting experiments, SKBR3 (HeLa) and MRC5 cells were seeded into tissue culture dishes (Corning) and incubated for 24 h. Then the targeting nanoprobe solution and the nontargeting nanoprobe solution were added to the cell culture dish. An hour later, the culture media were discarded and the culture dishes were gently washed with PBS buffer three times before SERS measurements. For each condition, one spectrum was collected in each cell and the measured SERS spectra of 10 cells were used to obtain an average SERS spectrum.

Instrument

Extinction spectra were measured by a Shimadzu UV-3600 PC spectrophotometer with quartz cuvettes of 1 cm path length. Transmission electron microscope (TEM) images were obtained with an FEI Tecnai G2T20 electron microscope operating at 200 kV. A high speed centrifuge (2-16PK, Sigma, Germany) was used for sample purification. SERS measurements were performed with a confocal microscope (FV 1000, Olympus). The Raman scattering light was directed to an Andor shamrock spectrograph equipped with a charge-coupled device (CCD). He–Ne laser (Melles Griot, 05-LHP-991) with 632.8 nm radiation was used for excitation and the laser power at the sample position was 2.38 mW. All the spectra here were the results of a 60 s accumulation.

Results and discussion

Synthesis and characterization of the SERS encoders

The design of SERS encoders is schematically illustrated in Scheme 1A. Basically, silver nanospheres were used as the SERS-active substrates, on which Raman reporters were adsorbed as the coding agents. Then, a layer of silica shell was coated for both protecting Raman reporters from the surroundings and providing a platform for further surface modifications.
image file: c4ra11522h-s1.tif
Scheme 1 (A) Schematic preparation of the encoded SERS nanoprobes; (B) color-coded SERS spectra of individual Raman reporter: BDT (red), 2-NAT (green) and 4-MT (blue).

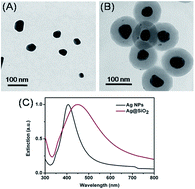
In our experiments, the silver nanospheres with a diameter of around 60 nm were prepared and shown in Fig. 1A, consistent with the DLS data shown in Fig. S1 (ESI). Subsequently, the Raman reporters were adsorbed onto the surfaces of the Ag NPs through their thiol groups. Here, we chose three kinds of commercially available aromatic compounds, i.e. 1,4-benzenedithiol (BDT), 2-naphthalenethiol (2-NAT) and 4-methoxythiophenol (4-MT) as the Raman reporters. These Raman reporters all have large Raman scattering cross-sections and exhibit intense SERS signals (Scheme 1B). As reported previously, these Raman reporters can self-assemble on the Ag nanosphere surfaces to form monolayers.27,28


image file: c4ra11522h-f1.tif
Fig. 1 (A) TEM image of Ag NPs; (B) TEM image of Ag@reporter@SiO2 NPs; (C) extinction spectra of Ag NPs and Ag@reporter@SiO2 NPs.

After the Ag@reporter NPs were prepared, an outer silica layer was obtained by a modified Stöber method.25 In order to get a more uniform silica shell, the Ag@reporter NPs were first coated by the amphiphilic, nonionic polymer PVP and then transferred to ethanol solution. Further, after the injection of a proper amount of ammonia and TEOS, a smooth silica shell with a thickness of ∼35 nm was formed (Fig. 1B). Fig. 1C shows the extinction spectra of both Ag NPs and Ag@reporter@SiO2 NPs. Comparing the two curves in Fig. 1C, it can be observed that the silica coating process induced a red shift of the extinction peak about 50 nm of the Ag NPs due to the increase in the refractive index.29

This result corresponds well with the fact that only a single Ag NP was encapsulated in each silica nanoparticle (Fig. 1B), because no obvious extinction band is observed in the long wavelength range, which was usually related with the aggregation of Ag NPs.30

SERS spectra of three different nanoprobes as Ag@BDT, Ag@2-NAT and Ag@4-MT are shown in Fig. 2 with the chemical structures of three molecules. As shown in Fig. 2, all of the three kinds of SERS nanoprobes display strong and unique spectroscopic signatures. Typically, BDT shows two dominant SERS peaks at 1565 and 1180 cm−1, which are assigned to modes ν8a and ν9a. The Raman band at 1080 cm−1 is ascribed to the ν1 fundamental in Fermi resonance with a combination mode consisting of ν6a + ν7a and that at 730 cm−1 is attributed to modes ν7a.31,32 Moreover, 2-NAT exhibits characteristic SERS peaks at 1621 and 1378 cm−1 dominated by ring modes. Besides, the Raman band at 1080 cm−1 is attributed to the C–H bending and that at 767 cm−1 is ascribed to the ring deformation.33,34 Meanwhile, 4-MT presents two at 1081 and 1591 cm−1, which are assigned to C–C stretching vibration. The Raman band at 794 cm−1 is ascribed to the C–H bending.31–35 Importantly, when the mixture of BDT, 2-NAT and 4-MT was used, signal peaks at 730, 767 and 794 cm−1 can be observed simultaneously without spectroscopic overlap. Thus, it should allow the easy identification of the corresponding targets in a mixture with multiplex analytes. In the following experiments, the above three SERS bands are used for encoding.


image file: c4ra11522h-f2.tif
Fig. 2 SERS spectra of three SERS nanoprobes and the chemical structures of encoded Raman reporters: (a) BDT, (b) 2-NAT and (c) 4-MT.

Encoding capacity of SERS encoder

For multiplex detection applications, the encoding capacity of such a SERS encoder was investigated. In our experiments, three Raman reporters as BDT, 2-NAT and 4-MT were individually or simultaneously conjugated to the surfaces of Ag NPs, yielding different SERS codes.

Using the existence information of SERS peaks at 730, 767 and 794 cm−1, in a traditional wavenumber encoding system, only 7 codes can be generated employing those three Raman reporters. However, on the basis of the combined information of wavenumber and intensity, a total of 19 codes were achieved experimentally with distinguished optical spectral signatures, whose components, structures, and measured optical spectra are listed in Fig. 3. To facilitate encoding, the intensity of characteristic peaks is divided into three levels labeled by number 0, 1 and 2, respectively. The number 0 represents no signal at a certain wavenumber, while the number 1 or 2 mean signal intensity information at a particular wavenumber. For instance, the characteristic peak at 730 cm−1 from BDT possesses approximately equal intensity of the 2-NAT peak at 767 cm−1 while no peak at 794 cm−1 corresponding to 4-MT appears, which results in a spectrum with code ‘110’. In the case of code ‘120’, the intensity of 730 cm−1 is only half of that at 767 cm−1. Another case is that the intensity of 730 cm−1 is twice of that at 767 cm−1. As a result, a spectrum with code ‘210’ is obtained.


image file: c4ra11522h-f3.tif
Fig. 3 Codes, structures and measured spectra of the synthesized 19 SERS encoders. The spectra are only shown from wavenumber 600 to 900 for clarity.

According to the encoding rule mentioned above, SERS encoders can be classified as nanoprobes containing one-, two-, or three-components. In the first case, Ag NPs were functionalized with each reporter individually. Moreover, the obtained codes, named as 100, 010 and 001, corresponded directly with each fingerprint signature. Under second situation, the SERS encoders with BDT/2-NAT (Code ‘110’, ‘120’ and ‘210’), BDT/4-MT (Code ‘101’, ‘102’ and ‘201’) and 2-NAT/4-MT (Code ‘011’, ‘012’ and ‘021’) provided nine distinguished SERS spectra. Finally, SERS encoders functionalized with three types of Raman reporters together were acquired. Spectra of codes (‘111’, ‘112’, ‘121’, ‘211’, ‘122’, ‘212’, ‘221’) exhibit the SERS bands of BDT at 730 cm−1, 2-NAT at 767 cm−1 and 4-MT at 794 cm−1 simultaneously, but display differences in relative intensities of SERS signals. As a result, SERS encoders containing different amount of BDT, 2-NAT and 4-MT can be spectrally distinguished from each other.

Although, in principle, the same number of codes can be acquired by using more kinds of Raman reporters in a wavenumber-dependent SERS encoding system, the preparation process will become rather complicated or even unpractical because of the problems of spectral overlap or limited available types of Raman reporters. However, in the wavenumber–intensity joint SERS encoding approach, enlarging the number of codes is much easier and more feasible due to the following reason. One thing worth noting is that as an example, the above SERS encoders are acquired only with three different levels of signal intensity. Actually, a much larger number of codes will be generated when more levels of intensity are introduced, which can be realized by controlling the amount of each reporters more accurately.

Cancer cell targeting ability of SERS encoders

Further, to demonstrate the ability of the encoded nanoparticles in cancer cell targeting, SERS encoders with code as ‘100’ and ‘010’ were chosen as the models to target human breast cancer cells (SKBR3 cells) and human cervical cancer cells (HeLa cells), which were modified with anti-HER2 antibody and transferrin, respectively (Scheme 2). After modifying the surfaces of the encoded nanoparticles with amino groups by PEI, specific antibodies were conjugated to the silica shell using glutaraldehyde spacer method. Thus the SERS encoded nanoprobes for tumor cell targeting were obtained.
image file: c4ra11522h-s2.tif
Scheme 2 Schematic illustration of tumor cell targeting based on the synthesized SERS encoder.

Since overexpression of epidermal growth factor receptor 2 (HER2) has been found in SKBR3 cells,36–38 the anti-HER2 antibody decorated NPs can be internalized prodigiously by the SKBR3 cells through receptor-mediated endocytosis.39 Thus, SKBR3 cells which overexpress HER2 receptors on their membranes were chosen as the model target cancer cells, while anti-HER2 antibody free probes and HER2 receptor negative human embryonic lung fibroblasts (MRC5) cells were chosen as the negative controls to examine the targeting ability of the nanoprobe with code ‘100’. After being incubated with the corresponding nanoprobes, SERS spectra from nanoprobes in three different conditions were all collected and shown in Fig. 4. SKBR3 cells incubated with the targeting probes (Fig. 4C and D) generated much stronger SERS signals than SKBR3 cells incubated with the anti-HER2 antibody free control probes (Fig. 4E and F) and MRC5 cells incubated with the targeting probes (Fig. 4G and H). According to Fig. 4B, SERS signals measured from SKBR3 cells incubated with the targeting nanoprobes are about 2.4 times higher than those from the two controls. The signal to noise ratio (SNR) at 730 cm−1 under the three different conditions were 1.089, 1.039 and 1.038, respectively, supporting that more targeting nanoprobes were taken up efficiently by the HER2 receptor over-expressed SKBR3 cells. These results showed that the proposed targeting nanoprobe can recognize HER2 overexpressed cancer cells with a high selectivity and improve the cellular uptake of the targeting nanoprobes through the HER2-receptor mediated endocytosis.


image file: c4ra11522h-f4.tif
Fig. 4 (A) SERS spectra of the nanoprobes in living cells under different conditions; for each situation, the SERS spectra were collected from 10 randomly selected cells and average results were presented; (B) SERS intensities of the bands at 730 cm−1 correspond to the Fig. 4A, the error bars represent the standard deviation of 10 measurements; (C and D) SERS mapping of SKBR3 cells incubated with the targeting probe; (E and F) SERS mapping of SKBR3 cells incubated with the anti-HER2 antibody free probe; (G and H) SERS mapping of MRC5 cells incubated with the targeting probe.

Once the anti-HER2 antibody-conjugated SERS encoder with code ‘100’ was determined to be capable of targeting SKBR3 cells, the general applicability of the tumor cell targeting was investigated by using transferrin-conjugated SERS encoder with code ‘010’ to target HeLa cells (Scheme 2B). In the experiments, HeLa cells were chosen as the model target cancer cells due to its abundant transferrin receptors. Transferrin free probes and transferrin receptor negative MRC5 cells were chosen as the negative controls. The experimental results showed that the SERS encoder with code ‘010’ exhibited fine targeting performance as well as the SERS encoder with code ‘100’ (Fig. S2, ESI). Therefore, the presented SERS encoder can indeed target multiple cancer cell types.

By selecting the SERS encoder with different optical codes, which are functionalized with different targeting antibodies, more SERS encoders with targeting ability for multiplex tumor cells can be achieved. Moreover, the SERS encoded nanoprobe is not limited to tumor cell targeting since its encoding method can be utilized in immunoassay as well as DNA detection. It should be noted that utilizing our demonstrated SERS encoding method, 19 different analytes could be simultaneously detected using only three kinds of Raman reporters. The wavenumber and intensity joint SERS encoding would have a great potential in encoding techniques and own promising applications in multiplex detection.

Conclusions

In conclusion, a SERS encoding method based on wavenumber–intensity joint SERS spectra has been proposed using Ag NPs. When three kinds of Raman reporters were employed, the number of available codes could be increased by taking both signal wavenumber and intensity into account. As a proof-of-concept experiment, after being conjugated with specific antibodies, the encoded nanoprobes can be used for multiplex tumor cell targeting. We anticipate that this wavenumber–intensity joint encoding technology may enhance the encoding capacity in optical encoding systems, which could have promising prospects in high-throughput bioanalysis.

Acknowledgements

This work was supported by the National Key Basic Research Program of China (Grant no. 2015CB352002), Natural Science Foundation of China (NSFC) (nos 61275182, 61177033, 21104009), Excellent Youth Foundation of Jiangsu Province (BK20140023), the Excellent Youth Scholars of Southeast University, the Scientific Research Foundation of Graduate School of Southeast University (YBJJ1125), the Scientific Innovation Research Foundation of College Graduate in Jiangsu Province (KYLX_0128) and the Fundamental Research Funds for the Central Universities.

Notes and references

  1. S. Zhang, G. Han, Z. Xing, S. Zhang and X. Zhang, Anal. Chem., 2014, 86, 3541–3547 CrossRef CAS PubMed.
  2. Z. Wang, S. Zong, W. Li, C. Wang, S. Xu, H. Chen and Y. Cui, J. Am. Chem. Soc., 2012, 134, 2993–3000 CrossRef CAS PubMed.
  3. S. B. Lowe, J. A. G. Dick, B. E. Cohen and M. M. Stevens, ACS Nano, 2012, 6, 851–857 CrossRef CAS PubMed.
  4. H. Jang, S.-R. Ryoo, Y.-K. Kim, S. Yoon, H. Kim, S. W. Han, B.-S. Choi, D.-E. Kim and D.-H. Min, Angew. Chem., Int. Ed., 2013, 52, 2340–2344 CrossRef CAS PubMed.
  5. F. Zhang, Q. Shi, Y. Zhang, Y. Shi, K. Ding, D. Zhao and G. D. Stucky, Adv. Mater., 2011, 23, 3775–3779 CAS.
  6. H. H. Gorris, R. Ali, S. M. Saleh and O. S. Wolfbeis, Adv. Mater., 2011, 23, 1652–1655 CrossRef CAS PubMed.
  7. J. Hu, M. Xie, C.-Y. Wen, Z.-L. Zhang, H.-Y. Xie, A.-A. Liu, Y.-Y. Chen, S.-M. Zhou and D.-W. Pang, Biomaterials, 2011, 32, 1177–1184 CrossRef CAS PubMed.
  8. K. Braeckmans, S. C. De Smedt, M. Leblans, R. Pauwels and J. Demeester, Nat. Rev. Drug Discovery, 2002, 1, 447–456 CrossRef CAS PubMed.
  9. Y. J. Zhao, H. C. Shum, H. S. Chen, L. L. A. Adams, Z. Z. Gu and D. A. Weitz, J. Am. Chem. Soc., 2011, 133, 8790–8793 CrossRef CAS PubMed.
  10. N. Guarrotxena and G. C. Bazan, Adv. Mater., 2014, 26, 1941–1946 CrossRef CAS PubMed.
  11. J.-M. Li, C. Wei, W.-F. Ma, Q. An, J. Guo, J. Hu and C.-C. Wang, J. Mater. Chem., 2012, 22, 12100–12106 RSC.
  12. Q. Ma, I. Castello Serranoa and E. Palomares, Chem. Commun., 2011, 47, 7071–7073 RSC.
  13. J. A. Dougan and K. Faulds, Analyst, 2012, 137, 545–554 RSC.
  14. Y. Wang, B. Yan and L. Chen, Chem. Rev., 2013, 113, 1391–1428 CrossRef CAS PubMed.
  15. W. E. Doering and S. M. Nie, Anal. Chem., 2003, 75, 6171–6176 CrossRef CAS PubMed.
  16. C. Fernandez-Lopez, C. Mateo-Mateo, R. A. Alvarez-Puebla, J. Perez-Juste, I. Pastoriza-Santos and L. M. Liz-Marzan, Langmuir, 2009, 25, 13894–13899 CrossRef CAS PubMed.
  17. J. H. Kim, J. S. Kim, H. Choi, S. M. Lee, B. H. Jun, K. N. Yu, E. Kuk, Y. K. Kim, D. H. Jeong, M. H. Cho and Y. S. Lee, Anal. Chem., 2006, 78, 6967–6973 CrossRef CAS PubMed.
  18. X. H. Xia, W. Y. Li, Y. Zhang and Y. N. Xia, Interface Focus, 2013, 3, 20120092 CrossRef PubMed.
  19. G. Wang, H.-Y. Park and R. J. Lipert, Anal. Chem., 2009, 81, 9643–9650 CrossRef CAS PubMed.
  20. M. Gellner, K. Koempe and S. Schluecker, Anal. Bioanal. Chem., 2009, 394, 1839–1844 CrossRef CAS PubMed.
  21. B. H. Jun, M. S. Noh, J. Kim, G. Kim, H. Kang, M. S. Kim, Y. T. Seo, J. Baek, J. H. Kim, J. Park, S. Kim, Y. K. Kim, T. Hyeon, M. H. Cho, D. H. Jeong and Y. S. Lee, Small, 2010, 6, 119–125 CrossRef CAS PubMed.
  22. M. A. Woo, S. M. Lee, G. Kim, J. Baek, M. S. Noh, J. E. Kim, S. J. Park, A. Minai-Tehrani, S. C. Park, Y. T. Seo, Y. K. Kim, Y. S. Lee, D. H. Jeong and M. H. Cho, Anal. Chem., 2009, 81, 1008–1015 CrossRef CAS PubMed.
  23. Y. H. Zhao, W. Q. Luo, P. Kanda, H. W. Cheng, Y. Y. Chen, S. P. Wang and S. Y. Huan, Talanta, 2013, 113, 7–13 CrossRef CAS PubMed.
  24. P. C. Lee and D. Meisel, J. Phys. Chem., 1982, 86, 3391–3395 CrossRef CAS.
  25. C. Graf, D. L. J. Vossen, A. Imhof and A. van Blaaderen, Langmuir, 2003, 19, 6693–6700 CrossRef CAS.
  26. A. Biebricher, A. Paul, P. Tinnefeld, A. Golzhauser and M. Sauer, J. Biotechnol., 2004, 112, 97–107 CrossRef CAS PubMed.
  27. B. Kuestner, M. Gellner, M. Schuetz, F. Schoeppler, A. Marx, P. Stroebel, P. Adam, C. Schmuck and S. Schluecker, Angew. Chem., Int. Ed., 2009, 48, 1950–1953 CrossRef PubMed.
  28. A. Taglietti, Y. A. D. Fernandez, P. Galinetto, P. Grisoli, C. Milanese and P. Pallavicini, J. Nanopart. Res., 2013, 15, 2047 CrossRef.
  29. C.-Y. Chiu and M. H. Huang, Angew. Chem., Int. Ed., 2013, 52, 12709–12713 CrossRef CAS PubMed.
  30. S. Liu and Z. Tang, J. Mater. Chem., 2010, 20, 24–35 RSC.
  31. S. H. Cho, H. S. Han, D. J. Jang, K. Kim and M. S. Kim, J. Phys. Chem., 1995, 99, 10594–10599 CrossRef CAS.
  32. S. W. Joo, S. W. Han and K. Kim, J. Colloid Interface Sci., 2001, 240, 391–399 CrossRef CAS PubMed.
  33. R. A. Alvarez-Puebla, D. S. Dos Santos and R. F. Aroca, Analyst, 2004, 129, 1251–1256 RSC.
  34. A. Matschulat, D. Drescher and J. Kneipp, ACS Nano, 2010, 4, 3259–3269 CrossRef CAS PubMed.
  35. B. H. Jun, J. H. Kim, H. Park, J. S. Kim, K. N. Yu, S. M. Lee, H. Choi, S. Y. Kwak, Y. K. Kim, D. H. Jeong, M. H. Cho and Y. S. Lee, J. Comb. Chem., 2007, 9, 237–244 CrossRef CAS PubMed.
  36. J. Li, Y.-L. An, F.-C. Zang, S.-F. Zong, Y.-P. Cui and G.-J. Teng, J. Nanopart. Res., 2013, 15, 1980 CrossRef.
  37. J. Yang, Z. Wang, S. Zong, C. Song, R. Zhang and Y. Cui, Anal. Bioanal. Chem., 2012, 402, 1093–1100 CrossRef CAS PubMed.
  38. T. Miyano, W. Wijagkanalan, S. Kawakami, F. Yamashita and M. Hashida, Mol. Pharm., 2010, 7, 1318–1327 CrossRef CAS PubMed.
  39. M. Il Kim, M. S. Kim, M.-A. Woo, Y. Ye, K. S. Kang, J. Lee and H. G. Park, Nanoscale, 2014, 6, 1529–1536 RSC.

Footnote

Electronic supplementary information (ESI) available. See DOI: 10.1039/c4ra11522h

This journal is © The Royal Society of Chemistry 2014
Click here to see how this site uses Cookies. View our privacy policy here.