Li-yang Xua,
Huai-wen Yana,
Lei Gongb,
Bo Yin*a and
Ming-bo Yanga
aCollege of Polymer Science and Engineering, State Key Laboratory of Polymer Materials Engineering, Sichuan University, Chengdu, 610065, Sichuan, China. E-mail: yinbo@scu.edu.cn; Tel: +86-28-85405324
bDepartment of Environment and Chemical Engineering, Dalian University, Dalian, 116622 Liaoning, China
First published on 4th December 2014
Modified graphene oxide (GO) not only offers a wrinkled structure but may also transform the crystal structure, giving it a potential application in high performance polymer/filler composites. In this work, alkylated graphene oxide (GO–ODA) is obtained via mutual electrostatic interaction between the epoxide group of GO and the amine group of octadecylamine (ODA). Then nanocomposites are obtained via introducing different contents of GO–ODA to poly(4-methy-1-pentene) (PMP or TPX) using a solution approach. It is found that the obtained GO–ODA has no effect on the crystallinity of TPX. It is worth noting that GO–ODA changes the crystal structure. GO, as a kind of nanofiller, is used to change the crystal structure of polymer/filler composites for the first time, which is an important finding and obviously provides a good example to widen the application of GO.
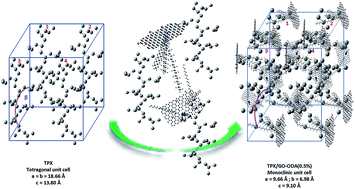
Graphene oxide (GO), as an excellent material, has attracted tremendous attention in recent years.14,15 It is a compound of carbon, oxygen, and hydrogen in variable ratios, formerly called graphitic oxide or graphitic acid. The structure and properties of graphene oxide depend on the particular synthesis method, degree of oxidation16–19 and how it typically preserves the layer structure of the parent graphite, although the layers are buckled and the interlayer spacing is much larger than that of graphite.16 The as obtained GO sheets have a lot of epoxy, hydroxyl and carboxyl functional groups on the basal plane. As a result graphene oxide can disperse readily in most polar solvents such as water, breaking up into macroscopic flakes, which are mostly one layer thick. However, graphene oxide is polar, therefore, it doesn’t get a good dispersion in non-polar polymers. Despite this, GO has been developed over the course of small molecule organic chemistry, as the ionization of the carboxyl groups means we can change the polarity of GO. Recently, researchers have introduced graphene oxide to the surface of amorphous glass fibers (GFs) to induce interfacial crystallization between a semi-crystalline polymer and a GF.20 This motivated us to ask if GO could be dispersed in TPX via an electrostatic assembling method, such as with alkylated graphene oxide, which may enhance the nucleation ability on semicrystalline polymers. The wrinkled structure of the modified GO may also change the crystalline structure of the semi-crystalline polymers.
Many researchers have studied the crystal structure, morphology and crystallization dynamics of TPX as a test material in many investigations, and some have investigated the properties of blends that consist of TPX and some organic21,22 or inorganic nanofillers.23,24 To date, almost no people have studied the effect of graphene on TPX. Therefore, in this work, we first carry out the modification of GO with octadecylamine (ODA) via electrostatic self-assembly. After the GO–ODA has been dispersed in TPX by solution blending, the crystallization behavior of TPX/GO–ODA nanocomposites is investigated. Our goal is two-fold: one is to find out if GO could change the crystal structure of TPX, and the other is to explore some new applications of GO.
Melting temperature (Tm) | Melt flow rate (260 °C per 5 kg) | Dielectric constant | Transparency | Density |
---|---|---|---|---|
232 °C | 26 g per 10 min | 2.12 | 94% | 0.833 g cm−3 |
The graphene oxide (GO) was obtained via the “Improved Hummers’ method”,25 in which the oxidation procedure (KMnO4 and a 9:
1 mixture of concentrated H2SO4–H3PO4) could be used to prepare improved GO with fewer defects in the basal plane as compared to the GO prepared by the Hummers’ method.26 For surface modification, the graphene oxide was dispersed in 100 mL of distilled water (2 mg mL−1) via ultrasonication with a KQ-400KDB ultrasonicator. Then, the graphene oxide solution was centrifuged for 30 min at 4000 rpm to remove the unexfoliated graphene oxide. Octadecylamine (ODA 900 mg) was dissolved in ethanol and the solution was added into the graphene oxide solution, followed by stirring at 90 °C for 20 h. Nucleophilic substitution occurred through the amine functionality of ODA to the epoxy functionality of GO. The final product was washed with water–ethanol mixture to remove the excess ODA adsorbed on the surface of the modified graphene (GO–ODA). The resulting black powder was dried under vacuum at 50 °C for 24 h.27,28
The present results show that TPX can be dissolved in cyclohexane,1 so the poly(4-methyl-1-pentene) was dissolved with cyclohexane in a three-necked flask, which was maintained at a constant temperature of about 50 °C. At the same time, the modified graphene solution, after ultrasonication for 30 min, was added to the above three-necked flask. When the TPX had dissolved perfectly, after ultrasonicating for 60 min, the solution was poured into a glass template, evaporating the solvent. Finally, we got the product. In this research, the proportions of GO–ODA in the nanocomposites were: 0.1 wt%, 0.2 wt%, 0.5 wt% and 1.0 wt%.
The calorimetric properties of the samples were studied using a differential scanning calorimeter (DSC TA Q20). The apparatus was calibrated with pure indium at various scanning rates. After eliminating any thermal history, each sample was heated/cooled from 40 °C to 250 °C at a rate of 10 °C min−1 with dry nitrogen gas during the measurements. The heat flow evolved during the scanning process was recorded as a function of temperature.
X-ray diffraction patterns were obtained on a DX-1000 automatic diffractometer operating at a step size of 0.02° with nickel-filtered Cu Kα radiation.
13C solid-state cross-polarization magic angle spinning (CP-MAS) NMR studies were conducted on the polymer samples recovered after crystallization using a Bruker AVANCE III spectrometer. In this paper, these NMR CP-MAS data were compared with the characteristic NMR patterns reported in the literature29,30 for the different crystalline forms of this polymer for assignment of the different crystalline forms that were generated in each given experiment.
TEM images of the GO–ODA sheets obtained from the solution consisting of cyclohexane and TPX are shown in Fig. 2. The GO–ODA clearly has a lamellar structure and a wrinkled structure with microcosmic distortions as previous research mentions.26
In addition, FTIR spectroscopy, as a powerful tool for the characterization of graphene and its derivatives, is also employed to demonstrate the successful grafting of ODA to GO. Fig. 3 shows the FTIR spectra of pure graphene oxide and GO–ODA. The typical peaks of GO appear at 1710 cm−1 (CO carboxyl stretching vibration), 1685 cm−1 (C
C in the aromatic ring) and 1385 cm−1 (C–OH stretching). Moreover, the wide peak appearing at 3000–3700 cm−1 could be assigned to the hydroxyl groups. The emergence of peaks at ∼2900 cm−1, corresponding to C–H stretching vibrations of CH3, CH2 and CH groups in the GO–ODA, indicates the successful modification of the graphene oxide, which obviously changes the polarity of GO.
XPS is employed to evaluate the chemical bonds formed on the surface of GO after its functionalization with ODA. Typically, the C 1s peak region of GO–ODA can be fitted into four curves, as shown in Fig. 4. The binding energies at 284.5 eV, 286.6 eV and 287.8 eV are assigned to unoxidized graphite carbon skeleton (C–C), hydroxyl group (C–OH) and epoxide group (–C–O–C–), respectively, which indicates a considerable degree of oxidation with four components. However, in the XPS spectrum a new peak at 285.2 eV corresponding to C–N appears, demonstrating the reaction of GO with ODA.
As shown in Fig. 5, there is no mass loss below 100 °C, which indicates enhanced hydrophobicity minimizing the amount of absorbed water. From 160 °C to 180 °C, there is a gradual mass loss of ∼10%, which is ascribed to the decomposition of the physically bonded ODA.31 These ODA molecules may be positively charged and electrostatically bonded with negatively charged carboxylic groups, which prevents them from being washed away by ethanol. Previous studies showed that the decomposition of chemically bonded amine occurs in the temperature range of 200–500 °C.32–34 Therefore, the high weight loss rate of GO–ODA at 365 °C is due to the decomposition of covalently bonded ODA, together with the decomposition of GO.
Differential scanning calorimetry (DSC) was used to study the melting and crystallization behavior of the samples with different loadings of the fillers, and some parameters are presented in Table 2. It is worth noting that the twin peaks of the melting curve transform into a single peak with increasing content of GO–ODA, as shown in Fig. 6(a). As can be seen from Fig. 6(b), the crystallization peaks of the samples are not shifted and are centred at about T = 211.6 ± 0.6 °C. Furthermore, these parameters (melting point, fusion enthalpy) of the five samples show little difference. These results indicate that GO–ODA has no effect on fusion enthalpy. In other words, GO–ODA makes no contribution to the crystallinity of the samples.
Tm (°C) | Tc (°C) | ΔH (J g−1) | |
---|---|---|---|
TPX | 232.7 | 212.2 | 37.83 |
TPX/GO–ODA0.1% | 232.5 | 211.2 | 40.88 |
TPX/GO–ODA0.2% | 234.5 | 211.9 | 36.32 |
TPX/GO–ODA0.5% | 234.9 | 211.5 | 36.75 |
TPX/GO–ODA1.0% | 233.4 | 211.4 | 37.92 |
To further demonstrate the crystal structure of TPX, we investigated the XRD spectra of the samples. The intra-gallery space of GO–ODA is enlarged at 2θ = 5.63°, as shown in Fig. 7(a), which confirms the intercalation of ODA.27 Fig. 7(b) shows the XRD patterns of the nanocomposites with different GO–ODA contents. We can observe that the GO–ODA has no diffraction peaks in the XRD patterns of the nanocomposites. In the present reports, TPX has five crystalline modifications with X-ray diffraction profiles. We can determine that our pure sample is Form I. The typical diffraction peaks of TPX appear at 2θ = 9.524°, 13.428°, 16.725° and 18.328°, and the miller indexes are listed in Table 3. Compared to the diffraction peak of TPX at 2θ = 9.524°, corresponding to crystal plane (200), the peak for TPX/GO–ODA (0.5 wt% and 1.0 wt%) is shifted to 9.930° (Table 4). The TPX/GO–ODA (0.1 wt% and 0.2 wt%) nanocomposites retain the crystal face (200). However, the intensity of the diffraction peaks located at 2θ = 13–25° becomes weak. In general, as the GO–ODA content increases, the diffraction peaks at 2θ = 9.524° offset, and the medium content nanocomposites exhibit twin diffraction peaks because of the nanofiller. Finally, the results of DSC and XRD demonstrate that the crystal structure was transformed.
![]() | ||
Fig. 7 The X-ray diffraction patterns of the samples: (a) GO–ODA; (b) nanocomposites with different nanofiller contents. |
2-Theta (°) | d (Å) | hkl | a-Axis (Å) | c-Axis (Å) |
---|---|---|---|---|
9.524 | 9.279 | 200 | 18.5577 | — |
13.428 | 6.589 | 220 | 18.6355 | — |
16.725 | 5.296 | 212 | 18.5577 | 13.7587 |
18.328 | 4.837 | 321 | 18.5577 | 14.1445 |
20.567 | 4.315 | 113 | 18.5577 | 13.7067 |
21.478 | 4.134 | 322 | 18.5577 | 13.8776 |
TPX/GO–ODA (0.5%) | TPX/GO–ODA (1.0%) | ||||
---|---|---|---|---|---|
2-Theta (°) | d (Å) | hkl | 2-Theta (°) | d (Å) | hkl |
9.930 | 8.900 | 001 | 9.930 | 8.900 | 001 |
18.825 | 4.710 | 200 | 18.825 | 4.710 | 200 |
22.902 | 3.880 | 210 | 22.902 | 3.880 | 210 |
In addition, solid-state 13C NMR CP-MAS is also employed to further demonstrate the crystal modifications of TPX. Fig. 8 shows the solid-state 13C NMR CP-MAS spectra of the samples. We can observe that there is no “C” signal of GO–ODA in Fig. 8(b). Based on comparisons with the literature,30 the original polymer and recrystallized polymer from cyclohexane without GO–ODA are crystal modification Form I, as shown in Fig. 8(c) and (d). However, in the spectra of the TPX/GO–ODA nanocomposites (Fig. 8(e)–(h)), an obvious new peak appeared with a CS (or chemical shift) of about 31.0 ppm (the “N” peak). We propose that the GO–ODA is arranged at a specific location in the crystal lattice of TPX, and distorts the backbone or side groups of TPX, leading to the crystal structure change. This result is consistent with the XRD data.
The above results demonstrate that the modified GO has no effect on the crystallinity of the samples. This could be because the alkane groups of GO–ODA and the side groups of TPX have become entangled. Furthermore, the wrinkled and rough texture of GO–ODA may have an effect on the arrangement of the molecular chain. Obviously, GO–ODA could lead to the crystal transition of samples. Therefore, a new crystal structure could be successfully obtained.
For further analysis, we can obtain the simulation unit cell parameters according to the above XRD data and the solid-state 13C NMR CP-MAS analysis. The unit cell projections of TPX and TPX/GO–ODA are shown in Fig. 9, and the unit cell parameter of TPX is consistent with the literature. We found that TPX/GO–ODA (0.5%, 1%) had chain packing in a monoclinic unit cell with a = 9.66 Å, b = 6.98 Å and c = 9.1 Å.
This journal is © The Royal Society of Chemistry 2015 |