Nicolas Papaiconomou*abc,
Nicolas Glandutd,
Isabelle Billardcef and
Eric Chainetbc
aUnive. Savoie Mont-Blanc, LEPMI, F-73000, Chambéry, France
bUniv. Grenoble-Alpes, LEPMI, F-38000, Grenoble, France
cCNRS, LEPMI, F-38000, Grenoble, France
dSPCTS, UMR 7315, CNRS, University of Limoges, European Ceramics Center, France. E-mail: nicolas.glandut@unilim.fr
eUniversité de Strasbourg, IPHC, 23 rue du Loess, 67037 Strasbourg, France. E-mail: isabelle.billard@iphc.cnrs.fr; Tel: +33 388106401
fCNRS, UMR 7178, 67037 Strasbourg, France
First published on 28th October 2014
The electrochemistry of AuBr4− complexes extracted into ionic liquids [C8PYR][NTf2] or [C8MIM][NTf2] saturated with water and gas has been studied by cyclic voltammetry on a glassy carbon macro electrode and by linear voltammetry on a platinum microelectrode. Unlike AuCl4−, the reduction of AuBr4− to Au(0) is achieved following a one reduction step involving three electrons. The deposition of Au(0) from AuBr4− is carried out at a potential above that of water, leading to the simple and easy deposition of gold and subsequently to the extraction of AuBr4− into an ionic liquid.
Nevertheless, a successful gold extraction process necessarily needs to achieve not only high distribution coefficients, but also to provide a facile and energetically favourable recovery of gold from the extracting phase.
Previous reports have studied the electrochemical behaviour of tetrachloroaurate(III) complexes in neat ionic liquids, revealing a two-steps reduction of Au(III) towards Au(I) and Au(0). However, no study so far has reported the electrochemistry of another interesting gold(III) complex anion, namely AuBr4−, within an ionic liquid.
The objectives of this article are first to study the electrochemistry of AuBr4− in ionic liquids and compare it to that of AuCl4− species and second to investigate on a simple process for the recovery of gold(III) from an ionic liquid subsequently to the extraction of AuBr4− towards an ionic liquid.
To that end, electrochemistry of AuBr4− in 1-octylpyridinium bis(trifluoromethanesulfonyl)imide ([C8PYR][NTf2]) and 1-octyl-3-methylimidazolium bis(trifluoromethylsulfonyl)imide ([C8MIM][NTf2]) is reported here. [C8PYR][NTf2] was chosen because high distribution coefficients for AuBr4− in this ionic liquid were obtained and because it is known to exhibit a water-content lower than those of other ionic liquids such as those based on imidazolium for instance.2,3 [C8MIM][NTf2] was chosen because it is a member of the most studied family of ionic liquids in the literature. In addition, using this ionic liquid allowed comparison of our results with those previously reported for the voltammetric study of AuCl4− in [C4MIM][NTf2] (1-butyl-3-methylimidazolium bis(trifluoromethanesulfonyl)imide).4–6 To the best of our knowledge, we are the first to carry out such experiments using AuBr4− dissolved in an ionic liquid without any preliminary degassing and drying of the IL. This liquid medium, referred to as “wet” ionic liquid, is therefore saturated in water and gases (O2, N2, CO2, etc.) throughout the electrochemical study of gold.
UV-Vis spectra were recorded on a Cary 50 UV-Vis spectrophotometer from Varian.
Electrochemistry was carried out at room temperature (25 °C) in a standard three-electrode cell configuration. An Autolab PGSTAT30 potentiostat was used, controlled by GPES 4.9 software (EcoChemie, The Netherlands). For both deposition and stripping experiments, the working electrode (WE) was a 10 μm diameter platinum microelectrode (ALS, Japan), and the counter electrode (CE) was a platinum coil (ALS). For deposition, the solution was the [C8PYR][NTf2] ionic liquid, and a silver wire covered with silver chloride (Ag/AgCl; Radiometer-Analytical, France) was used as a quasi-reference electrode. For stripping, the solution was a 0.5 M HCl aqueous solution (Aldrich and Millipore MilliQ+ water), and the reference electrode was a saturated calomel electrode (SCE; ALS). Acetone (min. 99.8%; VWR), ethanol (min. 96%; VWR) and deionized water (MilliQ+, 18.2 MΩ cm resistivity) were used for rinsing the WE and the CE between deposition and stripping experiments.
Cyclic voltamperometric experiments were recorded on a Versastat 3F potentiostat from Princeton Research using a custom made 1 mL thermostated electrochemical cell. Working electrode was a 5 mm glassy carbon (GC) electrode. Reference electrode was either a silver wire covered with AgCl or AgBr, or a bare silver wire. Counter electrode was a glassy carbon cloth.
Anodisation of gold was carried out using a gold wire as a working electrode together with a platinum counter electrode and a Ag wire pseudo-reference in a three-electrode set up. In order to avoid any oxydation of the ionic liquid, anodisation of gold was carried out at a potential of 1.5 V vs. Ag for 36 hours.
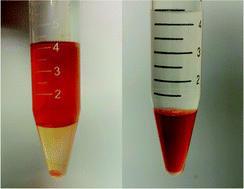
After extraction of AuBr4− in [C8MIM][NTf2] or [C8PYR][NTf2], the ionic liquid phases exhibited a dark orange colour. The UV-Vis spectrum of the ionic liquid phase was found to be very similar to that of AuBr4− in water.7 Maximum absorption wavelength values of 380 and 398 nm for AuBr4− in water and [C8MIM][NTf2] or [C8PYR][NTf2] were obtained respectively. The small bathochromic shift observed is due to the influence of the ionic liquid cations surrounding AuBr4− anion.8
![]() | ||
Fig. 2 Cyclic voltammogram of “wet” [C8PYR][NTf2] ionic liquid. T = 25 °C. Scan rate 10 mV s−1. Pt microelectrode, diameter 10 μm. |
Electrodeposition of gold in [C8PYR][NTf2] subsequent to its extraction from water was then carried out in the most simple manner. After the ionic liquid phase was removed from the tube in which the extraction experiments had been carried out, microelectrodes were directly inserted into the dark orange ionic liquid. We insist here on the fact that neither drying nor degassing of the ionic liquid phase in any form was carried out prior to the electrodeposition experiments.
Fig. 3 shows linear sweep voltammograms (LSVs) in reduction, of a Pt microelectrode in [C8PYR][NTf2], in the absence (a) and in presence (b) of AuBr4− anions. Waves iv and v shown in Fig. 3 are visible in both cases. In presence of AuBr4−, an additional wave of reduction, named vi, appears. It features a simple S shape, characteristic of a one-step, first-order electrochemical reaction occurring at a microelectrode.11 Wave vi is attributed to the reduction of AuBr4− into gold metal12,13 or to the formation of AuBr2−:11
AuBr−4 + 3e− → Au + 4Br− (peak vi and xi) | (1) |
AuBr−4 + 2e− → AuBr−2 + 2Br− [0.564 V per SCE] | (2) |
Eqn (2) is however excluded by the following results. First, a 100-second chronoamperometry at a fixed potential of −0.1 V vs. Ag/AgCl, has been performed (see dot, Fig. 3b). After this, the electrode was removed from the cell containing the ionic liquid, and was rinsed thoroughly with first acetone, then ethanol, and to finish deionized water, at least 20 seconds each. The micro-electrode was then immediately plunged into an aqueous solution containing 0.5 M HCl. Stripping of gold presumably deposited was carried out from 0.3 to 1.2 V per SCE. The corresponding voltammogram is presented in Fig. 4, curve a. The perfectly symmetrical peak, which is consistent with surface oxidative stripping of a metal, is centred around 1.00 V per SCE and exhibits a peak value of ca. 35 nA. The value for the potential of the stripping peak (1.00 V per SCE) is in very good agreement with previous works reporting the stripping of gold in aqueous solutions containing HCl.15–17 Furthermore, because AuBr2− formed following eqn (2) would have been washed out during the rinsing procedure, and because an important stripping peak obtained in Fig. 4 is related to the formation of a significant amount of Au on the microelectrode, we can conclude that the reduction of gold follows quantitatively eqn (1) and not eqn (2).
The expression of the limiting plateau current at a disk microelectrode is given by:11
ILim = −4nFDcr | (3) |
During the 100-second chronoamperometry at a fixed potential of −0.1 V vs. Ag/AgCl mentioned above, ca. 90 nC were used. Ca. 70 nC were obtained by integrating under the stripping peak (with background correction) shown in Fig. 5. Gold metal is known to oxidise as follows12–14 in presence of chloride anions:
Au + 4Cl− → AuCl−4 + 3e− | (4) |
Au + 2Cl− → AuCl−2 + e− | (5) |
![]() | ||
Fig. 5 Cyclic voltammogram of AuCl4− dissolved in [C8MIM][NTf2] and recorded on a GC electrode. Scan rate: 50 mV s−1. |
Previous results have shown that because of eqn (4) and (5), 1.9 electrons per atom of gold was obtained for the stripping of gold in water containing HCl.15 According to eqn (1), the 90 nC obtained during the deposition step correspond to the reduction of 3.1 × 10⁻¹³ mol of gold. Since 70 nC are obtained during the stripping of 3.1 × 10⁻¹³ mol of gold, we can conclude that 2.3 electrons are produced per gold atom stripped to the aqueous solution. This value is indeed close to the value of 1.9 electrons previously reported.15
Finally, the bare Pt microelectrode was rinsed in the same way, i.e., with acetone, ethanol and water. No peak at 1.0 V per SCE can be seen (Fig. 4b). This confirms that the peak observed at 1 V is due to Au metal stripping, and not to platinum oxides, acetone or ethanol. This confirms that gold was indeed deposited on the microelectrode using [C8PYR][NTf2].
In a preliminary step, the electrochemistry of so-called “wet” [C8MIM][NTf2] was studied on a glassy carbon electrode. The corresponding voltammogram is plotted in Fig. 5 (curve with long dashes) and shows reduction peak vii centred around −0.75 V vs. Ag/AgCl. This peak is due to the reduction of water or acid dissolved within the ionic liquid.
The electrochemical study of [AuCl4−] in wet [C8MIM][NTf2] was then carried out in order to compare our results with those previously obtained for the same gold complex ion dissolved in neat [C4MIM][NTf2] (1-methyl-3-butylimidazolium bis(trifluoromethanesulfonylimide) as reported elsewhere.6
As shown in Fig. 5, three reduction peaks, referred to as vii (−0.75 V), viii (0.20 V) and ix (−0.95 V) can be observed. According to ref. 16, the two peaks viii and ix correspond to the reduction steps of AuCl4− to AuCl2− and AuCl2− to Au(0):
AuCl−4 + 2e− → AuCl−2 + 2Cl− (peak viii) | (6) |
AuCl−2 + 1e− → Au + 2Cl− (peak ix) | (7) |
The shift in the reduction potentials between those obtained here and those previously reported are due to the difference in nature of the ionic liquid cation (octyl vs. butyl chain length on the imidazolium cation). Also notice that the potentials reported here are vs. Ag/AgCl and not Ag/Ag+. This result proves that deposition of gold after AuCl4− is extracted into an IL is only possible at the expense of a significant energetic cost because water will be reduced simultaneously with gold.
Peak x that is to be seen on Fig. 5, again according to ref. 16, corresponds to the oxidation of chloride ions from the gold complex AuCl4−.
The cyclic voltammogram of AuBr4− in [C8MIM][NTf2] recorded between −1 and 2 V vs. Ag/AgBr reference electrode and at a scan rate of 50 mV s−1 is shown in Fig. 6. Unlike what was observed for AuCl4−, and in agreement with our present results obtained using a micro-electrode, only one reduction peak (peak xi) occurred at +0.20 mV on the first cycle, which is attributed to the reduction of Au(III) to Au(0) as shown in eqn (1). Again, the slight difference in reduction potential obtained in the preceding section and that reported here is due to the different nature of ionic liquid used ([C8MIM][NTf2] vs. [C8PYR][NTf2]). Peak xii (−0.95 V) present at the extreme left of the voltamperogram is due to the reduction of water. During the second cycle, peak xii was found to move to higher potentials (−0.45 V). This is due to the fact that as a thin layer of gold is deposited on the GC electrode during the first cycle, the working electrode can be considered as a gold electrode during the second cycle. The reduction of water (or of H+ ions) will thus occur at higher potentials, in agreement with the results presented in ref. 6.
![]() | ||
Fig. 6 Cyclic voltamperograms of AuBr4− in [C8MIM][NTf2] displaying first (- -) and second (—) cycles using a GC electrode and a scan rate of 250 mV s−1. |
Fig. 6 also shows two oxidation peaks (xiii and xiv). Because such peaks did not occur in Fig. 5, investigation was carried out by studying a solution of [C8MIM][NTf2] containing approximately 1 mM of [C8MIM][Br]. The cyclic voltammogram carried out under the same conditions as those detailed above did not yield any reduction nor oxidation peaks below 1 V (Fig. 7). The oxidation and reduction of bromide anion was therefore excluded. Moreover, it can be stated that the oxidation peaks observed in Fig. 6 are related to the presence of gold in the ionic liquid.
![]() | ||
Fig. 7 Cyclic voltammograms of [C8MIM][Br] dissolved in [C8MIM][NTf2] using a GC electrode and a scan rate of 50 mV s−1. |
To gain further insights into the oxidation peaks found in Fig. 6, a cyclic voltammogram of gold in [C8MIM][NTf2] without any chloride anion present in the solution was also recorded. To that end, gold was anodized within [C8MIM][NTf2] as detailed in the Experimental section. In order to avoid any oxidation of the ionic liquid during the process, the oxidation of gold in [C8MIM][NTf2] was carried out at 1 V. At that voltage, the phenomenon appears to be rather slow, and because no quartz micro-balance could be used in the course of the experiment, no precise concentration of gold in [C8MIM][NTf2] was determined. Despite this, performing cyclic voltammetry on the solution obtained after oxidation of gold within [C8MIM][NTf2] under the same conditions as detailed above (i.e., glassy carbon working electrode, platinum counter electrode and a silver wire as a pseudo-reference electrode), a well defined reduction peak (peak xv) at −0.90 V was observed, as shown in Fig. 8. Surprisingly, no oxidation peak was observed, even up to 2 V. This confirmed that the oxidation peak xiii and xiv of Fig. 6 are due to the oxidation of gold complexed with bromide ions. To further confirm this assumption, [C8MIM][Br] was added to the solution of anodized gold in [C8MIM][NTf2]. After stirring the solution for 5 minutes, a cyclic voltammogram was recorded as plotted in Fig. 8. The two well-defined oxidation immediately appeared, further confirming that these peaks are due to the oxidation of Au(0) into Au(I) and Au(III) complexed with Br− anions. Peaks xiii and xiv are thus expected to correspond respectively to the equations.
Au + 2Br− → AuBr−2 + 1e− (peak xiii) | (8) |
Au + 4Br− → AuBr−4 + 3e− (peak xiv) | (9) |
![]() | ||
Fig. 8 Cyclic voltamperograms of gold once anodized in [C8MIM][NTf2] prior (---) and after (...) addition of [C8MIM][Br] using a GC electrode and a scan rate of 50 mV s−1. |
Therefore, electrochemical recovery of gold starting from AuBr4− instead of AuCl4− is possible, exhibiting extremely high distribution coefficients and very easy recovery of elemental gold metal.
A thorough investigation of the competitive extraction of gold in presence of other metals such as platinum, iron, nickel or copper, and the electrochemical deposition of the extracted metals will be the subject of a subsequent work.
This journal is © The Royal Society of Chemistry 2014 |