Improvement of proton conductivity in nanocomposite polyvinyl alcohol (PVA)/chitosan (CS) blend membranes

P. Bahavan Palania, K. Sainul Abidina, R. Kannan*a, M. Sivakumarb, Fu-Ming Wangc, S. Rajashabalad and G. Velraje
aDepartment of Physics, University College of Engineering, Anna University, Dindigul-624622, Tamil Nadu, India
bDepartment of Physics, Alagappa University, Karaikudi-630003, Tamil Nadu, India
cInstitute of Advanced Science & Technology, National Taiwan University of Science and Technology, Taipei-106, Taiwan, Republic of China
dSchool of Physics, Madurai Kamaraj University, Madurai-625021, Tamil Nadu, India
eDepartment of Physics, Periyar University, Selam-636011, Tamil Nadu, India. E-mail: rksrsrk@gmail.com; Fax: +91 4512 554 076; Tel: +91 4512 554 076

Received 19th September 2014 , Accepted 28th October 2014

First published on 29th October 2014


Abstract

The composite membranes are prepared with poly(vinyl alcohol) (PVA), chitosan (CS) and montmorillonite (MMT) using a solution casting technique where the chemical composition of CS and MMT in the prepared composite membranes are varied in steps of 5 wt%. The structural properties, thermal stability, hydrolytic stability and transport properties of the prepared membranes were investigated using various characterization methods, like Fourier transform infrared spectroscopy (FT-IR), X-ray diffraction (XRD), scanning electron microscopy (SEM), thermogravimetric analysis (TGA), water uptake, methanol uptake, planner swelling, thickness swelling, ion exchange capacity (IEC) and proton conductivity measurements. It is noticed that the addition of both CS and MMT into the PVA polymer enhances the mechanical, thermal and transport properties of the prepared composite membranes. All the membranes are homogenous, as revealed by the XRD studies. In the present work, ionic transport studies of PVA/CS/MMT membranes were analysed and the membrane PCH05 exhibited the best electrical properties of all the prepared membranes. It is expected that PCH05 membrane will serve as a good candidate for use in direct methanol fuel cells (DMFC) in the near future.

Introduction

Fuel cells have been considered to be cleaner and more efficient electrochemical devices for energy generation in recent times. In order to meet energy demands worldwide, active research in this area has been carried out over the past decade.1,2 Even though many types of fuel cell exist, among those available, aDMFC system has a simple design and convenient fuel storage together with high efficiency, however, there are numerous challenges to commercialization. Low catalytic activity during fuel (methanol) oxidation at the anode and high methanol permeation of the proton exchange membrane (PEM) are the two main factors affecting the performance of DMFCs.3 The performance-limiting PEM transfers protons from the anode to cathode compartment of the cell. In DMFC, methanol permeation may result in mixed potential and catalyst poisoning, as well as low fuel efficiency.4 Nafion, perfluorinated ionomers terminated with sulphonic acid groups, is the most commonly utilized PEM material. Unfortunately, it is the most suitable PEM material in hydrogen fuel cells, whereas in a DMFC system it delivers relatively high methanol permeation.5 For a perfect PEM material, it is essential to fulfil the requirements of high proton conductivity, superior chemical stability, hydrolytic durability and low fuel (methanol) crossover. There are several methods to prepare proton conducting membranes. Among them, polymer blending is the most attractive and facile. The combination of new synthetic products (which can generate pollution) with biodegradable ones is the preferred option for environmentally friendly production (which ideally should not generate excess waste, use fossil fuels or result in greenhouse gas emissions). The mixing of two or more distinct polymers has resulted in composite materials with improved or special properties. Blends of synthetic polymers (PVA, polyethylene, polystyrene, polypropylene, etc.) with natural polymers (e.g. CS, starch, cellulose, alginates, etc.) have been investigated for various applications such as ultra-filtration, electrochemical conversion, biomedicine etc., PVA is a biodegradable, biocompatible, and non-toxic synthetic polymer with excellent film forming properties. PVA has long range hydrogen bond forming ability in aqueous blends, resulting in better complex formation with enriched physical and chemical properties. In addition to this, CS [poly-b-(1-4)-D-glucosamine], a cationic poly-saccharide, is obtained from deacetylation of chitin. The sugar backbone consists of β-1,4-linked D-glucosamine with a high degree of N-acetylation, a structure very similar to cellulose, except that the acetylamino group is replaced by a hydroxyl group in the C-2 position. CS is thus (poly(N-acetyl-2-amino-2-dexoxy-D-glucopyranose)), a copolymer where the N-acetyl-2-amino-2-deoxy-D-glucopyranose (or Glu-NH2) units are linked by (1 → 4)-β-glycosidic bonds.6 In addition, CS is insoluble in water, aqueous alkaline solutions and also in common organic solvents, but is soluble in aqueous acetic acid solution (CH3COOH), which converts its protonated form of R–NH3+ from the glucosamine unit (R–NH2). It is a class of natural polymer that could be utilized in different applications, due to its biodegradability, biocompatibility, bioadhesivity and non-toxic.7,8 In addition, Schiff base mechanism could be involved in the chemical cross-linking of CS with glutraldehyde.9 The polymer electrolyte membrane containing CS with dopant KOH has a protonic conductivity of the order 10−2 S cm−1 and a current density of 30 mA cm−2.10 Osifo et al. prepared a CS hydrogel membrane by ionic cross-linking with H2SO4, which could be utilized as an electrolyte separator in DMFC.11 Moreover, a composite membrane fabricated with ionic cross-linking of CS and polyacrylate exhibits ionic conductivity of 3.8 × 10⁻² S cm−1 with methanol permeation of 3.9 × 10⁻⁸ cm2 s−1.12 The use of H2SO4 as a cross-linking agent can result in health risks and it is also corrosive and not cost-effective. To resolve these problems, inorganic salts can be used as cross-linking agents. Du et al.13,14 studied the structural and electrical properties of CS membranes with three different ammonium salts, ammonium acetate (CH3COONH4), ammonium chloride (NH4Cl) and ammonium sulfate ((NH4)2SO4), and reported that the optimum properties of CS membrane were achieved with CH3COONH4 and the worst properties with (NH4)2SO4. In this present work, an attempt was made to develop PVA/CS/MMT composite electrolyte membranes for DMFC application using glutraldehyde (GA) as the cross-linking agent. There are many reports related to polymer–nanoclay (MMT) composites.15–19 The intercalated or exfoliated MMT nanoclay plays a significant role in ionic conduction in the electrolytes. The fine morphology of nanoclay exfoliation is expected to enhance both ionic conductivity and thermo-mechanical properties. In one of our earlier work, PVA and MMT (modified/unmodified) composite electrolyte membranes were subjected to sulfonation and achieved a high proton conductivity value of the order of 10−1 S cm−1. The aim of this present work is to obtain an excellent PEM material by blending CS into PVA and MMT nanoclay fillers. The electrochemical properties of PVA/CS blend membranes are enhanced due to the exfoliation of MMT nanoclay and chemical cross-linking in the presence of GA. All the prepared membranes were subjected to further characterization.

Experimental

Membrane preparation and characterization

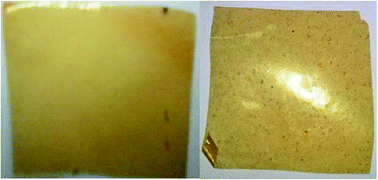
The following chemicals were used for preparing the electrolyte membranes: PVA (99% purity, molecular weight of 1[thin space (1/6-em)]15[thin space (1/6-em)]000; Loba), CS (Alfa aesar), MMT K10 (Himedia), GA (Alfa), ion exchange resin (CDH) and sulfuric acid (Merck). The appropriate amount of PVA was placed in a conical flask and soaked in water overnight at room temperature, and then this was stirred at 80 °C for 12 h. CS was dissolved separately in aqueous acetic acid solution at room temperature for 2 h. The dissolved CS solution was slowly added into the PVA solution and stirred at room temperature in order to get a homogeneous gel-like solution. The resultant homogeneous solution was chemically cross-linked with 2.5 M GA solution. The procedure for preparing modified MMT was reported in our previous work and is as follows.20 The Na+MMT was dispersed in distilled water with continuous stirring for 24 h at room temperature. The well-dispersed solution was passed through the ion exchange resin several times. To ensure the complete exchange of cations, their pH value was noted and should be in the range of 7 to 2.8. The resultant solution was dried in open air at room temperature. It was then ground well using a mortar, until uniform size powder was obtained. The protonated MMT is now ready for preparation of the electrolyte membrane. The unmodified/modified MMT was added into the cross-linked PVA/CS blend solution, followed by normal stirring until a gel-like solution was obtained. The resulting homogeneous viscous solution was poured into a Petri dish and kept at the room temperature until the solvent was completely removed. After complete removal of the solvent, the composite membrane was peeled off the Petri dish. The prepared membranes were washed several times with de-ionized water to remove contaminating particles and then dried in a hot air oven at 110 °C for 1 h. A digital photographic image of the prepared membrane is shown in Fig. 1. The thicknesses of the polymer composite membranes were measured using a Mitutoyo digital micrometer and found to be in the range of 0.05–0.08 mm. All the prepared composite membranes were subjected to further characterization. The following characterization methods were used in the present study: TGA for thermal stability; FT-IR to identify the chemical groups present in the composite membranes; XRD and SEM to reveal structural stability; water uptake, methanol uptake and swelling measurements for hydrolytic stability, and ion exchange capacity (IEC) and AC impedance techniques were used to estimate protonic conductivity by means of a Nyquist plot.
image file: c4ra10788h-f1.tif
Fig. 1 A digital photographic image of the prepared composite membrane.

Results and discussion

Structural analysis

XRD. XRD spectra were used to estimate the crystallinity of the composite membranes. The crystallinity of the PVA, PVA/CS blend and PVA/CS/MMT composite membranes with varying concentrations are depicted in Fig. 2. In general, a sharp peak with high intensity corresponds to semi crystalline materials and a broad peak corresponds to an amorphous material.21 Fig. 2(a) shows a broad peak of PVA at about 20° (2θ) for the (101) plane.22 It is observed from Fig. 2(b) that there are two peaks, one at about 19° (2θ) with high intensity and another at about 26° (2θ) with less intensity for all the prepared PVA/CS/MMT composite membranes. The relative intensity peak values of PVA/CS/MMT composite PEMs decrease with increasing additive (CS, MMT) concentration (see Table 1). CS is an amorphous polysaccharide and MMT nanoclay is highly hydrophilic in nature. It is clear that the presence of CS in the PVA matrix results in a decrease in peak intensity (PC0) from the order of 103 to 102. Further, adding MMT at various concentrations into the PVA/CS blend matrix reduces the peak intensity of all the PVA/CS/MMT (modified/unmodified) PEMs. On the other hand, the cross-linking reaction with GA is the key factor for the reduction in crystallinity of all the PEMs.23 In comparison, the membrane PCH05 has the least intense peak. This reveals that more amorphous phase exists in the PCH05 membrane, which may be due to the formation of a flexible network in the polymer composite matrix. The additional peak at around 26° may occur due to amine groups or the presence of MMT clay impurities in the composite PEMs.24,25
image file: c4ra10788h-f2.tif
Fig. 2 XRD spectra (a) for pure PVA and (b) for PVA/CS/MMT composite membranes varied with different concentration and content.
Table 1 Chemical composition and the relative intensity of PVA/CS/MMT (modified/unmodified) composite membranes
Sample code Chemical composition Peak position 2θ (deg) Intensity Relative intensity (%)
P0 PVA(100) 19.8 6696.06 100.00
PC0 PVA(80)–CS(20)–GA(2.5 M) 19.9 322.94 4.82
PCN05 PVA(80)–CS(15)–GA(2.5 M)–Na+MMT(05) 19.5 435.60 6.51
PCN10 PVA(80)–CS(10)–GA(2.5 M)–Na+MMT(10) 19.7 341.30 5.10
PCN15 PVA(80)–CS(05)–GA(2.5 M)–Na+MMT(15) 19.7 303.39 4.53
PCH05 PVA(80)–CS(15)–GA(2.5 M)–H+MMT(05) 19.1 178.02 2.66
PCH10 PVA(80)–CS(10)–GA(2.5 M)–H+MMT(10) 19.8 294.07 4.39
PCH15 PVA(80)–CS(05)–GA(2.5 M)–H+MMT(15) 19.7 298.97 4.46


FTIR analysis. The existence of chemical groups of PVA, CS and MMT in the composite PEMs and the molecular interaction of PVA and CS with the MMT clay filler, which can be predicted by the presence of different molecular groups, are depicted in Fig. 3. The broad band between 3590 cm−1 and 3046 cm−1 is attributed to O–H stretching of water molecules and the stretching vibration of –OH and –NH2 at 3424 cm−1 should also be noted.26 The transition peak at 1460 cm−1 corresponds to the hydroxyl groups of O–H bending vibration and the band due to –CH2 asymmetric stretching also arises at 2997 cm−1. The vibrational band around 1650–1710 cm−1 is consistent with C[double bond, length as m-dash]C stretching of PVA. The characteristic vibrational band at about 1760 cm−1 is assigned to C[double bond, length as m-dash]O stretching from acetyl groups of PVA polymer cross-linked with GA. The characteristic bands of saccharide structures appear at about 910, 1020 and 1145 cm−1. The strong vibration of amine bands appear at around 3470 (–OH stretching), 1650 (amide I) and 1560 cm−1 (amide II).27–29 In addition, the peak at 1020 cm−1 corresponds to the amine group. The band at around 1078 cm−1 and the multi peaks between 490–460 cm−1 indicate the Si–O group, with polymeric association with the secondary amine (–NH) group.30 As a result, the expected hydrogen bands in the blend composite membranes are noted from the FT-IR spectra.
image file: c4ra10788h-f3.tif
Fig. 3 FT-IR spectra of the various composite membranes.
SEM. Fig. 4 shows SEM images of the surface morphology of thePVA/CS/MMT composite membrane PCH05. Agglomerations of MMT particles are not obviously formed in the membrane. Consequently, it is observed that the MMT clay particles are uniformly dispersed into the polymer blend matrix. Moreover, the synthesized membrane could be considered to behomogenous and dense with no remarkable phase separation.
image file: c4ra10788h-f4.tif
Fig. 4 SEM photographs of PCH05 membrane.
Thermal analysis. TGA is the most important tool to investigate the thermal stability of polymers. The TG and derivate of TG (DTG) curves of pure PVA, PVA/CS and PVA/CS blend with modified/unmodified MMT composite membranes are presented in Fig. 5 and their corresponding weight losses are listed in Table 2. In the present work, all the samples were measured in the temperature range of 20 °C to 600 °C. The thermograms of all the blend composite membranes exhibit three stages of weight loss in the TG curves and the corresponding peaks can be seen in the DTG curves. The first weight loss (about 10%) is around 60–150 °C and can be attributed to vaporization of moisture and weakly bounded solvent molecules.31 The second weight loss in the range of 200–400 °C is due to the thermal degradation of PVA and CS polymers.32,33 The existence the of third weight loss around 400–500 °C is due to the breaking of the polymer backbone in the polymer blend matrix.34 In the major thermal degradation region of 200 and 400 °C, the addition of CS may enhance the thermal stability of the polymer blend matrix more than PVA. In addition to that, the DTG curves of PVA, PVA/CS and PVA/CS/MMT composite PEMs are shown in Fig. 5c and d. The major thermal degradation peaks for all the composite membranes are less intense than that of the pure PVA film, and they are shifted towards higher temperatures when the concentration of CS increases in the polymer matrix, which in turn increases the thermal stability. Moreover, the DTG curve of pure PVA film has the major predominant peak at 291 °C with a maximum thermal degradation rate is 1.76 mg min−1, whereas the major predominant peak is at 339 °C and a maximum degradation rate of 0.49 mg min−1 is observed for the PVA/CS blend composite PEM. Similarly, PVA/CS/MMT composite membranes with unmodified MMT demonstrated shifts in their major predominant peaks towards high temperature. However, in the case of membranes with modified MMT, the predominant peak appeared at a maximum temperature of 371 °C. This may be due to the uniform dispersion of MMT nanoclay filler in the polymer blend matrix. This maximum degradation rate was found to be better than the degradation of pure PVA. In addition, the thermal stability of composite membranes appeared to be favourable, due to the lower weight loss of the composite membranes. Apart from that, as the CS ratio increased in the blend, the residual mass increased from 12% to 20%. The maximum decomposition rate is depicted in Table 2, and it should be noted that the maximum degradation temperature increases with increase in CS. Moreover, PVA blends showed higher thermal stability due to the addition of CS. Our results agree well with the earlier reports of Lewandowska (2009) and Peesan, Rujiravanit and Supaphol (2003).31,35
image file: c4ra10788h-f5.tif
Fig. 5 (a and b) TG curves and (c and d) DTG curves of pure PVA and their blend composite films of PVA/CS, PVA/CS/MMT (modified and unmodified) of different concentrations.
Table 2 Thermal characteristics of PVA, PVA/CS and PVA/CS/MMT composite electrolyte membranes
Sample TGA DTG
1st step °C Weight loss wt% 2nd step °C Weight loss wt% 3rd step °C Weight loss wt% Char. yield at 600 °C Major thermal degrad. peak position °C Rate of degrad. (mg min−1)
P0 70–160 4–6 240–360 70–75 415–500 90–92 5 291 1.76
PC0 60–150 6–9 220–400 50–55 400–490 83–85 12 339 0.49
PCN05 60–140 4–8 200–400 48–52 420–500 80–82 15 357 0.48
PCN10 60–140 6–8 210–410 48–50 425–510 65–75 13 364 0.50
PCN15 60–140 6–8 200–410 45–48 430–490 64–70 20 374 0.78
PCH05 60–150 4–8 215–410 44–46 420–490 68–72 15 371 0.55
PCH10 60–150 4–8 220–410 44–46 420–500 74–76 13 371 0.66
PCH15 60–140 4–8 220–410 54–56 420–500 74–78 20 371 0.72


IEC

The IEC depends on the number of ion exchangeable sites present in the polymer matrix, as these are responsible for ionic conduction. This is an indirect and reliable route to investigate the proton conductivity. Fig. 6a and b shows the variation of IEC values as a function of additive concentration. Compared to all the blend membranes, the membrane PCH05 has the highest IEC value (1.23 mmol g−1). This may be due to more ion exchangeable sites being present in the composite membrane, due to amine groups and hydroxyl group interaction from CS/PVA blends. In addition, when the protonated MMT is added, the IEC values may increase due to the increase in H+ ions. This is more favourable for PEM operation because it will increase proton transfer.
image file: c4ra10788h-f6.tif
Fig. 6 Variation in IEC values of composite membranes as a function of additive concentration (a) with varied MMT concentration and (b) with varied CS concentration.

Water–methanol uptake

Water–methanol uptake capacity is one of the supporting parameters for the ionic transport of PEM and fuel crossover in DMFCs. It is expected that PEMs with high water uptake and low methanol uptake will be needed for DMFC applications. The effect of MMT addition on water and methanol uptake of the synthesized membranes is presented in Fig. 7. It is clear that the water uptake values are higher than the values for methanol uptake for the synthesized membranes. This can be attributed to the higher water selectivity of the PVA/CS matrix. There is a significant change in water uptake of the membranes with increasing additive (CS, MMT) concentration. Comparing the uptake values, the following interpretations can be made. PEMs with modified MMT have higher uptake than those with unmodified MMT. All the membranes have higher water uptake together with lower methanol uptake values in 3 M methanol solution. Furthermore, the pure PVA membrane has a lower methanol uptake value than the others, which may be due to its methanol barrier property. It is well known that PVA cannot be dissolved in alcoholic solutions, like methanol, ethanol etc., but can be dissolved in hot water, because of its basic physico-chemical properties. PVA polymer has high water selectivity and low alcoholic selectivity. In addition, the membranes with a high concentration of MMT deliver higher uptake values, because of the hydrophilic nature of MMT clay filler. Moreover, the membrane PCH05 (PVA[thin space (1/6-em)]:[thin space (1/6-em)]CS[thin space (1/6-em)]:[thin space (1/6-em)]H+MMT; 80[thin space (1/6-em)]:[thin space (1/6-em)]15[thin space (1/6-em)]:[thin space (1/6-em)]5) gives appreciable water uptake and methanol uptake because of its chemical compatibility. It is hence concluded that the variation in uptake capacity may be due to the chemical compatibility of the polymer blend system. Membranes with higher concentrations of MMT may lead to formation of agglomeration or chunks within the polymeric system. It is suggested that the membrane incorporating 15 wt% of CS and 5 wt% modified MMT clay content has good compatibility with 80 wt% of PVA polymer, therefore it may suppress methanol transport through the membrane.
image file: c4ra10788h-f7.tif
Fig. 7 Variation of water–methanol uptake behaviour of composite membranes as a function of MMT concentration and content.

Swelling behaviour

A membrane can interact with water at the cathode side when assembled in a DMFC system, but the membrane may swell, due to the absorbed water molecules, and the protons will therefore have to travel a longer distance, which may affect the diffusional resistivity. The ionic conduction of the membrane could thus diminish. A membrane must have high water uptake ability and no swelling to be a good candidate for DMFCs. The membrane swelling measurements were therefore investigated at room temperature. Swelling behaviour was determined by means of any changes in surface area and thickness before and after hydration of the membrane. Membrane samples were prepared by cutting the membranes into 2 cm × 2 cm pieces and the thicknesses of the membranes were measured with Mitutoyo digital micrometer. Extra care was taken during this measurement. The membrane swelling decreased with increasing additive (CS, MMT) composition. Variation of surface area and thickness of the membranes with addition of CS and MMT (modified/unmodified) content are shown in Fig. 8a–d. The changes in thickness and surface area of the membranes decreased with increasing additive concentration. The variation of surface area and thickness of the membranes is very small with the inclusion of 5 wt% of MMT and 10 wt% CS into the PVA polymer. From Table 3, it can be concluded that membrane swelling depends upon the nature of the polymer and polymer solvent compatibility, along with degree of cross-linking. However, this swelling behaviour plays a remarkable role in mass transfer, ion exchange and ionic interaction.36
image file: c4ra10788h-f8.tif
Fig. 8 Variation in swelling of composite membranes as a function of additive concentration: (a) planar swelling of the PEMs varied with MMT concentration; (b) planar swelling of the PEMs varied with CS concentration; (c) thickness swelling of the PEMs varied with MMT concentration; (d) thickness swelling of the PEMs varied with CS concentration.
Table 3 Variation in IEC, uptake and swelling behaviours of composite membranes as a function of additive concentration
Sample IEC Water uptake% 3 M methanol uptake% 5 M methanol uptake% Area swelling% Thickness swelling%
P0 0.57 51.92 18.08 28.46 133.33 120.78
PC0 0.64 53.01 52.50 59.12 53.33 42.86
PCN05 0.73 61.64 61.88 65.07 53.33 42.86
PCN10 0.83 60.00 64.17 67.90 53.33 27.71
PCN15 0.73 102.29 92.14 96.23 63.25 46.75
PCH05 1.23 69.54 65.00 65.31 45.70 73.58
PCH10 0.86 75.33 71.33 68.46 53.33 42.86
PCH15 0.83 106.94 97.50 98.97 66.33 58.90


Proton conductivity

Proton conductivity is the most important property of the polymer electrolyte membranes. This measurement was carried out using an Auto lab AC impedance analyzer in the frequency range of 1 MHz to 100 Hz at room temperature with 100% humidity condition. The Nyquist plots for the sulfonated, as well as the unsulfonated, membranes are shown in Fig. 9a and b. Typically, the Rb values of the sulfonated and unsulfonated membrane samples were in the range of 241–320 ohm and 3141–5023 ohm, respectively. Furthermore, the proton conductivity values of the blend composite membranes are listed in Table 4 and the same values are shown in Fig. 10. Pre-treatment of membranes in 10 vol% aqueous H2SO4 solution enhanced the proton conductivity values. The general procedure for the pretreatment (sulfonation) of the membranes is as follows. All the prepared membranes were immersed in 10 vol% of H2O2 at room temperature for about 1 h and then rinsed with deionised water (DI) several times. The membranes were then placed in 10 vol% H2SO4 solution for about 12 h at room temperature. After this treatment, the membranes were rinsed with DI water several times to remove the excess acid present in the membrane. These pre-treated membranes had proton conductivity values that had increased up to ten-fold, compared to the same membranes without the pre-treatment. This might be due to different ionic mobilities obatined from the sulfonic groups. Generally, PVA has crystalline domains and exhibits heterophasic morphology, which means it has more flexible chains along with free functional groups (charge carriers), thus influencing the protonic conduction. In other words, PVA blends could have more flexible networks for ionic transport. Panu Danwanichakul and Pongchayont Sirikhajornnam37 achieved higher ionic conductivity with cross-linked PVA/CS membrane than with CS grafted with PVA.38 In contrast, a cross-linked membrane with more ionic clusters leads to an increase in ionic transport by hopping of protons from sulfate groups. The cross-linking network could thus be responsible for the increase in proton conductivity. This is more effective for chitosan and PVA chains. Furthermore, membranes with modified MMT delivered higher proton conductivity than unmodified membranes because of their strong affinity with water molecules. Its hydrophilicity, together with its high surface area provided by the ionic clusters of side chains, leads to higher absorption of water, which results in easy proton transfer.39 The highest proton conductivity value achieved for the PCH05 membrane is 0.1197 S cm−1 with 5 wt% of modified MMT. The reason for this increase in proton conductivity could be the hydronium ions from the CS polymer and protons from the MMT. The higher concentration and content of MMT in the membranes is responsible for the formation of agglomerations in the PVA/CS blend polymer matrix. This agglomeration perturbed the conduction process, and thus increased resistance to proton transfer. In comparison with the investigation of Yang et al. (2009) on PVA/MMT composite membranes,40 which reported that the proton conductivity values of the PVA/MMT composite polymer membranes were of the order of 10−2 S cm−1 at room temperature, the present investigation achieved a high proton conductivity value of 0.1197 S cm−1 for the sample PCH05 under the same conditions. This may be due to the presence of protonated MMT, which improves the ionic conductivity of the prepared electrolyte membrane.
image file: c4ra10788h-f9.tif
Fig. 9 Nyquist plot for all the composite membranes (a) for unsulfonated PEMs and (b) for sulfonated PEMs.
Table 4 Proton conductivity of different samples with varied concentration of modified and unmodified MMT
Sample code Proton conductivity (S cm−1)
Unsulfonated PEM 10 vol% sulfonated PEM
P0 0.0003 0.0091
PC0 0.0040 0.0040
PCN05 0.0050 0.0092
PCN10 0.0043 0.0055
PCN15 0.0062 0.0062
PCH05 0.0604 0.1197
PCH10 0.0623 0.0787
PCH15 0.0643 0.0675


image file: c4ra10788h-f10.tif
Fig. 10 Variation of proton conductivity as a function of concentration of MMT.

Conclusions

The effect of MMT in PVA/CS blend membranes was studied. The studies on uptake of water and methanol solution confirm high water uptake and low methanol uptake in low concentration of methanol solution. This response in different liquid environments is ideal for DMFC applications. Membranes with low swelling make better contact with the electrodes and may lead to good performance. From the results of the proton conductivity studies, it is believed that a chemical reaction occurred between PVA and the sulfur groups. The introduction of CS into the composite membrane may assist in proton transfer and also improves the thermal stability. Since the membrane PCH05 showed very good performance in all the studies, it is expected that this membrane will deliver excellent performance in DMFC systems in the near future.

Acknowledgements

The authors would like to acknowledge DST-SERB for the generous financial support.

References

  1. R. G. Rajendran, MRS Bull., 2005, 30, 587–590 CrossRef CAS.
  2. B. Smitha, S. Sridhar and A. A. Khan, J. Membr. Sci., 2005, 259, 10–26 CrossRef CAS PubMed.
  3. H. S. Liu, C. J. Song, L. Zhang, J. J. Zhang, H. J. Wang and D. P. Wilkinson, J. Power Sources, 2006, 155, 95–110 CrossRef CAS PubMed.
  4. Y. Zhang, Z. Cui, C. Liu, W. Xing and J. Zhang, J. Power Sources, 2009, 194, 730–736 CrossRef CAS PubMed.
  5. V. Neburchilov, J. Martin, H. Wang and J. Zhang, J. Power Sources, 2007, 169, 221–238 CrossRef CAS PubMed.
  6. R. Hejazi and M. Amiji, J. Controlled Release, 2003, 89, 151 CrossRef CAS.
  7. E. S. Gil and S. M. Hudson, Prog. Polym. Sci., 2004, 29, 1173 CrossRef CAS PubMed.
  8. C. Qin, H. Li, Q. Xiao, Y. Liu, J. Zhu and Y. Du, Carbohydr. Polym., 2006, 63, 367–374 CrossRef CAS PubMed.
  9. A. Singh, S. S. Narvi, P. K. Dutta and N. D. Pandey, Bull. Mater. Sci., 2006, 29, 233–238 CrossRef CAS.
  10. Y. Wan, B. Peppley, K. A. M. Creber, V. T. Bui and E. Halliop, J. Power Sources, 2006, 162, 105–113 CrossRef CAS PubMed.
  11. P. O. Osifo and A. Masala, J. Power Sources, 2010, 195, 4915–4922 CrossRef CAS PubMed.
  12. B. Smitha, S. Sridhar and A. A. Khan, Macromolecules, 2004, 37, 2233–2239 CrossRef CAS.
  13. J. F. Du, Y. Bai, W. Y. Chu and L. J. Qiao, J. Polym. Sci., Part B: Polym. Phys., 2010, 48, 260–266 CrossRef CAS.
  14. J. F. Du, Y. Bai, W. Y. Chu and L. J. Qiao, J. Polym. Sci., Part B: Polym. Phys., 2010, 48, 880–885 CrossRef CAS.
  15. M. J. Koh, H. Y. Hwang, D. J. Kim, H. J. Kim, Y. T. Hong and S. Y. Nam, J. Mater. Sci. Technol., 2010, 26, 633–638 CAS.
  16. M. Deka and A. Kumar, J. Power Sources, 2011, 196, 1358–1364 CrossRef CAS PubMed.
  17. P. Meneghetti, S. Qutubuddin and A. Webber, Electrochim. Acta, 2004, 49, 4923–4931 CrossRef CAS PubMed.
  18. M. Moreno, M. Ana and G. Gonzalez, Electrochim. Acta, 2010, 55, 1323–1327 CrossRef CAS PubMed.
  19. N. Shukla and A. K. Thakur, Solid State Ionics, 2010, 181, 921–932 CrossRef CAS PubMed.
  20. P. Bahavan Palani, R. Kannan, S. Rajashabala, S. Rajendran and G. Velraj, Ionics, 2014, 1–7 Search PubMed.
  21. J. H. Kim and Y. M. Lee, J. Membr. Sci., 2001, 193, 209–225 CrossRef CAS.
  22. I. Shao, H. Y. Kim, J. Gong, B. Ding, D. R. Lee and S. J. Park, Mater. Lett., 2003, 57, 1579–1584 CrossRef.
  23. J. M. Yang and H. C. Chiu, J. Membr. Sci., 2012, 419, 65–71 CrossRef PubMed.
  24. H. Ture, T. O. J. Blomfeldt, M. Gallstedt and M. S. Hedenqvist, J. Polym. Environ., 2012, 20, 1038–1045 CrossRef.
  25. A. Sapalidis, F. K. Katsaros and N. K. Kanellopoulos, Nanocomposites and Polymers with Analytical Methods, ed. John Cuppoletti, 2011, p. 38 Search PubMed.
  26. S. Costa-Junior, M. M. Pereira and H. S. Mansur, J. Mater. Sci.: Mater. Med., 2009, 20, 553–556 CrossRef PubMed.
  27. S. Costa-Junior, E. F. Barbosa-Stancioli, A. A. P. Mansur, W. L. Vasconcelos and H. S. Mansur, Carbohydr. Polym., 2009, 76, 472–548 CrossRef PubMed.
  28. M. H. Buraidah and A. K. Arof, J. Non-Cryst. Solids, 2011, 357, 3261–3266 CrossRef CAS PubMed.
  29. H. M. P. N. Kumar, M. N. Prabhakar, C. V. Prasad, K. M. Rao, T. V. A. K. Reddy, K. C. Rao and M. C. S. Subha, Carbohydr. Polym., 2010, 82, 251–255 CrossRef CAS PubMed.
  30. M. Abdelrazek, I. S. Elashmawi and S. Labeeb, Phys. B, 2010, 405, 2021–2027 CrossRef PubMed.
  31. K. Lewandowska, Thermochim. Acta, 2009, 493, 42–48 CrossRef CAS PubMed.
  32. C. H. Chen, F. Y. Wang, C. F. Mao, W. T. Liao and C. D. Hsieh, Int. J. Biol. Macromol., 2008, 43, 37–42 CrossRef CAS PubMed.
  33. S. Tripathi, G. K. Mehrotra and P. K. Dutta, Int. J. Biol. Macromol., 2009, 45, 372–376 CrossRef CAS PubMed.
  34. R. Shi, J. Bi, Z. Zhang, A. Zhu, D. Chen, X. Zhou, L. Zhang and W. Tian, Carbohydr. Polym., 2008, 74, 763 CrossRef CAS PubMed.
  35. M. Peesan, R. Rujiravanit and P. Supaphol, Polym. Test., 2003, 22, 381–387 CrossRef CAS.
  36. M. Vijay Kumar, S. Debasish and P. L. Nayak, Int. J. Appl. Biol. Pharm. Technol., 2011, 2, 404 Search PubMed.
  37. D. Panu and S. Pongchayont, J. Chem., 2010, 2013, 1–9 Search PubMed.
  38. Y. Wan, K. A. M. Creber, B. Peppley and V. T. Bui, Polymer, 2003, 44, 1057–1065 CrossRef CAS.
  39. K. Miyatake, K. Oyaizun, E. Tsuchida and A. S. Hay, Macromolecules, 2001, 34, 2065 CrossRef CAS.
  40. C. C. Yang, Y. J. Lee and J. M. Yang, J. Power Sources, 2009, 188, 30–37 CrossRef CAS PubMed.

This journal is © The Royal Society of Chemistry 2014
Click here to see how this site uses Cookies. View our privacy policy here.