Highly-active direct Z-scheme Si/TiO2 photocatalyst for boosted CO2 reduction into value-added methanol

Yousong Liua, Guangbin Ji*a, Mohammed Abdulkader Dastageerb, Lei Zhua, Junyi Wanga, Bin Zhanga, Xiaofeng Changa and Mohammed Ashraf Gondal*b
aCollege of Materials Science and Technology, Nanjing University of Aeronautics and Astronautics, Nanjing 210016, P. R. China. E-mail: gbji@nuaa.edu.cn; Tel: +86-25-5211-2902
bPhysics Department, King Fahd University of Petroleum and Minerals, Dhahran, 31261, Saudi Arabia. E-mail: magondal@kfupm.edu.sa; Tel: +966-38602351

Received 19th September 2014 , Accepted 23rd October 2014

First published on 24th October 2014


Abstract

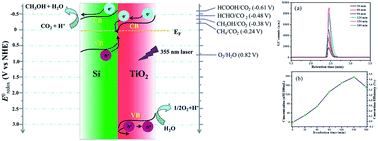
In the present study, direct Z-scheme Si/TiO2 photocatalyst was synthesized via a facile hydrothermal reaction using tetrabutyl titanate and Si powder prepared from magnesiothermic reduction of SiO2 nanospheres. The Si/TiO2 nanospheres were composed of porous Si nanospheres with a diameter of ∼300 nm and TiO2 nanosheets with a diameter of 50 nm and thickness of 10 nm, and demonstrated superior visible light harvesting ability to either Si nanospheres or TiO2 nanosheets. CO2 photocatalytic reduction proved that Si/TiO2 nanocomposites exhibit high activity in conversion of CO2 to methanol with the maximum photonic efficiency of 18.1%, while pure Si and TiO2 catalyst are almost inactive, which can be ascribed to the integrated suitable band composition in the Si/TiO2 Z-scheme system for CO2 reduction. The enhanced photocatalytic property of Z-scheme Si/TiO2 nanospheres was ascribed to the formation of Si/TiO2 Z-scheme system, which improved the separation efficiency of the photogenerated carriers, prolonged their longevity, and therefore boosted their photocatalytic activity.

1. Introduction

High consumption of fossil fuels is creating not only an energy crisis but also environmental pollution and climate change due to excessive green house gas emissions to the atmosphere. As carbon dioxide (CO2) is a major contributor to green house gases, attention is focused on its mitigation all over the world. Solar-driven photocatalytic conversion of CO2 into added value fuels is the most promising proposition as it does not only remove CO2 from effluent gases but also produces hydrocarbon fuels, which could be used to meet future energy needs. Thus, a lot of research efforts have focused on developing efficient catalysts for CO2 photocatalytic reduction. Semiconductor photocatalysts (such as ZnO,1,2 CdS,3 ZnGa2O4,4 Zn2GeO4,5,6 WO3,7 TiO2 (ref. 8) etc.) have been explored. Among them, titanium dioxide (TiO2) has been extensively studied as an important photocatalyst because of its low toxicity, low cost, superior photocatalytic activity and long-term chemical stability.9–11 However, the wide band gap of TiO2 (∼3.2 eV) limits its efficient utilization for solar energy conversation as TiO2 only absorbs light with wavelengths shorter than ∼387 nm in the ultraviolet region. Moreover, after photoabsorption, the electrons are excited from the valence band of TiO2 to the conduction band and the effective electron–hole pairs are generated.12 Unfortunately, most of the effective electron–hole pairs are recombined and dissipated as heat before they arrive at the photocatalyst surface, which makes TiO2 an inefficient photogenerated carrier hampering its charge separation ability.

Research scientists have devoted extensive efforts to address these problems. Introducing doping elements (such as S,13 N,14 and C (ref. 15)) into TiO2 has been proven to be an effective approach to narrow the band gap, improve the visible light absorption and enhance the photocatalytic activity in CO2 reduction. TiO2 modification with metal particles (e.g., Ag,16 Au,17 Pt,18 and Cu (ref. 19)) has been reported to inhibit charge recombination probability because these metals serve as electron traps to suppress the recombination of the photogenerated electron–hole pairs and hence improve the photocatalytic activity. In addition, coupling TiO2 with a narrower band gap semiconductor to construct heterojunctions is another effective approach to accommodate the visible-light photon energy and improve the photogenerated charge separation and CO2 conversion efficiency. This coupling takes advantage of both the heterojunction to improve charge separation rate, and the narrow band gap of the coupled semiconductor to expand the light absorption region. TiO2 based heterojunctions such as PbS/TiO2,20 CuO/TiO2,21 FeTiO3/TiO2 (ref. 22) have been reported in recent years.

Similar to the heterojunction photocatalytic system, the Z-scheme photocatalytic system also features the spatial isolation of photogenerated electrons and holes, which reduces the bulk electron–hole recombination.23 However, a Z-scheme photocatalytic system is generally constructed by employing a conductor as the electron mediator to form the known Ohmic contact with low contact resistance. Until now, many Z-scheme systems have been reported, such as TiO2–Au–CdS system,24 AgBr–Ag–AgI,25 and ZnO–Au–CdS,26 etc. Recently, studies on direct Z-scheme photocatalysts (such as g–C3N4–TiO2 and WO3–NaNbO3 system) have been investigated for photocatalytic water splitting, CO2 conversion and photocatalytic decomposition.27–29

A narrow band gap semiconductor, silicon (1.12 eV), has drawn considerable interest because of its potential application in optoelectronic devices and integrated microelectronics. Recently, studies of silicon materials have reported its promising photocatalytic activity. Shao et al. prepared hydrogen-terminated Si nanowires (Si NWs) and noble metal-modified (Pt, Pd, Au, Rh, Ag) Si NWs substrates by oxide-assisted growth method, and investigated their performance for the degradation of Rhodamine B and oxidation of benzyl alcohol to benzoic acid under visible light irradiation.30 Independently, Megouda et al. investigated the performance of hydrogen-terminated Si NWs and two kinds of metals (Ag, Cu) decorating Si NWs for the degradation of dye molecules.31 Furthermore, literature about Si/TiO2 heterojunctions that achieve enhanced photochemical and photocatalytic properties have been reported.32 Wang et al. successfully deposited TiO2 onto Si nanowire arrays to construct Si/TiO2 heterojunctions using a surface reaction-limited pulsed chemical vapor deposition method, and tailored the electrical properties of TiO2 for wider spectrum solar energy harvesting and conversion.33 Li et al. attained a novel composite material of TiO2 and porous silicon using a sol–gel method and found that it exhibits much higher photocatalytic activity for the degradation of RhB.34 Recently, direct Z-scheme Si/TiO2 tree-like heterostructures were constructed by Yang,35 which is demonstrated to greatly improve the photocatalytic activity of H2 evolution. Research on the direct Z-scheme system is just a recent work, and still needs further study.

In this work, we report a novel direct Z-scheme Si/TiO2 photocatalyst synthesized via a facile hydrothermal method with tetrabutyl titanate and Si powder prepared from the magnesiothermic reduction of SiO2 Stöber nanospheres.36 The enhanced photocatalytic conversion of CO2 reduction into value-added methanol is investigated.

2. Experimental section

2.1 Synthesis of SiO2 nanospheres

The monodisperse silica spheres were prepared by hydrolysis and condensation of tetraethoxysilane (TEOS) in a mixture of water, ammonia, and ethanol. In a typical synthesis process, 9 mL 28 wt% ammonia water was mixed with 16.25 mL ethanol and 24.75 mL deionized water under a stirring condition (solution A). 4.5 mL TEOS was added to 45.5 mL ethanol under stirring (solution B). Here, we added B to A drop by drop and strewed for another 2 h at room temperature. SiO2 nanospheres were centrifuged from the mixture, alternately washed with deionized water and ethanol 3 times and then dried at 100 °C for 12 h.

2.2 Synthesis of Si nanospheres

0.5 g SiO2 nanospheres and 0.42 g Mg powder were ground for 5 minutes and then transferred into a crucible to calcine at 750 °C for 5 h under N2 atmosphere. After cooling to room temperature, the powder was then added to 50 mL 32 wt% HCl solution with stirring for 24 h. Si nanospheres were then cleaned several times by centrifugation and water dispersion and finally dried into powders at 60 °C in a vacuum oven for 12 h.

2.3 Synthesis of direct Z-scheme Si/TiO2 nanospheres

Direct Z-scheme Si/TiO2 nanospheres were fabricated via a facile hydrothermal reaction with tetrabutyl titanate and Si nanospheres. In a typical process, 25 mL of Ti(OBu)4 and 1.5 g Si nanospheres were added in a 100 mL Teflon pot and 3 mL of hydrofluoric acid was added dropwise with stirring. After stirring for 15 min at room temperature, the Teflon pot was sealed and kept at 200 °C for 24 h. Finally, the as-prepared Si/TiO2 nanospheres were obtained after the resulting precipitate was centrifuged three times, washed with ethanol to remove the hydrofluoric acid and organics, and then dried in a vacuum oven for 12 h. Pure TiO2 sample was prepared using the same hydrothermal reaction without Si nanospheres.

2.4 Characterizations

The crystal structure of all the samples was examined by means of X-ray diffraction analysis (XRD, Bruker D8 ADVANCE with Cu-Kα radiation, λ = 1.5418 Å). The morphology and particle size were determined by field emission scanning electron microscopy (FE-SEM, Hitachi S4800) and transmission electron microscopy (TEM, JEOL JSM-2010) with an accelerating voltage of 200 kV. UV-Vis absorption spectra were obtained using a UV-Vis spectrometer (Shimadzu UV-3600). Photoluminescence (PL) spectra were obtained with an Edinburgh Instrument FLS 920 spectrometer. The excitation wavelength, λex, was 360 nm, and both the bandwidths of excitation and emission were 5 nm. The Brunauer–Emmet–Teller (BET) specific surface area of the samples were determined by a high speed automated area and pore size analyzer (ASAP 2010).

2.5 Photocatalytic reduction of CO2 under 355 laser irradiation

The photocatalytic reaction cell and its setup have been described in our earlier publication.37 The photocatalytic reactor is a cylindrical stainless steel cell with quartz windows on the top to enable the transmission of 355 nm pulse laser radiations. At the bottom of the cell there is a gas inlet with a needle valve which lets the CO2 gas pass through the distilled water in the cell and there is an outlet fixed with the rubber septum in order to dispense the sample through the syringe almost at the same level at the opposite side. The whole cell is kept on a magnetic stirrer that constantly replenishes the photocatalyst in the path of laser radiations. Care has to be taken not to let the water level go much higher than the level of the catalyst platform in order to have better interaction of radiation with the photocatalyst. Since the quantity of sample taken for gas chromatographic analysis at each time was around 4.0 μL, the water level did not decrease due to sample withdrawing from the reaction cell. The reaction cell was cleaned, dried, then was tightly closed and checked for leaks up to 50 psi pressure after 1.0 g catalyst was loaded along with 100 mL distilled water. High purity CO2 gas (99.99%) was introduced through reactor inlets and the reactor pressure was maintained at 50 psi. Prior to turning on the pulsed laser, CO2 gas was purged into 100 mL water containing 1.0 g of catalyst for 30 min in order to saturate the contents of the reactor with CO2. After a predetermined irradiation time, water samples were withdrawn from the reactor using a syringe without opening the reactor and subjected to GC analysis.

The laser (wavelength = 355 nm) used for this study was the third harmonic of the pulsed Nd:YAG laser (Model Spectra Physics GCR 250-10) operated at 10 Hz and the pulse width of ∼8 ns. Throughout this study, a laser pulse energy of 40 mJ was used. The laser beam was routed with high power UV reflecting mirrors/dichroic mirrors so that the beam enters from the top of the cell and an appropriate lens was also used to slightly expand the beam to the same diameter of the catalyst platform. Although the laser pulse energy was quite stable it was monitored throughout the experiment with the 50–50 beam splitter and the laser energy meter supplied by Coherent USA.

The water samples were analyzed for methanol and other hydrocarbons using a gas chromatograph equipped with flame ionization detector (FID). The separation was carried out on Rtx-Wax column (dimensions: 30 m × 0.32 mm × 0.32 mm) obtained from Restek, using temperature programmed conditions. For the analysis of end products, 4.0 μL of the laser irradiated sample was injected into the gas chromatograph and the operating conditions were as follows: oven temperature was set at 40 °C and was then increased to 90 °C at 5 °C min−1 heating rate and increased to 180 °C at the rate of 50 °C min−1 to elute all the components from the column before injecting another sample. The injector and detectors were both set at 200 °C and helium was used as the carrier gas. The total analysis run time was 11.8 min. A calibration plot was established for methanol standard solution in distilled water for calculating the amount of methanol produced as a function of irradiation time.

2.6 Photocatalytic reduction of CO2 under Xe arc lamp irradiation

In a typical process, 0.1 g of the sample was uniformly dispersed on the glass reactor (4.2 cm2). A 300 W Xenon arc lamp was used as the light source. The reaction system (230 mL in volume) was vacuum-treated several times, and then the high purity of CO2 gas was followed into the reaction setup to reach ambient pressure. 0.4 mL of deionized water was injected into the reaction system as reducer. The as-prepared photocatalysts were allowed to equilibrate in the CO2/H2O atmosphere for several hours to ensure that the adsorption of gas molecules was complete. During the irradiation, about 1 mL of gas was continually taken from the reaction cell at given time intervals for subsequent CH4 concentration analysis by using a gas chromatograph (GC-2014, Shimadzu Corp., Japan). All samples were treated at 300 °C in nitrogen atmosphere for 2 h for removal of organic adsorbates before the photocatalysis reaction.

2.7 Photocatalytic degradation of aqueous RhB solution

The photocatalytic activity was measured as follows: 0.100 g of as-prepared TiO2 and Si/TiO2 samples were added to a 250 mL Pyrex glass vessel which contained 200 mL RhB solution (7.5 mg L−1). The light source was a 300 W Xe arc lamp (CHF-XM500W, Beijing TrustTech Co. Ltd.) with an illumination intensity of 400 mW cm−2. Prior to irradiation, RhB solution suspended with photocatalysts was stirred in the dark for 30 min to ensure that the surface of photocatalysts reaches the adsorption–desorption equilibrium. 3 mL of the suspension was withdrawn throughout the experiment after every 10 min. The samples were analyzed by a UV-Vis spectrophotometer after removing the catalyst powders by centrifugation.

3. Results and discussion

3.1 Phase and morphology analysis

X-ray diffraction patterns of as-prepared Si nanospheres, TiO2 nanosheets and direct Z-scheme Si/TiO2 nanospheres are depicted in Fig. 1. The diffraction peaks in the XRD curve marked in red at 28.4°, 47.3°, 56.1°, 69.1°, 76.3° and 88.0° can be assigned to (111), (220), (311), (400), (331) and (422) planes of Si (JCPDS Card 27-1402), respectively. The narrow broadness of diffraction peaks for Si nanospheres indicates that the Si nanospheres prepared via a magnesiothermic reduction method have a high purity and crystallinity. The diffraction peaks in the XRD curve marked in black at 25.3°, 37.8°, 48.0°, 55.0°, 62.6°, 70.3°, 75.0° and 82.1° are indexed to the (101), (004), (200), (211), (204), (220), (215) and (303) planes of TiO2 (JCPDS Card 21-1272), respectively. From the diffraction peaks in the XRD curve of direct Z-scheme Si/TiO2 nanospheres marked in blue, which contain both the Si and TiO2 diffraction peaks, it can be seen obviously that the Si/TiO2 product obtained via a hydrothermal method is composed of Si and TiO2. The diffraction peaks of Si in the XRD curve of direct Z-scheme Si/TiO2 nanospheres are very low, which may result from its low content.
image file: c4ra10670a-f1.tif
Fig. 1 XRD patterns of the as-prepared Si nanospheres, TiO2 nanosheets and direct Z-scheme Si/TiO2 nanospheres.

As depicted in Fig. 2(a), the SiO2 nanospheres prepared via the Stöber method are monodisperse and uniform with a smooth surface and an average diameter of about 300 nm. After the magnesiothermic reduction process, Si nanospheres were obtained with a porous structure and rough surface, resulting from the loss of O atoms from SiO2 nanospheres captured by Mg under high temperature. The diameter of Si nanospheres remained mainly unchanged (as shown in Fig. 2(b)). The SEM images of the contrast TiO2 samples prepared by a hydrothermal method without adding Si nanospheres are depicted in Fig. 2(c). It can be seen that the TiO2 nanoparticles displayed a uniform sheet shape with an average edge length of about 100 nm and a thickness of about 10 nm. Fig. 2(d) shows the representative SEM image of direct Z-scheme Si/TiO2 nanospheres, clearly indicating the Si nanospheres were coated with TiO2 nanosheets.


image file: c4ra10670a-f2.tif
Fig. 2 SEM images of as-prepared SiO2 nanospheres (a), Si nanospheres (b), TiO2 nanosheets (c), and direct Z-scheme Si/TiO2 nanospheres (d).

In order to obtain further information on the structure of the samples, TEM observation of the TiO2 nanosheets and direct Z-scheme Si/TiO2 nanospheres was carried out. It can be clearly noticed from Fig. 3(a) that the as-prepared TiO2 samples are composed of a large quantity of square nanosheets with an average edge length of about 100 nm and a thickness of about 10 nm, which is in good agreement with the result obtained from the SEM images. The TEM image of Si/TiO2 direct Z-scheme nanocomposites in Fig. 3(b) clearly shows that the Si nanospheres were coated by TiO2 nanosheets. Moreover, it can be observed that the Si nanospheres appear with a porous morphology resulting from the O element captured by Mg in the magnesiothermic reduction process. The magnified TEM image of the nanostructure of the Si/TiO2 nanocomposites in Fig. 3(c) presents the TiO2 nanosheets aggregation morphology on the Si porous nanospheres, revealing the formation of the Si/TiO2 Z-scheme system. The high-magnification TEM in Fig. 3(d) depicts many different lattice fringes of the Si/TiO2 nanocomposites. The fringes with lattice spacing of ca. 0.235 nm and 0.31 nm observed in the HRTEM image match those of the (001) and (111) crystallographic planes of anatase TiO2 and Si nanoparticles, indicating the formation of Si/TiO2 interfaces via a hydrothermal method, which may improve the photocatalytic properties of TiO2.


image file: c4ra10670a-f3.tif
Fig. 3 TEM images: (a) TiO2 nanosheets, (b, c) direct Z-scheme Si/TiO2 nanospheres, (d) high-magnification TEM image of direct Z-scheme Si/TiO2 nanospheres.

3.2 Optical absorption properties

Fig. 4(a) shows the UV-Vis absorption spectra of the Si nanospheres, TiO2 nanosheets and direct Z-scheme Si/TiO2 nanospheres. It can be noticed from the spectra that the as-prepared TiO2 and Si/TiO2 nanocomposites exhibit similar absorption behaviour in the ultraviolet region. However, Si/TiO2 Z-scheme nanospheres show an enhanced absorbance throughout the visible light region due to the existence of Si which is a visible light responsive material with a band gap of 1.12 eV. The improved visible light absorption explains the enhanced photocatalytic properties of the direct Z-scheme Si/TiO2 nanospheres, as described later.
image file: c4ra10670a-f4.tif
Fig. 4 UV-Vis absorption spectra of Si nanospheres, TiO2 nanosheets and direct Z-scheme Si/TiO2 nanospheres.

3.3 Photocatalytic reduction of CO2

To evaluate the photocatalytic activity of Si nanospheres, TiO2 nanosheets and direct Z-scheme Si/TiO2 nanospheres, the conversion of CO2 into hydrocarbon fuels in distilled water was investigated using a high power pulsed laser as light source at 355 nm wavelength. As we know, a number of reaction products (such as HCHO, CH3OH, HCOOH, CO, CH4, etc.) can be obtained during the CO2 photoreduction process. The following reactions may be the pathways of CO2 photoreduction into value added hydrocarbons.
Catalyst + → ecb + h+vb

2H2O + 4h+ → 4H+ + O2 +0.82 V

CO2 + 2H+ + 2e → HCOOH −0.61 V

CO2 + 2H+ + 2e → CO + H2O −0.53 V

CO2 + 4H+ + 4e → HCHO + H2O −0.48 V

CO2 + 6H+ + 6e → CH3OH + H2O −0.38 V

CO2 + 8H+ + 8e → CH4 + H2O −0.24 V

In this study, we were selective to obtain CH3OH as the main product of CO2 photocatalytic reduction over Si/TiO2 nanocomposites. Our comparative tests demonstrated that nearly no product was found by using Si nanospheres or TiO2 nanosheets as photocatalysts. This may be due to the low conductive band potential of TiO2 and low valance band potential of Si, respectively. The conduction band (CB) and valence band (VB) edge of Si and TiO2 semiconductors were calculated by the equation as follows38 and are presented in Table 1.

ECB = XEC − 1/2Eg

EVB = Eg + ECB
where X is the absolute electronegativity of the semiconductor; EC is the energy of free electrons on the hydrogen scale (4.5 eV); and Eg is the band gap of the semiconductor.

Table 1 Relevant parameters of Ti, O, Si atoms (ionization energy, atomic electron affinity and absolute electronegativity) and TiO2, Si semiconductors (absolute electronegativity, band gap and electrochemical potentials of CB/VB band edges)a
Element Si Ti O
a The relevant data were selected from handbook.39
Atomic ionization energy (eV) 8.15168 6.82812 13.6182
Atomic electron affinity (eV) 1.38952 0.079 1.46111
Absolute electronegativity (eV) 4.7704 3.45356 7.53958

Catalyst Si TiO2
Band gap (eV) 1.1 3.2
Absolute electronegativity (eV) 4.7706 5.81193
CB band edge electrochemical potential (V vs. NHE) −0.38 −0.29
VB band edge electrochemical potential (V vs. NHE) 0.721 2.912


It can be inferred from the table that, although the calculated VB band edge electrochemical potential of TiO2 (2.91 V vs. NHE) is high enough to initiate the reaction of H2O and h+ to form O2 and H+ (0.82 V vs. NHE), the calculated CB band edge electrochemical potential (−0.29 V vs. NHE) is lower than the reaction potential needed for CO2 transformation to CH3OH with H+ and photogenerated e (−0.38 V vs. NHE), resulting in the thermodynamic impossibility of CO2 photoreduction into CH3OH over TiO2 catalyst under 355 nm laser irradiation. In the same way, pure Si catalyst has an appropriate CB band edge electrochemical potential to reduce CO2 into CH3OH with H+ and e, but its low VB band edge electrochemical potential (0.72 V vs. NHE) cannot transform any H+ from the reaction of H2O oxidation, which enables the photoreduction of CO2 into CH3OH.

Gas chromatography (GC) was employed to verify and quantify the methanol products from the CO2 reduction over direct Z-scheme nanospheres. It is depicted in Fig. 5(a) that the retention time for methanol standard is 2.46 min for the selected GC parameters and the used column. The relationship between GC peak area and methanol concentration was confirmed by using known methanol concentrations in a standard sample for calibration as depicted in Fig. 5(b), which exhibits a linear trend.


image file: c4ra10670a-f5.tif
Fig. 5 (a) GC peak position of methanol standard, (b) calibration curve for methanol concentration vs. GC peak area.

Fig. 6(a) depicts the GC peaks of products for samples from CO2 photoreduction, which are taken in 30 min intervals of irradiation with 355 nm laser by using Si/TiO2 as the photocatalyst. It can be seen clearly that all the GC peaks in Fig. 6(a) appear at exactly 2.46 min of the retention time and no other GC peaks were detected, which suggests that the methanol is the only product obtained through the laser induced photocatalytic reduction of CO2, possibly because of the sharp line width of the laser beam centred around 355 nm (highly monochromatic) of the pulsed laser radiation. Furthermore, it was shown that the GC peak areas of methanol from CO2 photoreduction increase with the irradiation time (30 min, 60 min, 90 min, 120 min, 150 min) and reach the maximum in 150 min of irradiation after which they start to fall. Fig. 6(b) shows the concentration variation of the photocatalytic process of converting CO2 into methanol with laser irradiation. It can be observed that the produced methanol concentration increases with laser irradiation time and reaches its maximum (197 μM/100 mL) at 150 min, but afterwards it declines. The decrease of the methanol concentration may be caused by the existence of photocatalytic oxidation effect of Si/TiO2 composed semiconductor with positive VB position. When the methanol was produced in a substantial amount, it will be adsorbed on the surface of the photocatalysts and oxidized to inorganic matter, which is in agreement with the results obtained by, and explanation of, other groups.37,40,41


image file: c4ra10670a-f6.tif
Fig. 6 (a) GC peaks of methanol for sample taken every 30 min of irradiation with a laser pulse energy of 40 mJ per pulse at 355 nm radiation with 600 mg catalyst in 100 mL distilled water, 50 psi CO2 pressure. (b) Concentration of produced CH3OH and conversion efficiency with time.

In order to estimate the efficiency of CO2 conversion into methanol using direct Z-scheme Si/TiO2 nanospheres as the photocatalyst with 355 nm laser irradiation, the process of the CO2 conversion efficiency was estimated. The amount of CO2 dissolved in distilled water under our experimental conditions can be calculated from Henry’s law and the amount of CO2 dissolved in 1 L water at atmospheric pressure is 34 mmol (Henry constant). As the pressure in the photocatalytic measurement is 50 psi (3.4 atm), the total CO2 dissolved in 100 mL of water is 11.56 mmol. Once we know the methanol concentration at different irradiation times of the photocatalytic process, the CO2 conversion efficiency can be calculated from the quotient of actual concentrations of methanol and CO2 concentration (as shown in Fig. 6(b)). For that the maximum concentration of methanol is 197 μM/100 mL after 150 minutes of laser irradiation, the maximum CO2 conversion efficiency is calculated (197/11[thin space (1/6-em)]560) to be about 1.71%. However, according to Schüler’s experimental result,42 the CO2 solubility in binary mixtures of water and methanol increases with increasing methanol content, resulting in the actual CO2 conversion efficiency being slightly lower than the calculated efficiency (1.71%).

Moreover, we can calculate the photonic efficiency of the photocatalytic reduction of CO2 from the number of methanol molecules produced for certain irradiation time and the number of consumed photons in the reaction. The number of methanol molecules can be estimated from the molar concentrations and Avogadro’s number. In the case of laser, the number of photons at 355 nm wavelength with the laser pulse energy of 40 mJ per pulse and repetition rate of 10 Hz can be calculated to be 4.286 × 10¹⁹ photons per min. The maximum rate of methanol is 1.294 × 10¹⁸ molecules per min at the irradiation time interval from 60 min to 90 min. As a single methanol molecule needs 6 photogenerated electrons, the maximum photonic efficiency (P.E.) of photoreduction of CO2 can be calculated (6 × 1.294 × 1018/4.286 × 1019) to be about 18.1%. The achievement of high photonic efficiency of direct Z-scheme Si/TiO2 nanospheres may be due to the construction nature of Si/TiO2 direct Z-scheme system.

3.4 Mechanism analysis of the enhanced photocatalytic activity of Si/TiO2

As shown in Fig. 7, photoluminescence spectroscopy was employed for further investigation of the photocatalytic activities of TiO2 nanosheets and direct Z-scheme Si/TiO2 nanospheres. Two major components of the spectrum of direct Z-scheme Si/TiO2 nanospheres consisted of a strong peak at 540 nm and a weak, broad peak from 400 to 520 nm, which are attributed to Si and TiO2, respectively. Moreover, it can be seen clearly that the peak intensities in photoluminescence intensity of Si/TiO2 Z-scheme nanospheres are much lower in contrast to that of Si nanospheres and TiO2 nanosheets. As the PL emission resulted from the recombination of photo-induced charge carriers and information regarding the efficiency of charge carrier trapping, and their recombination kinetics can be drawn from the PL spectra,43 it can be inferred that direct Z-scheme Si/TiO2 nanospheres have a higher efficient separation rate of photogenerated charge carriers than that of TiO2 nanosheets, which can be attributed to the formation of the Si/TiO2 direct Z-scheme system.
image file: c4ra10670a-f7.tif
Fig. 7 Photoluminescence spectra of TiO2 nanosheets and direct Z-scheme Si/TiO2 nanospheres.

In order to confirm the effect of the Si/TiO2 direct Z-scheme system on improving the charge separation efficiency, RhB was selected to be the target pollutant for degradation by Si nanospheres, TiO2 nanosheets and direct Z-scheme Si/TiO2 nanospheres under 300 W Xe arc lamp irradiation with an illumination intensity of 400 mW cm−2. As shown in Fig. 8(a), it can be clearly seen that RhB molecules were completely decomposed by Si/TiO2 direct Z-scheme nanospheres after 1 h Xe arc lamp irradiation, while only 88.5% were decomposed by TiO2 nanosheets and 6.6% by Si nanospheres, indicating the enhanced photocatalytic activity of the Si/TiO2 Z-scheme compared with the TiO2 nanosheets and Si nanospheres. Fig. 8(b) depicts the kinetic study of photocatalytic degradation of RhB solution over the three photocatalytic materials. The linear relationship of ln(C0/C) vs. irradiation time suggests that degradation of RhB is a first order reaction. The calculated rate constants for Si nanospheres, TiO2 nanosheets and Si/TiO2 Z-scheme nanospheres are 0.000772, 0.0354 and 0.074 min−1, respectively, from which it can be seen that the Si/TiO2 Z-scheme has the best photocatalytic activity, which is 2.09 times that of the TiO2 nanosheets and 95.8 times the Si nanospheres. Therefore, construction of the Si/TiO2 Z-scheme is beneficial to improve the photocatalytic activity of Si and TiO2 extensively.


image file: c4ra10670a-f8.tif
Fig. 8 Photocatalytic degradation rates (a) and the ln(C0/C) vs. irradiation time curves of RhB (b).

Furthermore, the CO2 photocatalytic reduction under Xe arc lamp irradiation was carried out to investigate the influence of light source and experimental conditions on the product. Fig. 9(a) shows that CO2 can be photoreduced to CH4 by using all the prepared samples as photocatalysts. It is obvious that the direct Z-scheme Si/TiO2 nanocomposites exhibit much higher activity than pure TiO2 nanosheets and Si nanospheres. The higher conversion is attributed to the improved photogenerated carriers separation efficiency of the Si/TiO2 Z-scheme system. To further investigate whether CH4 is a product of CO2 photocatalytic reduction, we carried out a series comparative experiments to investigate the source of C and H in the produced CH4 under Xe arc lamp irradiation. As shown in Fig. 9(b), the CH4 detected in normal conditions is much higher than that in other experiments. It should be noted that the extremely low CH4 concentrations in non-normal conditions are from the naturally occurring CH4 in air (1–2 ppm). In other words, CH4 can be produced only in the case of possessing all the conditions including catalyst, CO2, H2O and light. It can be inferred from the contrast experiment that C in the photoreduction product CH4 is from CO2, while H is from H2O. Therefore, it can be confirmed that the detected CH4 is from the photoreduction of CO2, but not a product of organic oxidation at the Si/TiO2 Z-scheme or release of surface bound organics.


image file: c4ra10670a-f9.tif
Fig. 9 (a) CH4 evolution with time under Xe arc lamp irradiation, (b) comparative experiments of the CO2 photoreduction under different conditions.

Because the photocatalytic process is surface orientated, the specific surface areas of the prepared TiO2 nanosheets and Si/TiO2 nanocomposites were also measured by BET to study the actual exposed surface area in the photocatalytic reaction. As shown in Fig. 10, the Si/TiO2 sample possesses a slightly higher specific surface area (165.4 m2 g−1) than TiO2 nanosheets (154.3 m2 g−1) due to the surface structuring effect by the formation of spherical heterostructures with TiO2 nanosheets well dispersed. In the photocatalytic reduction of CO2 experiments, our results show that only the Si/TiO2 sample is capable of producing methanol under laser irradiation due to thermodynamics, indicating that the exposed surface area of the catalyst has no effect on its photocatalytic reduction activity. In the photocatalytic degradation experiment, 0.1 g of the as-prepared Si, TiO2 and Si/TiO2 catalysts was adopted, respectively. The slight difference of the catalysts in specific surface area is as small as 6.6%, which is suggested to not be the main reason for the great improvement of photodegradation efficiency (more than twice). Hence, it can be concluded that the excellent performance of the Si/TiO2 catalyst does not result from a surface structuring effect, but from the improved photogenerated carriers’ concentration and separation efficiency from the Si/TiO2 direct Z-scheme system construction.


image file: c4ra10670a-f10.tif
Fig. 10 N2 adsorption–desorption isotherms of TiO2 nanosheets and direct Z-scheme Si/TiO2 nanospheres.

Fig. 11 illustrates the schematic charge flow in the Si/TiO2 direct Z-scheme system under illumination. 355 nm lasers can be harvested by both Si and TiO2 to generate e–h+ pairs. As reported in Yang’s previous research,32 the photogenerated hole in TiO2 (TiO2h+) moves toward the TiO2/electrolyte interface and oxidizes OH to oxygen, while photogenerated electrons in the TiO2 (TiO2e) move away from the interface between TiO2 and the electrolyte due to the schottky barrier. The potential barrier at the Si/TiO2 interface reflects holes back into the TiO2 layers. To complete the circuit, the photogenerated electrons in Si (Sie) move to the surface where the CO2 reduction reaction takes place. The photogenerated hole in Si (Sih+) moves towards the Si/TiO2 interface and recombines with the TiO2e. Therefore, the direct Z-scheme Si/TiO2 nanospheres show high activity towards CO2 reduction into methanol since its band alignment at the junction helps reduce recombination under illumination. However, for individual Si photocatalysts, its VB potential (+0.721 V vs. NHE) is not high enough to achieve the oxidation reaction potential (O2/H2O 0.82 V vs. NHE). Similarly, the CB potential of TiO2 (−0.29 V vs. NHE) is too low to initiate the CO2 reduction reaction into methanol (CH3OH/CO2 −0.38 V vs. NHE). In other words, the individual Si nanospheres or TiO2 nanosheets lack suitable VB or CB potential to photoreduce CO2 into methanol.


image file: c4ra10670a-f11.tif
Fig. 11 Schematic diagram of the enhanced photocatalytic property of the Si/TiO2 direct Z-scheme system for CO2 reduction.

4. Conclusion

In summary, we have presented a facile and low cost method to prepare a direct Z-scheme Si/TiO2 nanostructure via hydrothermal reaction with tetrabutyl titanate and Si powder which was prepared from the magnesiothermic reduction of SiO2 Stöber nanospheres. All the results indicate that Si/TiO2 nanocomposites possess much higher photocatalytic activity than individual Si and TiO2 samples for the CO2 conversion and degradation of RhB. This excellent performance could be attributed to the integrated suitable conductive band of Si and valence band of TiO2 for CO2 reduction and improved light absorption ability, enhanced concentration of photogenerated carriers, and higher separation efficiency due to the elaborate construction of the Si/TiO2 direct Z-scheme system.

Acknowledgements

This work was financially supported by the National Natural Science Foundation of China (no. 51172109), the Fundamental Research Funds for the Central Universities (no. NS2014057), Funding of Jiangsu Innovation Program for Graduate Education (no. CXLX12_0148), and the Fundamental Research Funds for the Central Universities. This work is also supported by KFUPM through project # RG1011-1/2.

Notes and references

  1. C. J. Wang, O. Ranasingha, S. Natesakhawat, P. R. Ohodnicki, M. Andio, J. P. Lewis and C. Matranga, Nanoscale, 2013, 5, 6968–6974 RSC.
  2. F. C. Meunier, Angew. Chem., Int. Ed., 2011, 50, 4053–4054 CrossRef CAS PubMed.
  3. Y. S. Chaudhary, T. W. Woolerton, C. S. Allen, J. H. Warner, E. Pierce, S. W. Ragsdale and F. A. Armstrong, Chem. Commun., 2012, 48, 58–60 RSC.
  4. S. C. Yan, S. X. Ouyang, J. Gao, M. Yang, J. Y. Feng, X. X. Fan, L. J. Wan, Z. S. Li, J. H. Ye, Y. Zhou and Z. G. Zou, Angew. Chem., Int. Ed., 2010, 49, 6400–6404 CrossRef CAS PubMed.
  5. Q. Liu, Y. Zhou, J. H. Kou, X. Y. Chen, Z. P. Tian, J. Gao, S. C. Yan and Z. G. Zou, J. Am. Chem. Soc., 2010, 132, 14385–14387 CrossRef CAS PubMed.
  6. N. Zhang, S. X. Ouyang, T. Kako and J. H. Ye, Chem. Commun., 2012, 48, 1269–1271 RSC.
  7. P. Q. Wang, Y. Bai, P. Y. Luo and J. Y. Liu, Catal. Commun., 2013, 38, 82–85 CrossRef CAS PubMed.
  8. T. Wang, X. G. Meng, P. Li, S. X. Ouyang, K. Chang, G. G. Liu, Z. W. Mei and J. H. Ye, Nano Energy, 2014, 9, 50–60 CrossRef CAS PubMed.
  9. S. S. Tan, L. Zou and E. Hu, Catal. Today, 2006, 115, 269–273 CrossRef CAS PubMed.
  10. O. Ozcan, F. Yukruk, E. U. Akkaya and D. Uner, Top. Catal., 2007, 44, 523–528 CrossRef CAS.
  11. K. R. Thampi, J. Kiwi and M. Graetzel, Nature, 1987, 327, 506–508 CrossRef CAS.
  12. A. L. Linsebigler, G. Q. Lu and J. T. Yates, Chem. Rev., 1995, 95, 735–758 CrossRef CAS.
  13. S. T. Hussain, K. Khan and R. Hussain, J. Nat. Gas Chem., 2009, 18, 383–391 CrossRef CAS.
  14. O. K. Varghese, M. Paulose, T. J. Latempa and C. A. Grimes, Nano Lett., 2009, 9, 731–737 CrossRef CAS PubMed.
  15. J. G. Yu, G. P. Dai, Q. J. Xiang and M. Jaroniec, J. Mater. Chem., 2011, 21, 1049–1057 RSC.
  16. K. Koci, L. Matejova, L. Obalova, S. Krejckov, Z. Lacny, D. Placha, L. Capek, A. Hospodkovad and O. Solcova, Appl. Catal., B, 2010, 96, 239–244 CrossRef CAS PubMed.
  17. W. B. Hou, W. H. Hung, P. Pavaskar, A. Goeppert, M. Aykol and S. B. Cronin, ACS Catal., 2011, 1, 929–936 CrossRef CAS.
  18. K. P. Yu, W. Y. Yu, M. C. Kuo, Y. C. Liou and S. H. Chien, Appl. Catal., B, 2008, 84, 112–118 CrossRef CAS PubMed.
  19. Y. Li, W. N. Wang, Z. Zhan, M. H. Woo, C. Y. Wu and P. Biswas, Appl. Catal., B, 2010, 100, 386–392 CrossRef CAS PubMed.
  20. C. J. Wang, R. L. Thompson, P. Ohodnicki, J. Baltrus and C. Matranga, J. Mater. Chem., 2011, 21, 13452–13457 RSC.
  21. S. Qin, F. Xin, Y. Liu, X. Yin and W. J. Ma, J. Colloid Interface Sci., 2011, 356, 257–261 CrossRef CAS PubMed.
  22. Q. D. Truong, J. Y. Liu, C. C. Chunq and Y. C. Ling, Catal. Commun., 2011, 19, 85–89 CrossRef PubMed.
  23. P. Zhou, J. G. Yu and M. Jaronniec, Adv. Mater., 2014, 26, 4920–4935 CrossRef CAS PubMed.
  24. H. Tada, T. Mitsui, T. Kiyonaga, T. Akita and K. Tanaka, Nat. Mater., 2006, 5, 782–786 CrossRef CAS PubMed.
  25. H. Lin, J. Cao, B. Luo, B. Xu and S. Chen, Catal. Commun., 2012, 21, 91–95 CrossRef CAS PubMed.
  26. Z. B. Yu, Y. P. Xie, G. Liu, G. Q. Lu, X. L. Ma and H. M. Cheng, J. Mater. Chem. A, 2013, 1, 2773–2776 CAS.
  27. J. G. Yu, S. H. Wang, J. X. Low and X. Wei, Phys. Chem. Chem. Phys., 2013, 15, 16883–16890 RSC.
  28. M. Miyauchi, Y. Nukui, D. Atarashi and E. Skai, ACS Appl. Mater. Interfaces, 2013, 5, 9770–9776 CAS.
  29. Y. C. Wang, J. Tang, Z. Peng, Y. H. Wang, D. S. Jia, B. Kong, A. A. Elzatahry, D. Y. Zhao and G. F. Zheng, Nano Lett., 2014, 14, 3668–3673 CrossRef CAS PubMed.
  30. M. W. Shao, L. Cheng, X. H. Zhang, D. D. D. Ma and S. T. Lee, J. Am. Chem. Soc., 2009, 131, 17738–17739 CrossRef CAS PubMed.
  31. N. Megouda, Y. Cofininier, S. Szunerits, T. Hadjersi, O. ElKechai and R. Boukherroub, Chem. Commun., 2011, 47, 991–993 RSC.
  32. Y. J. Hwang, A. Boukai and P. D. Yang, Nano Lett., 2009, 9, 410–415 CrossRef CAS PubMed.
  33. J. Shi and X. D. Wang, Energy Environ. Sci., 2012, 5, 7918–7922 CAS.
  34. Q. D. Wu, D. Z. Li, Z. X. Chen and X. Z. Fu, Photochem. Photobiol. Sci., 2006, 5, 653–655 CAS.
  35. C. Liu, J. Y. Tang, M. Chen, B. Liu and P. D. Yang, Nano Lett., 2013, 13, 2989–2992 CrossRef CAS PubMed.
  36. W. Stöber, A. Fink and E. J. Bohn, J. Colloid Interface Sci., 1968, 26, 62–69 CrossRef.
  37. M. A. Gondal, M. A. Ali, X. F. Chang, K. Shen, Q. Y. Xu and Z. H. Yamani, J. Environ. Sci. Health, Part A, 2012, 47, 1571–1576 CrossRef CAS PubMed.
  38. X. F. Chang, J. Huang, C. Cheng, Q. Sui, W. Sha, G. B. Ji, S. B. Deng and G. Yu, Catal. Commun., 2010, 11, 460–464 CrossRef CAS PubMed.
  39. D. R. Lide, Handbook of Chemistry and Physics, CRC Press, Florida, 87th edn, 2006–2007 Search PubMed.
  40. S. Suzuki, T. Tsuneda and K. Hirao, J. Chem. Phys., 2012, 136, 024706 CrossRef PubMed.
  41. C. Y. Wang, J. Rabani, D. W. Bahnemanna and J. K. Dohrmann, J. Photochem. Photobiol., A, 2002, 148, 169–176 CrossRef CAS.
  42. N. Schüler, K. Hecht, M. Kraut and R. Dittmeyer, J. Chem. Eng. Data, 2012, 57, 2304–2308 CrossRef.
  43. L. Q. Jing, Y. C. Qu, B. Q. Wang, S. D. Li, B. J. Jiang, L. B. Yang, W. Fu, H. G. Fu and J. Z. Sun, Sol. Energy Mater. Sol. Cells, 2006, 90, 1773–1787 CrossRef CAS PubMed.

This journal is © The Royal Society of Chemistry 2014