DOI:
10.1039/C4RA10620B
(Paper)
RSC Adv., 2014,
4, 56373-56384
Biocompatible electrospinning poly(vinyl alcohol) nanofibres embedded with graphene-based derivatives with enhanced conductivity, mechanical strength and thermal stability†
Received
17th September 2014
, Accepted 21st October 2014
First published on 23rd October 2014
Abstract
Glycine-modified graphene oxide (GMGO) and its derivative, nanogold-deposited graphene oxide (AuGO), were prepared and then embedded into the matrix of poly(vinyl alcohol) (PVA) nanofibres by electrospinning. The scanning electron microscopy images showed that the morphologies of the nanofibres were improved by the incorporation of GMGO at a low loading content (e.g., 0.1–0.5 wt%) compared with pure electrospun PVA. The two-dimensional, high-aspect ratio GMGO sheets were folded into the nanofibres with a diameter smaller than 150 nm; the microstructures were evaluated using high-resolution transmission electron microscopy. Performing X-ray diffraction analysis revealed that the GMGO-incorporated nanofibres exhibited increased crystallinity. Substantially improved properties, particularly conductivity, mechanical strength, and thermal stability, of PVA electrospun nanofibres embedded with GMGO and AuGO were demonstrated. Analysing PVA composite fibre mats using an electrochemical impedance spectrometer revealed that embedding with GMGO decreased impedance, and that embedding with AuGO decreased it even further. The storage modulus increased by 50.5% and the thermal decomposition temperature increased by approximately 20 °C in the 0.5 wt% GMGO/PVA electrospun nanofibre mats compared with pure PVA nanofibres. Cellular toxicity tests of these electrospun nanofibres showed almost no cytotoxicity to L929 cells.
1. Introduction
Electrospinning technology has been used to develop polymer nanofibres, which have been applied in fields such as catalysts, sensors, ion-exchange membranes, tissue engineering, drug delivery, and bioengineering.1–9 Electrospun poly(vinyl alcohol) (PVA) nanofibres are biocompatible, possess high surface area properties, and can be applied as scaffolds in biomedical and biological engineering.10,11 Multiple reports have researched the optimal conditions of PVA electrospinning for fabricating nanofibres with well-prepared morphology by controlling processing parameters such as the applied voltage, distance from the syringe needle to the collection plate, pump flow rate, and polymer concentration.12 Although PVA electrospinning nanofibers have excellent properties such as biocompatibility, nontoxicity, processability, and hydrophilicity. However, the disadvantages such as water soluble, weak mechanical and thermal stability should be considered.13 In addition, functional properties such as optical, electrical, catalytic, or antibacterial properties can be incorporated into nanofibres. For example, introducing silver or gold nanoparticles into polymer nanofibres renders such polymer fibres suitable for antibacterial wound material and tissue engineering applications.14–19 PVA fibres incorporated with graphene or gold particles can also be applied to sensors to increase sensitivity.20,21 Electrospinning fibre mats incorporated with conductive materials could possess an increased conductivity and a low electron resistance on its surface. It is also beneficial because there is a large surface area for these electrospun fibres fabricated in nanoscale diameters. Potential application fields such as using for electrical stimulation in tissue engineering.22
Graphene has attracted much research and has been applied in various areas because of its excellent properties such as mechanical properties, thermal stability, and conductivity.23–26 Improving properties of PVA nanofibres by modifying with graphene derivatives will be synchronous in conductivity, mechanical and thermal properties base on the excellent properties of graphene derivatives. Recently, PVA/graphene based composite nanofibers have attracted the interest of numerous researchers. For example, Song et al. reported that the studies hydrogen bonding-driven rheological modulation of the PVA solution and the fibrous morphology of electrospun nanofibers by simply controlling the rheology using graphene oxide (GO) and chemically reduced graphene oxide (RGO).27 Their results concluded that a small amount of GO could electrospun bead-free and fine nanofibres with more narrow size distribution; and the thermal stability of the nanofibres was also enhanced by GO or RGO addition. Wu et al. reported PVA/glucose oxidase/graphene nanofibrous membranes for glucose oxidase immobilization.28 Their results showed that the presence of graphene helps to stabilize the enzyme's conformation, facilitate the catalytic reaction, and increase the survivability of the enzyme. Yan et al. reported mouse osteoblasts (MC3T3-E1 cells) attached and spread on the surfaces of the PVA and PVA/GO scaffolds; the adding of GO do not affect the cells' viability.29,30 Therefore, the incorporation of graphene-based derivatives in the PVA nanofibres may exhibit with various properties for scaffold applications, especially in thermal stability, mechanical strength, conductivity and biocompatibility.
In this paper, we report a series of PVA, glycine-modified graphene oxide (GMGO)/PVA, and nanogold-deposited graphene oxide (AuGO)/PVA nanofibres fabricated using electrospinning technique. Due to glycine is a biocompatible amino acid, the GMGO was reported as a biocompatible modification of graphene.31 In addition to the consideration of biocompatibility, the incorporation of GMGO in the PVA matrix will enhance the dispersion of GMGO layers through hydrogen bonding between the functional groups of GMGO and hydroxyl groups of PVA. Due to GMGO is a reduced graphene oxide, conductivity improvement will be expected for the PVA electrospinning nanofibres. However, the high-aspect ratio of GMGO layers, with micrometres scaled length and width, must be rolled or folded in the nanoscaled diameter of electrospun nanofibres; whether this is possible warranted investigation. The optimal conditions of PVA, GMGO/PVA, and AuGO/PVA electrospinning were studied for fabricating nanofibres with well-fibres morphology by controlling processing parameters such as the applied voltage, distance from the syringe needle to the collection plate, pump flow rate, and polymer concentration. The morphology, diameter, and crystallinity of electrospun nanofibres were investigated using scanning electron microscopy (SEM), transmission electron microscopy (TEM), and X-ray diffraction (XRD).
Furthermore, the glycine grafted on the surface of GMGO can also be used as a reducing agent. Surface-grafted glycine was applied for reacting with hydrogen tetrachloroaurate (HAuCl4), which grows with gold nanoparticles on the surface of the GO layers. Therefore, it is possible to introduce gold nanoparticles into electrospun nanofibres to improve electrical conductivity because of its high specific surface area and improved conductivity. The high specific surface area of nanofibres with well-dispersed nanogold particles produced using a graphene-grafting method can be used as a new method for fabricating nanoparticle-containing nanofibres. The electron conductivity properties of the nanofibres were first studied by using an electrochemical impedance spectrometer (EIS). In addition, the mechanical strength and thermal stability of these GMGO/PVA and AuGO/PVA nanofibres would be enhanced synchronously because the strong interfacial strength through hydrogen bonding and high specific surface interaction between the graphene derivatives and polymer matrix. The storage modulus and thermal stabilities of the GMGO/PVA and AuGO/PVA nanofibres were studied using a dynamic mechanical analysis (DMA) thermal gravimetric analyser (TGA) and a differential scanning calorimeter (DSC). To evaluate the biocompatibility for PVA electrospun mats by incorporation of GMGO and AuGO, cytotoxicity tests were investigated on L929 cells.
2. Experimental section
2.1 Materials and instrumentation
Graphite (Angstron Materials, Inc., N008-100-P-10, Nano Graphene Platelets), sulphuric acid (Sigma-Aldrich), phosphoric acid (J.T. Baker), potassium permanganate (J.T. Baker), hydrogen peroxide (30%, Sigma-Aldrich), hydrochloric acid (37%, Sigma-Aldrich), PVA (Sigma-Aldrich, 87–90% hydrolysed, average molecular weight 30![[thin space (1/6-em)]](https://www.rsc.org/images/entities/char_2009.gif) 000 to 70000 g mol−1), glycine (Sigma-Aldrich), hydrogen tetrachloroaurate(III) trihydrate (Alfa Aesar), ethanol (Sigma-Aldrich), and acetone (Sigma-Aldrich) were used as-received without further purification. All the reagents were of reagent grade, unless otherwise stated.
000 to 70000 g mol−1), glycine (Sigma-Aldrich), hydrogen tetrachloroaurate(III) trihydrate (Alfa Aesar), ethanol (Sigma-Aldrich), and acetone (Sigma-Aldrich) were used as-received without further purification. All the reagents were of reagent grade, unless otherwise stated.
FTIR spectra were obtained using a PerkinElmer Spectrum 100 infrared spectrometer at room temperature. XPS was run on a model of VG Scientific ESCALAB 250. The intrinsic viscosity measurement of as-synthesized materials was carried out using a Brookfield DV-II+Pro viscometer in a diionic water phase. Wide-angle powder XRD was performed using a Bruker D2 Phaser X-ray diffractometer with a copper target and a nickel filter at an operating voltage of 30 kV, an operating current of 10 mA, a scanning range of 5° to 60°, and a scanning speed of 2.4° min−1. Decomposition temperature analyses were conducted under a nitrogen atmosphere by using a PerkinElmer TGA7 thermogravimetric analyser with a programmed heating rate of 10 °C min−1 from 50 °C to 900 °C. The nanoscale structures of the composites were examined using a JEOL JEM-1400 TEM and a JEOL JEM-2100F high-resolution TEM. A Hitachi S-3000N SEM was employed for the morphological analysis of electrospun nanofibres. A Zennium electrochemical workstation was used to determine the AC impedance of specimens fabricated with a layer of electrospun mat on a platinum electrode with an interdigitised array (IDA) manufactured by ALS Co., Ltd. Measurements were obtained over a frequency range of 105 to 10−2 Hz. DSC analysis was performed using a PerkinElmer DSC8500 with a programmed heating rate of 10 °C min−1 over a temperature range of 30 °C to 300 °C. A TA Instruments Q800 dynamic mechanical analyser was used to analyse the mechanical properties. The samples were measured at below 1 Hz at a heating rate of 3 °C min−1, with a temperature range between 40 °C and 100 °C. The sample dimensions for DMA were 10.25 mm × 4.55 mm × 0.07 mm. The thickness of nanofibrous mats were measured using a digimatic micrometer of Mitutoyo Corporation.
2.2 Synthesis of glycine-modified graphene oxide
The preparation flowcharts of GO, GMGO, and AuGO are illustrated in Scheme 1. GO was synthesised by the oxidation of graphite, which was achieved using an improved Hummers method.32 GO (0.5 g) was dispersed using a sonicator for at least 2 h in H2O (50 mL) (Solution 1). Glycine (4 g) was dissolved in H2O (50 mL) in another flask by using a sonicator for 5 min (Solution 2). Solution 1 was heated to approximately 98 °C, and Solution 2 was then slowly added to Solution 1 and refluxed for 4 h. After cooling the solution to room temperature, the solution was poured into a centrifuge tube. The crude product was collected through centrifugation at 9000 rpm for 10 min. The crude product was sequentially washed with water, and collected through centrifugation. The process was repeatedly several times until the liquid phase was clear. The GMGO was obtained and then dried in vacuo at 40 °C for 16 h with a 90% yield.
 |
| | Scheme 1 The preparation flowcharts of GO, GMGO, and AuGO. | |
2.3 Preparation of nanogold-deposited graphene oxide
GMGO (0.1 g) was dispersed using a sonicator for 90 min in distilled water (5 g), and more distilled water (50 g) was then added and stirred for 12 h (Solution 1). HAuCl4 (0.04 g) was dissolved in distilled water (10 mL) in another flask (Solution 2). Solution 2 was slowly added to Solution 1, and then added into a water bath preheated to 98 °C. The solution was further heated for 6 min; during this period, the colour of the solution became red-brown. The reaction was immediately stopped by cooling the solution, using an ice bath, and the solution was then collected and poured into several centrifuge tubes. The product was collected through centrifugation at 9000 rpm for 10 min. The crude product was sequentially washed with water, and collected by centrifugation. The process repeatedly several times until the liquid phase was clear. The AuGO was obtained and then dried in vacuo at 40 °C for 24 h.
2.4 Preparation of GMGO/PVA and AuGO/PVA composite solutions
PVA (2 g) was dissolved in distilled water (5 g) by stirring and heating at 80 °C. After the solution cooled to room temperature, another flask containing a dispersed solution of GMGO or AuGO in distilled water (5 g), which was prepared by sonicating for 30 min and stirring for 2 h, was then added to the PVA solution and stirred for 24 h to obtain a homogeneous liquid. Solutions incorporated with 0.1 wt%, 0.3 wt%, 0.5 wt%, and 1 wt% GMGO or AuGO composites were prepared and compared with pure PVA.
2.5 GMGO/PVA or AuGO/PVA nanofibres and the working electrode prepared using electrospinning
The optimised conditions of GMGO/PVA nanofibres were studied using an electrospinning system (Scheme 2). The GMGO/PVA nanofibres were prepared using electrospinning with applied voltages from 10 to 20 kV, and the syringe pump flow rate was 0.1–0.3 mL h−1. The concentration of the as-prepared composite solution was approximately 16.67%. The collection plate was covered with a layer of aluminium foil and controlled with a rotation speed of 70 rpm. The distance between the syringe needle and the collection plate was 12 cm. The working electrodes for AC impedance measurement were electrospun at a feeding flow rate of 0.1 mL h−1 and a voltage of 20 kV for 1 h, using the as-prepared PVA, GMGO/PVA, and AuGO/PVA composite solutions.
 |
| | Scheme 2 Electrospinning apparatus and the as-prepared electrospun nanofibre mat. | |
2.6 Cell culture in vitro experiment
L929 cells (Mus musculus fibroblast cell line) were cultured in an DMEM (Dulbecco's Modified Eagle Medium) supplemented with 10% fetal bovine serum (FBS) and 1% antibiotics (antibiotic–antimycotic, AA) at 37 °C under environment containing 5% CO2. In vitro cell viability of PVA, 0.1%-, 0.3%-, 0.5%-, 1%-GMGO/PVA and 1% AuGO/PVA electrospun nanofibre mats were assessed by 3-[4,5-dimethylthiazol-2-yl]-2,5-diphenyltetrazolium bromide (MTT) assay. L929 cells by 2 × 10⁴ cells per well were seeded in 24-well culture plates for 24 h to allow the cells to attach, and were then exposed to 200 μg mL−1 of PVA, 0.1%-, 0.3%-, 0.5%-, 1%-GMGO/PVA and 1% AuGO/PVA electrospun nanofibre mats in 5% CO2 at 37 °C. After 24 h incubation, 20 μL of MTT solution (diluted in PBS with a final concentration of 5 mg mL−1) was added and incubated for another 4 h. The medium was then replaced with 500 μL of dimethyl sulfoxide (DMSO), and the absorbance was monitored using a microplate reader at a wavelength of 570 nm. Cell viability was expressed as a percentage compared to the untreated control cells.
3. Results and discussion
The GO was synthesised by oxidising graphite, which was achieved using an improved Hummers method,32 followed by an amino acid functional modification of glycine to form GMGO; the AuGO was prepared by reducing glycine to form nanoparticles grafted on the graphene surface (Scheme 1).
The mechanism was proposed as follows:33
(1) The protonation of the functional groups on the GO:
–HN–C![[double bond, length as m-dash]](https://www.rsc.org/images/entities/char_e001.gif) O + H+ → –HN–COH+ O + H+ → –HN–COH+ |
| –HN–CO + 2H+ → –NH2+–COH+ |
(2) The Au(III) complex formation on the GO: 2- or 4-coordinated Au(III) complexes were proposed because the 5d86s0 hybrid Au(III) can be coordinated using oxygen- or nitrogen-containing ligands.
| AuCl4− + 4(–C–OH2+) → Au(III)(–C–OH)4 + 4HCl |
| AuCl4− + 2(–CO2H2+) → Au(III)(–CO2−)2 + 4HCl |
| AuCl4− + 4(–HN–COH+) → Au(III)(–HN–CO)4 + 4HCl |
| AuCl4− + 2(–NH2+–COH+) → Au(III)(–HN–CO)2 + 4HCl |
(3) The reduction of the coordinated Au(III) complexes on the GO: the coordinated Au(III) complexes would be reduced to the 5d106s0 hybrid Au(I) complexes such as Au(I)(–C–OH)2, Au(I)(–CO2−)2, and Au(I)(–HN–CO)2, and then further reduced to Au(0) nanoparticles with 5d106s1 hybrid orbitals.
3.1 Fourier transform infrared analysis
The representative FTIR spectra of the GO, GMGO, glycine, and AuGO materials are shown in Fig. 1. The characteristic GO absorption bands (Fig. 1(a)) appeared at 3010–3680 cm−1 (–OH stretching), 1732 cm−1 (–CO stretching), 1627 (–CC stretching), 1220 cm−1 (C(O)–OH bending), and 1045 cm−1 (C–O–C stretching), which provided evidence of carboxylic acid, epoxide, and hydroxide functional groups.32 The FTIR spectrum of GMGO (Fig. 1(b)) showed absorption bands at 3379 cm−1 (–OH stretching), 3150 cm−1 (–NH stretching of amide), 1652 cm−1 (–CO stretching of amide), 1621 cm−1 (–CC stretching), 1503 cm−1 (N–H bending), and 1443 cm−1 (–C–N stretching), which can be observed as the characteristic peaks of the grafted glycine (Fig. 1(c)). The grafting of glycine can also be evidenced by observing the ring opening reaction at the epoxide ring where the C–O–C stretching disappeared at 1045 cm−1 and the C–OH formed at 1100 cm−1. In addition, amide bond formation can be evidenced from the shift of –CO stretching from 1732 cm−1 to 1652 cm−1 for the carboxylic acid of GO and the amide of GMGO, respectively, and the presence of 3150 cm−1 (–NH stretching of amide), 1503 cm−1 (N–H bending), 1443 cm−1 (–C–N stretching). All these findings indicated the successful preparation of GMGO.31 After the reaction between GMGO and HAuCl4, the intensity of the characteristic N–H stretching (3150 cm−1) and N–H bending (1503 cm−1) of grafted glycine were decreased (Fig. 1(d)), indicating that the Au(III) was reduced to Au(0) by the grafted glycine, and the nano-Au(0) particles were deposited on the surface of GMGO.
 |
| | Fig. 1 FTIR spectra of (a) GO, (b) GMGO, (c) glycine, and (d) AuGO. | |
3.2 X-ray photoelectron spectroscopy analysis
Table 1, Fig. 2 and 3 illustrate the deconvoluted XPS spectra of the C1s, O1s, N1s, and Au4f orbitals; the binding energies of the grafted functional groups; and the binding energies of the nanogold, respectively. The binding energies of the organic functional groups were reasonable for GO, GMGO, and AuGO. The XPS results for GO exhibited the characteristic binding energy of O1s orbitals at 531.94 and 532.93 eV for C–O and CO, respectively (Fig. 2(a)); and that of C1s orbitals at 284.51, 286.62, and 288.23 eV for C–C/CC, C–O, and OC–O, respectively (Fig. 2(b)). The XPS results for GMGO exhibited the characteristic binding energy of O1s at 531.69 and 532.65 eV for C–O and CO, respectively (Fig. 2(c)); and that of C1s orbitals at 284.42, 285.77, 286.58, 288.06, 288.66, and 290.01 eV for C–C/CC, C–N, C–O, OC–N, OC–O, and π–π* transitions, respectively (Fig. 2(d)). The XPS spectra of the N1s orbitals were also measured as 399.36 (C–N) and 401.08 eV (N–H), proving that glycine was successfully grafted on GO (Fig. 2(e)).31 Consequently, graphite oxidised into GO and oxygen composition was increased to 37.12% (Table 1). After being grafted with glycine, the GMGO had a relatively diminished oxygen ratio and oxygen composition decreased to 29.47%, whereas nitrogen composition increased to 7.65% (Table 1). The increased ratio of N1s in the GMGO revealed by conducting XPS analysis confirmed that glycine groups were grafted onto the GO. The highly grafted functional glycine can be used to increase the opportunities for reducing the Au(III) precursor for preparing nanogold-deposited GO. Based on the results shown in Fig. 3 and Table 1, the appearance of Au4f orbitals and low ratios of N1s (e.g., 2.66%) in the AuGO compound revealed from the XPS analysis indicated that the nanogold was deposited onto the surface of the graphene and that some of the grafted glycine groups were degrafted, which supported the reduced reactions on the surface of the GMGO.
Table 1 Atom ratios of GO, GMGO, and AuGO, derived from XPS analysis
| |
C1s (%) |
O1s (%) |
N1s (%) |
Au4f (%) |
C/O |
| GO |
62.88 |
37.12 |
— |
— |
1.69 |
| GMGO |
62.88 |
29.47 |
7.65 |
— |
2.13 |
| AuGO |
67.20 |
29.99 |
2.66 |
0.14 |
2.24 |
 |
| | Fig. 2 XPS spectra of (a) O1s orbitals of GO, (b) C1s orbitals of GO, (c) O1s orbitals of GMGO, (d) C1s orbitals of GMGO, and (e) N1s orbitals of GMGO. | |
 |
| | Fig. 3 XPS spectra of (a) O1s orbitals, (b) C1s orbitals, (c) N1s orbitals, and (d) Au4f orbitals of AuGO. | |
3.3 Analysis of thermal properties
The TGA thermograms of GO, GMGO, AuGO, and glycine were measured (Fig. 4). The as-prepared GO showed an approximate weight loss of 97 wt% at 180 °C, which might be the weight loss of the grafted functional groups, such as epoxide, carboxylic acid, and alcohol on GO; the second stage thermal decomposition approximately from 180 °C to 600 °C with a weight loss of 3 wt% was caused by the degradation of the GO frameworks. The high weight loss of the grafted functional groups in the as-prepared GO indicated high oxidation of sp2 graphite to sp3-grafted GO. The TGA curve of the GMGO (Fig. 4(c)) showed relative thermal stability compared with that of GO; the weight loss of the first-stage decomposition of the grafting groups was only 22 wt% at 180 °C, whereas a second-stage decomposition from approximately 180 °C to 680 °C was the major weight loss for the GO framework structure; the results indicated that the GO might have been partially reduced, in which the sp3 carbon transformed into an sp2 hybrid structure after being grafted with glycine. The thermal stability of AuGO was superior to that of GMGO, notably the secondary decomposition temperature from approximately 180 °C to 600 °C, which indicated a minor weight loss and great increase in char yield (i.e., 11.5%), which can be attributed to the relatively perfect sp2 framework obtained by implanting nanogold on the surface of graphene. The increase in char yield for AuGO can be attributed to the increased sp2 character of graphene and nanogold; char yield increased by approximately 11.5 wt% compared with GMGO. In addition, the weight loss of glycine (i.e., Fig. 4(b), Td = 255 °C) in the TGA curves of GMGO and AuGO could not be observed, indicating that the unreacted glycine was removed during purification. Therefore, the TGA analysis verified the grafting of glycine and nanogold onto the surface of graphene.
 |
| | Fig. 4 TGA analysis of (a) GO, (b) glycine, (c) GMGO, and (d) AuGO. | |
3.4 Transmission electron microscopy analysis of GO, GMGO, and AuGO
According to the TEM images, the GO (Fig. 5(a)) and GMGO (Fig. 5(b)) sheets seemed to have small number of layers with several folds. In addition, the layers of graphene sheets might have been fewer than those of GO; the TEM images of GMGO were similar to the background in grey level of image and the images show a folded surface, indicating that further exfoliation might be caused by grafting with glycine functional groups. The gold nanoparticles grafted on the graphene surface of AuGO were observable on the TEM images (Fig. 5(c)). The diameter of the nanogold was approximately 15–135 nm. The average diameter of the nanogold grafted on the graphene surface was approximately 56 nm. Wrinkles appeared around the gold nanoparticles, indicating that interactions between graphene sheets and gold particles might have occurred (Fig. 5(d)). The formation of nanogold proved that grafting glycine on the surface of graphene successfully reduced HAuCl4. The gold nanoparticles were well-distributed on the measured graphene surface, indicating that the grafted sites of glycine were uniform on the graphene surface.
 |
| | Fig. 5 TEM images of (a) GO (×50 k), (b) GMGO (×50 k), (c) GMGO–Au (×25 k), (d) GMGO–Au (×100 k), and (e) frequency distribution of nano-Au grafted on GMGO. | |
3.5 X-ray diffraction analysis of GO, GMGO, and AuGO
To understand how the entry of the functional groups affected graphene interlayer spacing, XRD spectroscopy was employed. Fig. 6 shows the XRD spectra of graphite, GO, GMGO, and AuGO. The XRD pattern of the original unmodified graphite appeared at 2θ = 26.42°, indicating a layer spacing of 0.336 nm. The XRD pattern of the as-prepared GO shows that a new peak appeared at 2θ = 9.36°, indicating that the interlayer spacing increased to 0.94 nm because of grafting the GO with epoxide, carboxylic acid, and alcohol groups; the GO diffraction peak shifted to a lower diffraction angle than that observed for graphite, confirming that GO was successfully prepared using the modified Hummers method. Furthermore, XRD patterns were not observed in the glycine-grafted GMGO compound, indicating that GMGO layers were exfoliated more than GO layers. To further support that crystalline nanogold was successfully prepared on the AuGO surface (as indicated by the TEM analysis), clear diffraction peaks were observed at 38.16°, 44.40°, 64.60°, and 77.64°, which were specified using the Miller index as (111), (200), (220), and (311), respectively, for the characteristic diffraction peaks of crystalline nanogold. In addition, a weak diffraction peak was observed at 10.27°, indicating that grafting glycine on GMGO to reduce HAuCl4 also degrafted the functional groups to form a more regular conformation of GO.
 |
| | Fig. 6 X-ray diffraction spectra analysis of (a) graphite, (b) GO, (c) GMGO, and (d) AuGO. | |
3.6 Studying the morphology of electrospun nanofibres by using scanning electron microscopy
The SEM images of electrospun pure PVA fibres prepared with various concentrations of the PVA solution were measured and compared (Fig. 7). It was discovered that when the polymer concentration was low, it was unable to form fibrous structures. Nanofibres were generated when the concentration reached a certain value in which the viscosity of the PVA solution was sufficiently high (e.g., 16.67 wt% viscosity was 274 cp in this study), however, it still contained both beads and fibres in the electrospun mat. To prepare a superior fibrous structure, the process parameters of electrospinning must be controlled; for example, the appropriate values of these factors must be used: applied voltage, syringe pump flow rate, the distance of the needle to the collection plate, and polymer concentration.34 The SEM images for comparison of fibrous structures for PVA and GMGO/PVA composites were illustrated in ESI.†
 |
| | Fig. 7 SEM micrographs of electrospun fibres from PVA water solutions with different concentrations: (a) 7 wt%, (b) 10 wt%, (c) 13 wt%, and (d) 16.67 wt%. | |
Because the grafted glycine groups on the surface of the GMGO were designed to have hydrogen bonds with the PVA, we expected that the driving force caused by hydrogen bonding could enhance the compatibility between the GMGO and polymer matrix and assist in the dispersion of the GMGO. The influence of functional graphene on the morphology of electrospun nanofibres was studied by incorporating various ratios of GMGO in the as-prepared GMGO/PVA composites. For example, all of the samples were prepared at the same concentration (16.67 wt%) of polymer composites in a water phase under electrospinning at an applied voltage of 15 kV, feeding rate of 0.1 mL h−1, and syringe–needle-to-collected-target distance of 12 cm, as shown in Scheme 2. The SEM analysis revealed that the 0.1 wt% and 0.5 wt% GMGO-incorporated GMGO/PVA nanofibres had completely fibrous morphologies (Fig. 8(b) and (c)), and none exhibited any bead structures compared with the pure PVA electrospun fibres (Fig. 8(a)). However, the morphology became irregular when 1 wt% of GMGO was incorporated in polymer composites (Fig. 8(d)) and both polymer fibres and beads were mixed in the electrospun mat. The results indicated that a low content loading of GMGO is suitable for electrospinning. Wide dispersion of GMGO in the PVA matrix might be essential for enhancing the morphology of electrospun nanofibres. The improvement in fibre morphology can be attributed to the regular arrangement of the modified graphene layers in the fibre orientation, as seen in the TEM observation (Fig. 10). We propose the thorough dispersion of GMGO in polymer matrixes and forming a regular structure rolled in the nanofibres during electrospinning to improve the morphology of electrospun fibres. In addition, the hydrogen bonding between the GMGO and PVA might also enhance the viscosity along with the loading of GMGO contents. The viscosity of the samples used for electrospinning was measured using a viscometer, yielding values of 274, 288, 294, 308, and 310 cp for the PVA, 0.1% GMGO/PVA, 0.3% GMGO/PVA, 0.5% GMGO/PVA, and 1% GMGO/PVA composite solutions, respectively. When the viscosity was increased, the morphology of nanofibres could be obtained. However, in a high loading of 1 wt% GMGO, the addition content might be excessive for wide dispersion in the PVA matrix; the aggregation of GMGO caused by the π–π interaction might cause bead formation during electrospinning.
 |
| | Fig. 8 SEM micrographs of electrospun fibres from PVA solutions with different proportions of GMG: (a) pure PVA, (b) 0.1% GMGO/PVA, (c) 0.5% GMGO/PVA, and (d) 1.0% GMGO/PVA. Polymer concentration of 16.67 wt%; feeding flow rateof 0.1 mL h−1; applied voltage of 15 kV; needle tip to target distance of 12 cm. | |
Furthermore, the diameter of nanofibres prepared using the 0.5% GMGO/PVA composite solution was also evaluated at different electrospinning voltages at a fixed feeding rate of 0.1 mL h−1 and a syringe–needle-to-target distance of 12 cm. Consequently, the average diameter of nanofibres increased as the applied voltages increased; for example, at applied voltages of 10 kV, 15 kV, and 20 kV, the diameters were 121 nm, 135 nm, and 150 nm, respectively (Fig. 9). The diameter increase of nanofibres might be attributed to the fast vaporisation of solvent at a high voltage during electrospinning.34
 |
| | Fig. 9 Effects of voltage on morphology and fibre diameter distribution from a 16.67% PVA/0.5% GMGO water solution (needle tip to target distance 12 cm, feeding flow rate 0.1 mL h−1). Voltage: (a) (d) 10 kV, (b) (e) 15 kV, and (c) (f) 20 kV. Original magnification: ×15 k. | |
3.7 Studying the morphology of electrospun nanofibres by using transmission electron microscopy
The internal structures of electrospun GMGO/PVA and AuGO/PVA nanofibres were studied using TEM, as shown in Fig. 10. The TEM images of the as-prepared 0.5% GMGO/PVA nanofibre illustrated that GMGO was evenly distributed in the PVA fibre, which proved the thorough dispersion of GMGO in a PVA matrix, as shown in Fig. 10(a). However, when 1% of GMGO was loaded in PVA composites, the nanofibres were unevenly distributed and had different transparencies in the TEM images (Fig. 10(b)), which indicated that some phase separation might have occurred at a high GMGO loading content. Furthermore, we were interested in whether the fine structure of the GMGO layers could be formed in the nanofibres because the area of the GMGO layers was nearly 1.8 μm2; however, the diameter of fibres was only at a scale of 120–150 nm. Some fine structures of the GMGO layer in nanofibres can be observed in high-resolution TEM images, such as the twisted structure (Fig. 10(c)) and the layered structure (Fig. 10(d)). The results indicated that the GMGO layers were thoroughly incorporated in the interior of the fibres during electrospinning. The instant formation of twisted or layered GMGO structures in the fibre matrix is astounding. In addition, the TEM images of AuGO/PVA nanofibres were also evaluated, as shown in Fig. 10(e) and (f). To distinguish if the dark area in Fig. 10(e) was caused by the graphene or nanogold, TEM focusing on the particles was used for observation. As a result, the distinguishable nanogold particles could be observed in the TEM images of nanofibre as shown with the yellow arrows in Fig. 10(e) and (f). The particles were thoroughly enclosed in the fibre with a diameter of approximately 50 nm, indicating that the AuGO sheets were introduced into the fibre morphology during electrospinning.
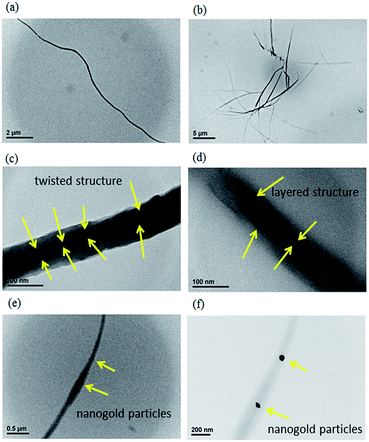 |
| | Fig. 10 TEM images of (a) 0.5% GMGO/PVA nanofibre (×15 k), (b) 1% GMGO/PVA nanofibre (×5 k), (c) 0.5% GMGO/PVA fibre (×400 k) shown with twisted graphene layers, (d) 0.5% GMGO/PVA fibre (×400 k) shown with layered graphene, (e) 0.5% AuGO/PVA fibre (×50 k, focus on the fibre), and (f) 0.5% AuGO/PVA fibre (×100 k, focus on the nano-Au). | |
3.8 Studying electrospun nanofibres using X-ray diffraction
The electrospun nanofibres were also studied using XRD as shown in Fig. 11. The characteristic diffraction of the PVA powder exhibited a diffracted peak at 19.79° (Fig. 11(f)). However, the diffraction of PVA was not observed for the as-prepared nanofibres, which indicated that the polymer matrix was amorphous because of the rapid electrospinning process. It was unexpected that a diffraction peak at 8.15° appeared when a high loading of GMGO was incorporated. The greatly enhanced intensity indicated that regular layer spacing might be formed because of GMGO incorporation. The results were consistent with the TEM analysis observations (Fig. 10(c) and 9(d)), in which the twisted and layered GMGO structures were observed at a magnification of 400000. Regarding the flexibility of GMGO, the GMGO structure in the PVA composite fibres might be folded as a layered structure, which caused the diffraction intensity to peak at 8.15°; it increased as the GMGO loading content used increased.
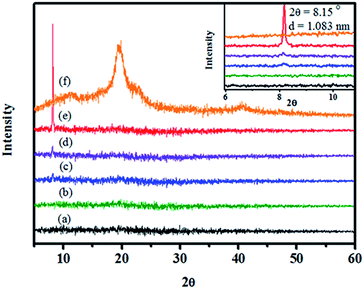 |
| | Fig. 11 XRD of GMGO/PVA electrospun fibres with different ratios of GMGO: (a) pure PVA fibre, (b) 0.1% GMGO/PVA, (c) 0.3% GMGO/PVA, (d) 0.5% GMGO/PVA, (e) 1.0% GMGO/PVA, and (f) pure PVA powder. | |
3.9 Studying the electrochemical AC impedance of nanofibres
The electrical properties of the as-prepared electrospun nanofibres were investigated by measuring AC impedance. A nanofibre mat was electrospun on an IDA electrode at an applied voltage of 15 kV, feeding rate of 0.1 mL h−1, and a syringe–needle-to-target distance of 12 cm. Each sample for AC impedance measurement was electrospun on an IDA electrode for 1 h to equalise the quantity of fabricated nanofibres. Fig. 12 shows the Nyquist plot of the as-prepared GMGO/PVA, AuGO/PVA, and PVA nanofibre mats. Consequently, the diameters of the semicircles in the Nyquist plot decreased following the sequence of PVA, GMGO/PVA, and then AuGO/PVA nanofibre mats (Fig. 11(A)). The results are attributed to the conductive graphene derivatives were embedded; moreover, the nanogold deposited on the grapheme surface could also contribute to the reduction of impedance. Furthermore, series of AuGO/PVA composite fibres with different AuGO ratios were compared using EIS measurement (Fig. 12(B)). The diameters of the semicircles in the Nyquist plot decreased in the pure PVA fibre sequence > 0.1% AuGO/PVA, >0.3% AuGO/PVA, >0.5% AuGO/PVA, and >1.0% AuGO/PVA because of the substantial decrease in impedance that occurred as the AuGO content was increased in the composite nanofibres, and this trend was mirrored in the consequent improvement in conductivity. For example, the PVA-, 0.1% AuGO/PVA-, 0.3% AuGO/PVA-, 0.5% AuGO/PVA-, and 1.0% AuGO/PVA-coated samples produced Zreal values of 1.8 GΩ, 1.35 GΩ, 0.85 GΩ, 0.75 GΩ, and 0.58 GΩ, respectively, at low frequencies (ω = approximately 0). The semicircle diameter of the Nyquist plot decreased with the incorporation of AuGO content in the composite nanofibres, indicating that AuGO is a conductive nanomaterial and can potentially be applied in sensing applications.
 |
| | Fig. 12 AC impedance measurement of electrospun mat on the IDA electrode (inset figure): (A) Nyquist plots of (a) PVA, (b) GMGO/PVA, and (c) AuGO/PVA nanofibre mats; (B) Nyquist plots of (a) pure PVA fibre, (b) 0.1% AuGO/PVA, (c) 0.3% AuGO/PVA, (d) 0.5% AuGO/PVA, and (e) 1.0% AuGO/PVA. | |
3.10 Storage modulus of the GMGO/PVA nanofibre mat
To realise the improved mechanical properties of the GMGO-embedded PVA nanofibres, electrospun fibre mat samples with different GMGO feeding ratios were prepared using a constant electrospinning period of 10 h at an applied voltage of 15 kV, feeding rate of 0.1 mL h−1, and syringe–needle-to-target distance of 12 cm. The film thickness of each electrospun fibre mat was approximately 70 μm by measuring with a digimatic micrometer. The storage modulus increased with the incorporation of GMGO content at a low loading (Fig. 13). For example, for the 0.5 wt% GMGO-loaded PVA composite fibre mat, the study modulus increased to approximately 50.5% at 40 °C compared with a pure PVA electrospun mat. Because of the high mechanical property of graphene, the improvement in storage modulus indicated that the embedded GMGO layers can assist in improving interfacial strength with the PVA matrix. The hydrogen bonding between the functional groups on the GMGO surface and the alcohol groups of the PVA polymer might also contribute to the enhancement of storage moduli and their compatibility for wide dispersion.
 |
| | Fig. 13 Storage modulus of GMGO/PVA nanocomposites: (a) pure PVA fibre, (b) 0.1% GMGO/PVA, (c) 0.3% GMGO/PVA, and (d) 0.5% GMGO/PVA. | |
3.11 Analysis of thermal properties
The thermal decomposition temperature (Td) of the as-prepared GMGO/PVA nanofibres was measured using a TGA, as shown in Fig. 14. The results revealed that the Td increased as the amount of GMGO increased at low loadings. For example, the 0.5% GMGO/PVA nanofibre exhibited a Td increase of approximately 20 °C more than that of the pure PVA nanofibre (i.e., 0.5 wt% GMGO/PVA composite fibre, Td = 288.0 °C; PVA nanofibre, Td = 268.5 °C). However, high loadings of GMGO (i.e., 1 wt%, Td = 284.9 °C) could not improve Td, which can be attributed to the mixture of spheres in the fibre matrix because poor dispersion or phase separation can occur when GMGO is overloaded in a PVA matrix (as indicated by the SEM analysis). The DSC curves of the GMGO/PVA electrospun fibre are shown in Fig. 15. However, the improved Tg was not clear; for example, adding 0.5% GMGO to the polymer matrix increased the Tg by only approximately 3 °C. The reinforcing interaction of GMGO might restrict the movement of polymer chains and increase the Tg of GMGO/PVA composite nanofibres.
 |
| | Fig. 14 TGA curves with different ratios of GMGO/PVA and AuGO/PVA nanofibres. | |
 |
| | Fig. 15 DSC curves with different ratios of GMGO in the GMGO/PVA nanofibres: (a) pure PVA fibre, (b) 0.1% GMGO/PVA, (c) 0.3% GMGO/PVA, (d) 0.5% GMGO/PVA, and (e) 1.0% GMGO/PVA. | |
3.12 In vitro cytotoxicity and cell uptake of the electrospun mats
To evaluate the biocompatibility for PVA electrospun mats by incorporation of GMGO and AuGO, we tested the cellular toxicity of PVA, 0.1%-, 0.3%-, 0.5%-, 1%-GMGO/PVA and 1% AuGO/PVA electrospun nanofibre mats of 200 μg mL−1 on normal fibroblasts L929. These tests were analyzed by MTT assay and are shown in Fig. 16. The results represented that PVA, 0.1%-, 0.3%-, 0.5%-, 1%-GMGO/PVA and 1% AuGO/PVA electrospun nanofibre mats own a negligible cellular toxicity and hence a promising biocompatibility. As shown in figure, our corresponding materials showed almost no cytotoxicity to L929 cells even up to a high concentration of 200 μg mL−1. The photo images obtained by using 200 μg mL−1 on normal fibroblasts L929 are shown in the supporting materials.
 |
| | Fig. 16 Cytotoxicity tests of PVA, GMGO/PVA (0.1%, 0.3%, 0.5% and 1%) and 1% AuGO/PVA electrospinning nanofibres to L929 cell line after 24 h of incubation. | |
4. Conclusion
GMGO and its derivative AuGO were prepared by reducing grafted glycine groups on GO surfaces. The high-aspect ratio pellets of those graphene derivatives were embedded in the electrospun nanofibres. The FTIR, XPS, TGA, TEM, and XRD analyses results supported the successful preparation of GO, GMGO, and AuGO. The XPS results showed highly grafted glycine groups on GMGO, which were reduced to form AuGO, as verified by the reduced ratio of N1s orbitals, indicating the SP2-like characteristic of graphene. The AuGO and GMGO exhibited the enhanced thermal stability frameworks of GO based on the TGA results. The TEM and XRD results revealed that GMGO has well-exfoliated graphene layers because of the incorporation of functional groups. As shown in the TEM images, functional glycine can be used to reduce HAuCl4 for forming AuGO with average diameters of approximately 56 nm. The characteristic diffraction peaks of AuGO observed using XRD indicated that nanogold has a highly crystalline structure on the GO surface. The optimised conditions for preparing GMGO- and AuGO-embedded nanofibres were studied using electrospinning. The fibre morphology of PVA was improved when GMGO was incorporated in its polymer matrix. The embedded layer structures of GMGO and AuGO were observed using HRTEM analysis. The high-aspect ratio with a two-dimensional GO layer of 1.8 μm2 was folded in the nanofibres with a diameter smaller than 150 nm in an extremely rapid electrospinning process. Nanogold grafted on the GO surface can also be embedded in nanofibres. A diffraction peak at 8.15° appeared in the XRD when the nanofibres were incorporated with a high loading of GMGO, indicating that regular layer spacing might be formed by folded GMGO, which is consistent with the TEM results. The EIS measurement of electrospun nanofibre showed that the decreasing impedance depended on the ratio of AuGO introduced because the conductivity of nanofibre increased. The impedance of PVA fibre can be reduced by incorporating GMGO, and further reduced by incorporating nanogold in the fibre matrix. The storage modulus and thermal decomposition temperature were increased with low GMGO loading content. The storage modulus of 0.5 wt% GMGO-embedded nanofibre mat was increased by approximately 50.5% and the Td increased by approximately 20 °C compared with pure PVA nanofibre. The improved morphology of nanofibre mats and the enhanced conductivity, mechanical strength, and thermal stability achieved by embedding the graphene-based derivatives, GMGO and AuGO, were demonstrated using SEM, EIS, DMA, and TGA. Evaluation for in vitro cytotoxicity and cell uptake of the electrospun mats showed a negligible cellular toxicity to L929 cells even up to a high concentration of 200 μg mL−1.
Acknowledgements
The authors are grateful for the financial support of this work provided by the Ministry of Science and Technology of Taiwan, Republic of China, under grant NSC 101-2113-M-030-006-MY2.
References
- Z. M. Huang, Y. Z. Zhang, M. Kotaki and S. Ramakrishna, Compos. Sci. Technol., 2003, 63, 2223–2253 CrossRef CAS.
- Z. W. Ma, M. Kotaki, R. Inai and S. Ramakrishna, Tissue Eng., 2005, 11, 101–109 CrossRef CAS PubMed.
- B. C. Wang, Y. Z. Wang, T. Y. Yin and Q. S. Yu, Chem. Eng. Commun., 2010, 197, 1315–1338 CrossRef CAS.
- B. S. Kim and I. S. Kim, Polym. Rev., 2011, 51, 235–238 CrossRef CAS.
- P. Supaphol, O. Suwantong, P. Sangsanoh, S. Srinivasan, R. Jayakumar and S. V. Nair, Adv. Polym. Sci., 2012, 246, 213–239 CrossRef CAS.
- M. Scampicchio, A. Bulbarello, A. Arecchi, M. S. Cosio, S. Benedetti and S. Mannino, Electroanalysis, 2012, 24, 719–725 CrossRef CAS.
- S. Agarwal, J. H. Wendorff and A. Greiner, Macromol. Rapid Commun., 2010, 31, 1317–1331 CrossRef CAS PubMed.
- R. Sahay, P. S. Kumar, R. Sridhar, J. Sundaramurthy, J. Venugopal, S. G. Mhaisalkar and S. Ramakrishna, J. Mater. Chem., 2012, 22, 12953–12971 RSC.
- L. C. Yeh, C. F. Dai, J. M. Yeh, P. Y. Hsieh, Y. Wei, T. Y. Chin, M. Y. Hsu and Y. W. Chen-Yang, J. Mater. Chem. B, 2013, 1, 5469–5477 RSC.
- C. Yang, X. M. Wu, Y. H. Zhao, L. Xu and S. C. Wei, J. Appl. Polym. Sci., 2011, 121, 3047–3055 CrossRef CAS.
- X. J. Huang, D. Ge and Z. K. Xu, Eur. Polym. J., 2007, 43, 3710–3718 CrossRef CAS PubMed.
- E. L. Yang, X. H. Qin and S. Y. Wang, Mater. Lett., 2008, 62, 3555–3557 CrossRef CAS PubMed.
- T. Pirzada, S. A. Arvidson, C. D. Saquing, S. S. Shah and S. A. Khan, Langmuir, 2012, 28, 5834–5844 CrossRef CAS PubMed.
- S. L. Xiao, W. L. Xu, H. Ma and X. Fang, RSC Adv., 2012, 2, 319–327 RSC.
- G. P. Dong, X. D. Xiao, X. F. Liu, B. Qian, Z. J. Ma, S. Ye, D. P. Chen and J. R. Qiu, J. Nanopart. Res., 2010, 12, 1319–1329 CrossRef CAS.
- D. He, B. Hu, Q. F. Yao, K. Wang and S. H. Yu, ACS Nano, 2009, 3, 3993–4002 CrossRef CAS PubMed.
- C. L. Zhang, K. P. Lv, H. T. Huang, H. P. Cong and S. H. Yu, Nanoscale, 2012, 4, 5348–5355 RSC.
- K. H. Hong, Polym. Eng. Sci., 2007, 47, 43–49 CAS.
- R. Jayakumar, M. Prabaharan, K. T. Shalumon, K. P. Chennazhi and S. V. Nair, Adv. Polym. Sci., 2012, 246, 263–282 CrossRef CAS.
- X. F. Su, J. Ren, X. W. Meng, X. L. Ren and F. Q. Tang, Analyst, 2013, 138, 1459–1466 RSC.
- J. Wang, H. B. Yao, D. A. He, C. L. Zhang and S. H. Yu, ACS Appl. Mater. Interfaces, 2012, 4, 1963–1971 CAS.
- L. Ghasemi-Mobarakeh, M. P. Prabhakaran, M. Morshed, M. H. Nasr-Esfahani and S. Ramakrishna, Tissue Eng., Part A, 2009, 15, 3605–3619 CrossRef CAS PubMed.
- V. Singh, D. Joung, L. Zhai, S. Das, S. I. Khondaker and S. Seal, Prog. Mater. Sci., 2011, 56, 1178–1271 CrossRef CAS PubMed.
- R. Y. Suckeveriene, E. Zelikman, G. Mechrez and M. Narkis, Rev. Chem. Eng., 2011, 27, 15–21 CAS.
- R. Sengupta, M. Bhattacharya, S. Bandyopadhyay and A. K. Bhowmick, Prog. Polym. Sci., 2011, 36, 638–670 CrossRef CAS PubMed.
- X. M. Chen, G. H. Wu, Y. Q. Jiang, Y. R. Wang and X. Chen, Analyst, 2011, 136, 4631–4640 RSC.
- Y. Q. Tan, Y. H. Song and Q. Zheng, Nanoscale, 2012, 4, 6997–7005 RSC.
- C. M. Wu, S. A. Yu and S. L. Lin, eXPRESS Polym. Lett., 2014, 8, 565–573 CrossRef.
- B. G. Lu, T. Li, H. T. Zhao, X. D. Li, C. T. Gao, S. X. Zhang and E. Q. Xie, Nanoscale, 2012, 4, 2978–2982 RSC.
- Y. Y. Qi, Z. X. Tai, D. F. Sun, J. T. Chen, H. B. Ma, X. B. Yan, B. Liu and Q. J. Xue, J. Appl. Polym. Sci., 2013, 127, 1885–1894 CrossRef CAS.
- S. Bose, T. Kuila, A. K. Mishra, N. H. Kim and J. H. Lee, J. Mater. Chem., 2012, 22, 9696–9703 RSC.
- D. C. Marcano, D. V. Kosynkin, J. M. Berlin, A. Sinitskii, Z. Z. Sun, A. Slesarev, L. B. Alemany, W. Lu and J. M. Tour, ACS Nano, 2010, 4, 4806–4814 CrossRef CAS PubMed.
- H. B. Zhao, Z. H. Peng, W. J. Wang, X. K. Chen, J. H. Fang and J. Q. Xu, J. Power Sources, 2014, 245, 529–536 CrossRef CAS PubMed.
- C. X. Zhang, X. Y. Yuan, L. L. Wu, Y. Han and J. Sheng, Eur. Polym. J., 2005, 41, 423–432 CrossRef CAS PubMed.
Footnote |
| † Electronic supplementary information (ESI) available: The SEM studies for comparison of fibrous structures for PVA and GMGO/PVA composites were illustrated. Samples were prepared by the optimized process parameters of applied voltage (10 kV, 15 kV, and 20 kV), syringe pump flow rate (0.1 mL h−1, 0.2 mL h−1 and 0.3 mL h−1) at a concentration of 16.67 wt% for PVA composite solutions with syringe–needle-to-collected-target distance of 12 cm. The photo images of PVA, GMGO/PVA, and AuGO/PVA were compared for the cytotoxicity test on fibroblasts L929. See DOI: 10.1039/c4ra10620b |
|
| This journal is © The Royal Society of Chemistry 2014 |
Click here to see how this site uses Cookies. View our privacy policy here. 


