C. G. Liu*a,
X. T. Wua,
X. F. Lib and
X. G. Zhanga
aRoll Forging Research Institute of Jilin University, Jilin University, Changchun, 130022, China. E-mail: wuxt12@mails.jlu.edu.cn; Tel: +86043185094340
bKey Laboratory of Functional Materials Physics and Chemistry of the Ministry of Education, Jilin Normal University, Siping 136000, Jilin, China
First published on 7th November 2014
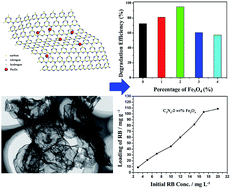
Graphene-like g-C3N4 nanosheet (GCN)/Fe3O4 quantum dot (QD) nanocomposites were successfully synthesized by a facile electrostatic self-assembly method. Characterization shows that the GCN is at least several micrometers in size. The GCN/Fe3O4 nanocomposites were used as photocatalysts for degradation of Rhodamine B (RhB) under visible light irradiation. After irradiation for 1.5 h, the degradation efficiency was 72.5% for pure g-C3N4, 81% for GCN-1 wt% Fe3O4, 95% for GCN-2 wt% Fe3O4, 60.46% for GCN-3 wt% Fe3O4 and 57.2% for GCN-4 wt% Fe3O4, indicating that GCN-2 wt% Fe3O4 nanocomposites had the highest photocatalytic activity. We deduce that the efficient separation of the photogenerated electron–hole pairs and the high specific surface area of GCN play important roles in the photocatalytic activity of the nanocomposites. In addition, the nanocomposites can be loaded with a model drug (Rhodamine B) and the loading capacity was as high as 108.6 mg g−1, making it a potential candidate for photocatalysis and controlled magnetically targeted drug delivery.
Recently, many researches on ultrathin sheet-like nanostructures11–14 have been conducted since the discovery of graphene (GR) which possesses many unique and inspiring properties different from bulk graphite. In particular, GR–semiconductor nanocomposites show excellent performance in photocatalysis, and GR–magnetic nanoparticle (NP) composite materials show outstanding properties in drug delivery and biosensing.15,16 So, motivated by the unique nature of graphene in its ultrathin sheet-like nanostructure, researchers have tried to synthesise the graphene-like g-C3N4 to obtain similar properties and applications to graphene.17,18
Different from graphite, the g-C3N4 layer is composed of C–N bonds instead of C–C bonds, and there are weak van der Waal’s forces between the layers. Many groups have tried to synthesise graphene-like ultrathin g-C3N4 nanosheets. Based on the experience of graphene, Liu et al. tried to exfoliate bulk g-C3N4 by the Hummers method, which is widely used in graphene, but failed.17 This was attributed to the weaker hydrogen bonding between the layers of strands of polymeric melon units in g-C3N4, which is different from the planar pure covalent bonding cohesion within graphite.19 On this basis, researchers have successfully synthesized GCN via many other methods. Liu et al. developed a direct thermal oxidation “etching” process of bulk g-C3N4 to get ultrathin g-C3N4 nanosheets,17 Zhu et al. prepared g-C3N4 nanosheets with a single atomic layer structure by a simple chemical exfoliation method,20 and Wang et al. obtained ultrathin C3N4 nanosheets using a “bottom-up” method.21 Ultrathin g-C3N4 nanosheets were also successfully prepared by ultrasound exfoliation or liquid exfoliation methods from bulk g-C3N4.18,22 Furthermore, the more synthetic techniques for GCN vis-à-vis graphene including recently developed laser exfoliation23 and laser reduction techniques24–26 should be developed and explored in future work.
Although graphene-like g-C3N4 nanostructures have already been obtained, few studies have focused on composite materials which are composed of graphene-like g-C3N4 nanosheets and magnetic nanoparticles, and the excellent properties of the graphene series composites in drug delivery and photocatalysis.
In the present work, we synthesized graphene-like ultrathin g-C3N4 nanosheets by an ultrasound exfoliation method from bulk g-C3N4, and then prepared graphene-like g-C3N4 nanosheet/Fe3O4 quantum dot nanocomposites for the first time via an easy electrostatic self-assembly method, and their structural properties were systematically characterized. The effect of the Fe3O4 content in the g-C3N4 nanosheet/Fe3O4 nanocomposites on the photocatalytic activity under visible light irradiation was investigated. Moreover, we also conducted a pilot study on the drug loading capacity of the material.
Typical TEM and HRTEM images of the GCN/Fe3O4 nanocomposites are shown in Fig. 2. The thin silk-like structure of the graphene-like g-C3N4 nanosheets can be clearly observed in Fig. 2a, the lateral size of the transparent sheets is as large as several micrometers, the darker part in the image is the wrinkle or overlap of GCNs. Fig. 2b shows an enlarged image of the nanocomposite. From Fig. 2b, the Fe3O4 QDs were found to be dispersed on the surface of the GCN, which had agglomerated to some extent. The HRTEM image of the composite is shown in Fig. 2c, the diameter of Fe3O4 QDs is about 10 nm, and we can observe a lattice of Fe3O4 with d-spacing of about 0.297 nm and 0.258 nm, which conforms to the (220) and (311) planes, respectively, of face centered cubic Fe3O4.28 The image also shows the intimate interfacial contact between the GCN and Fe3O4 QDs. As the interfacial interaction has a great impact on the transfer process of charge carriers in the nanocomposites, it could be expected that there would be a good charge transfer during the photocatalysis process. All of the above results show that the as-prepared sample is composed of two separate phases of Fe3O4 QDs and GCN.
![]() | ||
Fig. 2 (a and b) TEM images of GCN/Fe3O4 nanocomposites; (c) HRTEM image of Fe3O4 QDs; (d) a model of the GCN/Fe3O4 nanocomposite. |
The absorption range of light is very important in the visible light photodegradation of contaminants, therefore, the UV-Vis diffuse reflectance spectrum was measured and shown in Fig. 3a. As a comparison, the spectrum of pure g-C3N4 was also measured. As Fig. 5a indicates, both spectra have broad absorption in the UV-visible region, which demonstrate that g-C3N4 and the nanocomposites possess visible-light absorption ability. An obvious red shift in the absorption edge and enhanced absorption intensity of GCN/Fe3O4 was also observed. This phenomenon may be attributed to a charge-transfer transition between the Fe3O4 species and the g-C3N4 conduction or valence band, which can lead to a stronger redox ability and higher photocatalytic activity.29
![]() | ||
Fig. 3 Optical measurement of pure g-C3N4 and the GCN/Fe3O4 nanocomposite, (a) UV-Vis diffuse reflectance spectra; (b) FTIR spectra. |
The bond structure of the GCN/Fe3O4 nanocomposites was studied by FTIR spectroscopy, and as a comparison, the spectrum of pure g-C3N4 was also measured. The results is shown in Fig. 3b. Several main characteristic peaks are visible in both spectra, the peak at 809 cm−1 is related to the tri-s-triazine ring modes, several strong bands in the 1200–1650 cm−1 region correspond to the typical stretching modes of CN heterocycles, and the peaks at 1635, 1569 and 1411 cm−1 were attributed to stretching vibration modes of heptazine-derived repeating units, which agree with the XRD result of pure g-C3N4. The peaks at 1316 and 1238 cm−1 are assigned to the stretching vibration of connected trigonal units of C–N(–C)–C or bridging C–NH–C (partial condensation).30 In addition, the wide band between 3000–4000 cm−1 can be assigned to the absorption of water or O–H groups. For the GCN/Fe3O4 nanocomposite, the characteristic absorption of Fe3O4 centered at 585 cm−1 was observed, which corresponds to the vibration of the Fe–O bonds.31,32 It can be clearly seen that all of the main characteristic peaks of g-C3N4 and Fe3O4 appeared in the Fe3O4/GCN, and there is no obvious peak shift between the pure g-C3N4 and the GCN/Fe3O4 nanocomposite. The intensity of the peaks shows some variation compared with the pure g-C3N4, indicating that there are close interfacial connections between g-C3N4 and Fe3O4 rather than simply a physical adsorption,33 which is consistent with the HRTEM results, and these connections may serve as electron migration paths to promote the charge separation, leading to an improved photoactivity.34
XPS spectrum analysis was employed to investigate the valence states and chemical environment of the constituent elements on the surface of the GCN/Fe3O4 nanocomposite, which is shown in Fig. 4. Fig. 4a shows the survey spectrum of the GCN/Fe3O4. O, C, N and Fe elements were detected in the nanocomposites. Fig. 4b shows the regional spectra of C 1s, which can be deconvoluted into three peaks at 284.1, 286.8 and 287.8 eV. The peak at 284.6 eV arises from adventitious carbon, the peak at 286.1 eV can be assigned to C–N–C coordination, and the other peak at 288 eV can be attributed to the C–(N)3 group of g-C3N4.35–38 The N 1s region can be fitted into three peaks (Fig. 4c), ascribed to C–N–C (398.4 eV), N–(C)3 (400.1 eV) and C–N–H groups (401.3 eV), respectively.39 The XPS data also gives evidence for the existence of a graphite-like sp2-bonded structure in the GCNs.
![]() | ||
Fig. 4 (a) XPS survey spectrum of the GCN/Fe3O4 nanocomposite; (b–d) high-resolution binding energy spectra of C 1s, N 1s, and Fe 2p for the nanocomposite, respectively. |
The Fe 2p region of the spectrum is shown in Fig. 4d, two peaks were observed centered at about 725 and 711 eV, which were assigned to Fe 2p1/2 and Fe 2p3/2, respectively.40,41 These are almost equal to the standard binding energy of Fe3O4, suggesting the Fe element exists in a Fe3O4 form in the nanocomposite.42 Moreover, neither of the peaks of Fe–C or Fe–N were detected in the spectra, indicating that no chemical bonds formed between the Fe3O4 QDs and the GCNs, which is consistent with the above work.
The at. % of each element was found by calculating the peak areas, and shown in Table 1.
Name | Peak BE | Height counts | FWHM eV | Area (N) | at. % |
---|---|---|---|---|---|
C 1s | 284.6 | 12074.45 | 1.42 | 0.37 | 38.36 |
N 1s | 398.43 | 15284.8 | 1.39 | 0.45 | 47.74 |
O 1s | 532.54 | 8411.49 | 2.55 | 0.18 | 12.88 |
Fe 2p | 710.83 | 938.6 | 0.85 | 0 | 0.25 |
According to Table 1, the N:
C ratio is 1.22, which is lower than the theoretical value (1.33). This may mainly be due to the structure defects resulting from the existence of chemically oxygenic functional groups like C
O and –COOH, and the amount of oxygen may come from these groups and H2O which is adsorbed to the surface of the sample.
The photocatalytic activity of GCN/Fe3O4 nanocomposites with different loading amounts of Fe3O4 and pure g-C3N4 was evaluated by degrading the well-known organic dye RhB under visible-light irradiation. To fully consider the high adsorption ability of g-C3N4, an adsorption equilibrium experiment was also performed before the photocatalysis. The adsorption capacities are shown in Fig. 5a, it can be observed that all samples can achieve adsorption equilibrium within 60 min in the dark, and 59–83% of the RhB was adsorbed. Pure g-C3N4 exhibited the best adsorptivity, and the adsorptivity of the GCN/Fe3O4 nanocomposites decreased with increasing amounts of Fe3O4, which is due to the lower surface area of Fe3O4. The photodegradation process of RhB was recorded by the temporal evolution of the spectra and is shown in Fig. 5b. In order to observe the photocatalytic activity of the samples more visually, the degradation efficiency of the samples after irradiation for 1.5 h is plotted as a histogram (Fig. 5c). From Fig. 5b and c, the degradation efficiency after irradiation for 1.5 h is 72.5% for pure g-C3N4, 81% for GCN-1 wt% Fe3O4, 95% for GCN-2 wt% Fe3O4, 60.46% for GCN-3 wt% Fe3O4 and 57.2% for GCN-4 wt% Fe3O4. It is obvious that the photocatalytic activity was gradually enhanced with the increasing proportion of Fe3O4 at first, and the GCN-1 wt% Fe3O4 and GCN-2 wt% Fe3O4 can degrade RhB by nearly 100% within 90 min and 120 min, respectively. The as-prepared GCN-2 wt% Fe3O4 showed the highest photocatalytic activity. However, the photocatalytic activity of the nanocomposites decreased with further increased proportions of Fe3O4. Remarkably, the GCN-3 wt% Fe3O4 and GCN-4 wt% Fe3O4 showed lower photocatalytic activity than pure g-C3N4.
The mechanism of the photocatalytic activity of the samples under visible-light irradiation is proposed to be as follows: under visible light irradiation, the GCN was excited to generate photo-generated electrons from HOMO to LUMO. Without the presence of other materials, electrons will undergo a quick transition back to the valence band owing to the instability of excited states. Then, with the introduction of Fe3O4 QDs, the photogenerated e− in the GCN could easily transfer to Fe3O4 (CB) through their interfacial interaction because the energy level of the CB of GCN is higher than the Fermi level of Fe3O4, thus hindering electron–hole recombination.43–45 Therefore, the greatly enhanced photocatalytic activity can be attributed to the promotion of electron–hole separation by the electron transfer process, in addition to the large surface area of GCNs. GCN-2 wt% Fe3O4 exhibited the best photocatalytic activity, indicating that the adsorption capacities, photogenerated holes and electron transfer are optimal. However, with further increasing proportions of Fe3O4, the excess Fe3O4 QDs cover the active sites on the g-C3N4 surface and thereby reduce the efficiency of charge separation.46
Renewable catalytic activity is also very important for a photocatalyst, so the stability and durability of the GCN-2 wt% Fe3O4 nanocomposite was further studied by a recycling test which is shown in Fig. 5d. There is no significant loss of activity after three cycles of the degradation reaction, which indicates the superior stability and durability of the nanocomposites.
We also conducted a pilot study on the drug loading capacity of the material. Because the Brunauer–Emmett–Teller (BET) specific surface area and porous structure play an important role in drug load and delivery, so N2 adsorption measurement was conducted. Fig. 6a shows the nitrogen adsorption–desorption isotherm and the corresponding pore size distribution curve of the GCN-2 wt% Fe3O4 nanocomposite (inset in Fig. 6a). From the adsorption isotherm, the BET specific surface area of the sample was estimated to be 70 m2 g−1. It has lower specific surface area than graphene (200 m2 g−1), which is due to the stacking of graphene-like sheets. The isotherm of the nanocomposite is type IV (Brunauer–Deming–Deming–Teller classification) and exhibits H3 hysteresis loops, which suggests it has sheet-like morphology and slit-like mesopores,47 which is consistent with the TEM results (Fig. 2). As the inset shows, the pore-size distribution of the sample is very broad, indicating the existence of mesopores and macropores. Due to their especially large external surface area, the nanocomposites may show a large capacity for drug loading and delivery.
To investigate the loading capacity of the nanocomposites, we used the GCN-2 wt% Fe3O4 nanocomposite to absorb RhB as a model drug and measured the UV spectrum at 554 nm. The loading capacity was calculated by the differences in RhB concentration between the original RhB solution and the supernatant solution after loading. The saturated loading amount of RhB on the nanocomposite is shown in Fig. 6b, which can reach 108 mg g−1 at a RhB concentration of 20 mg l−1. Besides physical adsorption, hydrogen bonds and electrostatic interactions48 between GCNs and RhB may also play important roles in loading. Therefore, the loading capacity of the GCN/Fe3O4 nanocomposites means that they may be used as potential candidates for controlled magnetically targeted drug delivery.
This journal is © The Royal Society of Chemistry 2014 |