DOI:
10.1039/C4RA10572A
(Paper)
RSC Adv., 2014,
4, 59890-59901
A possible mechanism for the emergence of an additional band gap due to a Ti–O–C bond in the TiO2–graphene hybrid system for enhanced photodegradation of methylene blue under visible light†
Received
16th September 2014
, Accepted 22nd October 2014
First published on 23rd October 2014
Abstract
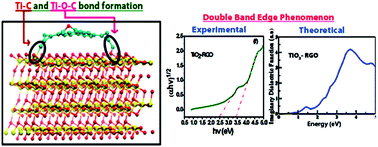
Here we report the experimental and theoretical study of two TiO2–graphene oxide (TG) and TiO2–reduced graphene oxide (TR) composites synthesized by a facile and ecological route, for enhanced visible light (∼470 nm) photocatalytic degradation of Methylene Blue (MB) (99% efficiency), with high rate constant values (1800% over bare TiO2). TG couples TiO2 nanopowder with Graphene Oxide (GO) while TR couples it with reduced graphene oxide (RGO). The present study, unlike previous reports, discusses never-before-reported double absorption edges obtained for both TG (3.51 eV and 2.51 eV) and TR (3.42 eV and 2.39 eV) composites, which represents the reason behind feasible visible light (2.56 eV) induced photocatalysis. TiO2 domains in the composites dominate the higher band edge, while GO/RGO domains explain the lower band edge. Formation of Ti–O–C bonds in both TG and TR drives the shifting upwards of the valence band edge and reduction in band gap. Further, these bonds provide a conductive pathway for charge carriers from TiO2 nanopowder to the degraded species via the GO/RGO matrix, resulting in decreased charge carrier recombination in TiO2 and enhanced efficiency. To attest that the developed theory is correct, density function theory (DFT) calculations were performed. DFT obtained energetics and electronic structures support experimental findings by demonstrating the role of the Ti–O–C bond, which results in double band edge phenomenon in composites. Finally, the mechanism behind MB degradation is discussed comprehensively and the effect of the weight percent of GO/RGO in the composite on the rate constant and photodegradation efficiency has been studied experimentally and explained by developing analytical equations.
Introduction
Hazardous waste management of organic dyes like Methylene Blue (MB), rhodamine B and crystal violet through photodegradation has remained a never-diminishing area of research.1–3 Heterogeneous photocatalysts have a commendable efficiency for degrading organic pollutants, and along this line, TiO2 is one of the most exhaustively studied materials owing to its excellent photo-functional properties, strong oxidizing power, absence of toxicity, long term photo and chemical stability, high refractive index and low production cost.1,4–7 Comprehensive reports showing photodegradation of MB via the exclusive use of TiO2 are present, but it is well understood that TiO2 alone fails to achieve high photocatalytic efficiency, because of its compromised quantum efficiency, due to the relatively fast recombination of electrons and holes, which adversely affects the surface redox reaction.8 Furthermore, TiO2 is activated only by ultraviolet light (<385 nm), as its band gap lies in the UV light energy range, which constitutes only about 3–5% of the solar spectrum.9 Practically, this factor strongly limits the use of solar spectrum light as a light source for photocatalysis purposes. This limitation can be circumvented by tailoring the absorption capacity of TiO2 in the visible range, which constitutes about 50% of the energy of the whole solar spectrum. The wide band gap of a TiO2 photocatalyst can be modified to extend its photoresponse into the visible region for degradation of organic dyes in several ways, including coupling with noble metals,10–12 quantum dots,13,14 non-metal doped semiconductors,6 carbon nanotubes (CNTs)15,16 and fullerenes.17 Further, reports attest that such composite formations,12,18–20 especially with carbon materials can inhibit the electron–hole pair recombination, thereby enhancing the photocatalytic performance of TiO2.15,21–23
Among the various carbon nanostructures, graphene and its derivatives, GO and RGO have captured much attention, owing to their modified optoelectronic properties, high surface area, superior electron mobility, lower cost and easy chemical modification to change surface properties, which is favorable for composites fabrication.24–27 Therefore, the combination of TiO2 and graphene is very promising as it simultaneously possesses excellent absorptivity, transparency, conductivity and permeability, which could assist effective photodegradation of pollutants.
There are a number of reports showing the enhanced photocatalytic activity of composites of TiO2 nanoparticles with graphene for the degradation of organic molecules and the photocatalytic splitting of water under UV light.22,28–38 The enhanced photocatalytic activity was attributed to the synergetic effect between graphene and TiO2 nanoparticles, because graphene acts as an excellent electron acceptor and transporter, and the Ti–O–C bond opens up an easy path for charge transfer which remarkably decreases the recombination of electron–hole pairs.3 Although claiming good efficiency, many of these reports are based on usage of un-ecological UV light and suffer from slow kinetics (k value).28–30
Realizing the importance of efficient visible light photodegradation, there are a few reports which show the enhanced photocatalytic activity of TiO2–GO/RGO composites under visible light.39–42 The results and application aspects are well understood in numerous articles for TiO2–graphene based composites; some of which attest the formation of Ti–O–C bonds in such composites,43 but there are none which provide a clear explanation for the mechanism behind the enhanced photocatalytic effect. To do a meticulous study of the reasons behind the successful visible light degradation of MB using such composites, we report two chemically bonded TiO2 nanopowder composites, of which one couples TiO2 nanopowder with GO and other with RGO using a facile synthesis route. Uniquely, using FT-IR analysis, the existence of a Ti–O–C bond between TiO2 and GO/RGO is confirmed. Because of such bond formations, never-before-discussed double absorption edges are obtained for both TG (3.51 eV and 2.51 eV) and TR (3.42 eV and 2.39 eV) composites. The TiO2 domains dominate the higher end of range, while the GO/RGO domains explain the lower end of range. Again the effect of a Ti–O–C bond represents the reason behind the depression of the higher value compared to that of bare TiO2 (3.68 eV) and the increase of lower end of range compared to pure GO/RGO (2.10 eV/1.83 eV). Two such absorption edges were earlier reported in the graphene-h-BN system.44 The existence of such double band edges in our composites is the novel reason behind the possibility of photocatalytic degradation upon irradiation with 470 nm visible light.
To provide support for our developed understanding, theoretical modeling of optical spectra based on density functional theory (DFT) and utilizing the projector augmented wave method (PAW) implemented in the VASP (Vienna ab initio Simulation Package) program for the theoretical prediction of the energetics and the electronic structure of the individual systems GO, RGO and TiO2 along with the composites of GO and RGO with TiO2 was performed. A comparable trend has been found between the experimentally and theoretically obtained optical responses, attesting to multiple absorption edges being present in the composites, with a similar trend in the band edge range when compared with bare TiO2 and GO/RGO, while as expected only a single absorption edge is obtained for TiO2, GO and RGO separately. Furthermore, the DFT obtained structure confirms the presence of Ti–O–C bonds in exact correspondence to the data obtained experimentally via FT-IR, whose formation due to the bonding between the free electrons on the surface of TiO2 with some unpaired π-electrons, shifts upward the valence band edge and reduces the band gap. Simultaneously, in harmony with the experimental results, better photo-efficiency in the case of TR than in the case of TG is confirmed via theoretical modelling, owing to better bond formation in case of modelled TR, compared to TG. This is further supported by a greater band edge shift and an even greater reduction in band gap as expected.
For a diligent study, the effect of the ratio of the two components, weight percentages of GO/RGO in both TG and TR composites have been studied. A photocatalytic investigation of the degradation of MB using bare TiO2, TG composites (both 5
:
1 wt% (TG1) and 2
:
1 wt% (TG2)) and TR composites (both 5
:
1 wt% (TR1)and 2
:
1 wt% (TR2)) has been accomplished in this work. The composites under normal visible light (470 nm) show astonishing photodegradation efficiency in comparison to bare TiO2 owing to the role of Ti–O–C bond formation as discussed above. Furthermore, the composites are significant for their high rate constants. The mechanism behind MB degradation is discussed comprehensively and an analytical model to explain the effect of the ratio of concentration of GO/RGO in the composites on the rate constants has been developed. Furthermore, our TR2 composite synthesized by the proposed fast, facile, ecological and economical route, achieves an astonishingly high MB degradation efficiency of 99% with an 1800% increase in the photocatalytic degradation rate constant value compared to bare TiO2.
Experimental section
Materials
Titanium(IV) butoxide, (C16H36O4Ti, Sigma-Aldrich Chemicals Pvt Limited, Germany, purity ≥97%), graphite flakes (1–2 mm, NGS Naturgraphit GmbH, Germany), potassium permanganate (KMnO4, ≥99.0%, Fluka), ethanol (CH3CH2OH, ≥98% Sigma-Aldrich, Germany), ammonia solution, H2SO4, H3PO4, H2O2 and H6N2O were used.
Preparation of graphene oxide
GO was synthesized via an improved Hummers method.45 Briefly, a 9
:
1 ratio of concentrated H2SO4/H3PO4 was added to 2 g of graphite flakes and 12 g (76 mM) of KMnO4. The mixture was isothermally stirred for 12 h at 50 °C. The mixture was cooled to room temperature, and subsequently the reaction was quenched by adding approximately 270 mL of ice with 2 mL of 30% H2O2. The obtained mixture was then filtered and centrifuged. The solid material was washed with distilled water, 30% HCl and ethanol until a pH ≈ 7 was attained and then dried at 80 °C in an oven. Finally the desired GO dispersion was procured by continuous ultra-sonication for an hour.
Preparation of reduced graphene oxide
RGO was synthesized by reducing the above as-obtained GO with the aid of hydrazine hydrate solution (H6N2O) as the reducing agent.46 Briefly, a 1000 mL (0.25 mg mL−1) solution of as-synthesized GO in double-distilled (DD) water was kept under ultra-sonication for an hour, to obtain a light-yellowish homogeneous solution. 3.92 mL of ammonia solution (25%) was added to the above-obtained GO solution to achieve a pH ≈ 10. Thereafter, 700 μL of H6N2O was added and the solution was kept under ultra-sonication at a temperature of 80 °C for three hours, followed by magnetic stirring at 95 °C for 2 h. In the final step, the yellowish GO solution turned black upon reduction. The solution was then filtered, followed by washing with DD water and drying at 80 °C.
Preparation of TiO2 nanopowder
TiO2 nanopowder was prepared using a sol–gel method13 employed with slight modifications. Typically, the solution A was prepared by dissolving 17 mL of Ti(OBu)4 (50 mM) in 40 mL of absolute ethanol. Solution B was obtained by mixing 3 mL of concentrated HNO3, 35 mL of absolute ethanol and 15 mL of de-ionized water. The solution B was mildly stirred and subsequently added dropwise to solution A over a time span of 25 minutes. The obtained mixture was further stirred for 90 minutes and left untouched for 30 h. This resulted in light white TiO2 gels, which were dried at 200 °C for 6 h. Ultimately the obtained pale yellow nanopowder was used for subsequent characterizations and photocatalytic measurements.
Preparation of composites
For the preparation of composites, 200 mg of TiO2 nanopowder was well dispersed in 200 mL of ethanol (96%) by sonication for an hour at ∼50 °C. Similarly, GO as well as RGO dispersions (1 mg mL−1) were prepared in ethanol (96%). The four combinations of composite materials were prepared by mixing 50 mL of TiO2 dispersion (1 mg mL−1) with 10 and 25 mL dispersions (1 mg mL−1) of GO as well as RGO. The composite solutions were sonicated for an hour at ∼70 °C and then dried at 45 °C. The solid materials thus obtained are abbreviated as TG1 (TiO2
:
GO = 5
:
1 wt%); TG2 (TiO2
:
GO = 2
:
1 wt%); TR1 (TiO2
:
RGO = 5
:
1 wt%) and TR2 (TiO2
:
RGO = 2
:
1 wt%).
Characterization
The morphologies of the as-synthesized samples were investigated using scanning electron microscopy (SEM) on a JEOL – Model JSM6300F-SEM instrument and transmission electron microscopy (TEM) using a FEI – Tecnai-20 electron microscope. The crystalline structures of GO, RGO, TiO2, TG and TR composites were characterized by X-ray diffraction (XRD) (diffractometer system-XPERT-PRO) using Cu-Kα1 radiation (λ = 1.5405980 Å). For Brunauer–Emmett–Teller (BET) measurements, nitrogen adsorption–desorption isotherms were measured at 77 K using the Autosorb 1-C instrument from Quantachrome Instrument Corp., USA. Raman measurements were performed on a micro-Raman setup (HR LabRam inverse system, JobinYvon Horiba). The 532 nm line from a frequency doubled Nd:YAG laser (Coherent Compass) was used as the excitation wavelength. Fourier transform infrared spectra (FTIR) of the samples were recorded using a Perkin Elmer Spectrum 65 FT-IR spectrometer. Photoluminescence (PL) spectra were measured on a fluorescence spectrophotometer (PerkinElmer) with an excitation wavelength of 300 nm. The EIS measurements were carried out on a PARSTAT 2273 potentiostat/galvanostat (Advanced Measurement Technology Inc., NPL, Delhi) by using three-electrode cells. The dye degradation level was measured using a UV/Vis/NIR Spectrophotometer (JASCO-V-670, with PMT and PbS detectors).
Computational methodology
The electronic structure calculations of the model systems were performed based on density functional theory.47,48 The projector augmented wave method (PAW) implemented VASP (Vienna ab initio Simulation Package) program49,50 was used throughout for the theoretical prediction of the energetics and the electronic structure. The Perdew–Burke–Ernzerhof (PBE) type of generalized gradient approximation (GGA) was employed as the exchange–correlation functional51,52 for the structural optimization of the structures. It is worth mentioning here that the generalized gradient approximation (GGA) tends to underestimate the binding energies, while local density approximation (LDA) tends to overestimate the binding energies. The Brillouin zone was sampled by a 3 × 3 × 1 k-mesh using the Monkhorst-Pack scheme and the optimal energy cutoff of 400 eV was used for the individual systems of the GO, RGO and TiO2 surfaces, while for the composite systems the gamma point was used. For the surface calculations, we used a vacuum of 15 Å in the z direction in order to avoid quenching of the wave functions for all the isolated systems, and for the nanocomposites the vacuum was 30 Å. A denser k-mesh was used to produce the density of states, and the smearing width was 0.05 eV. All the structures were optimized until the Hellman–Feynman forces acting on them reduced to 0.005 eV Å−1. For the electronic relaxation, the conjugate gradient algorithm was used.
Photocatalytic activity test
All four composites were separately dispersed in absolute ethanol (1 mg mL−1) by ultra-sonication. 10 ppm MB solution was prepared by dissolving 10 mg of MB powder in 1000 mL of distilled water. For the optimization of the individual composites, the catalytic measurements were carried out with three different proportions of MB and catalyst (CAT). The combinations of catalyst (TiO2), co-catalyst (GO or RGO) and distilled water (DW) used in the work are as listed below:
P1: (MB solution in DW (10 mg/1000 mL) = 2800 μL) + (CAT solution in ethanol (1mg mL−1) = 87.5 μL) + (DW = 612.5 μL). |
P2: (MB solution in DW (10 mg/1000 mL) = 2800 μL) + (CAT solution in ethanol (1mg mL−1) = 175 μL) + (DW = 525 μL). |
P3: (MB solution in DW (10 mg/1000 mL) = 2800 μL) + (CAT solution in ethanol (1mg mL−1) = 350 μL) + (DW = 350 μL). |
All three solutions were then irradiated (central wavelength at 470 nm) under constant stirring using LED torches (power ∼0.1 mW mm−2, Innotas Elektonik, GmbH Germany). UV-Vis absorption spectroscopy was used to study the variation in the absorption maximum of MB. Every hour the absorption measurement was taken, and the catalytic degradation was continued for five hours.
Results and discussion
Structure and morphology of TiO2 and TiO2–GO/RGO composites
We systematically investigated the quantitative effect of GO/RGO on photocatalytic activity and band gap modification of the as-synthesized composites. First, all samples were characterized both structurally and spectroscopically. The XRD patterns of GO, RGO, TiO2, TG, and TR are shown in Fig. S1 (see ESI).† In the diffraction pattern of GO, the peak around 2θ = 10.62° corresponds to the (001) reflection (interlayer spacing of 0.83 nm), while the other peak at ∼24° having lower intensity compared to the previous peak is due to short-range order in the stacked graphene-like sheets with spacing of around 0.36 nm. The diffraction peak of RGO at 24.04° corresponds to the (002) reflection, with a d-spacing of 0.37 nm. The XRD pattern of TiO2 nanopowder shows six distinct diffraction peaks at 20.78°, 25.1°, 30.39°, 37.94°, 48.21°, and 54.15°. These can be indexed respectively as the (102), (101), (101), (004), (200), and (105) planes of TiO2 (JCPDS no. 21-1272) having a fcc crystal structure. Among the above mentioned peaks, the small obtuse peak around 30.39° corresponds to the rutile (R) phase, while the other peaks denote the anatase (A) phase of TiO2. The diffraction peak at around 2θ = 20.78° corresponds to the (102) reflection for the Ti4O7 phase of titanium oxide (JCPDS no. 18-1402). The presence of broad peaks and the absence of unidentified peaks confirm the small size and high purity of the prepared nanopowder. Notably, in the diffraction pattern of TG, the sharp peak of GO becomes less intense, suggesting the disruption of the GO layers due to formation of a partially reduced GO structure and the formation of the composite material itself. Furthermore, it can be found that the XRD patterns of TG and TR show peaks which are similar to the diffraction pattern of TiO2. This indicates that the anatase phase is predominant in the composite samples. The XRD pattern of TR exhibits clear peaks of pure TiO2, but the peak at 25° in TiO2 is broadened due to its superimposition with the diffraction peak of RGO at 24.04°.
The morphologies of TiO2, TG and TR were characterized by using TEM and SEM. Fig. 1(a–d) show the TEM images of TiO2 and TG, whereas Fig. 1(e and f) show the SEM images of TR. From Fig. 1(a) it is clear that the TiO2 nanopowder consists of 2–15 nm sized TiO2 particles. Furthermore, the higher-magnification image (Fig. 1(b)) of the same sample delineates several crystal planes of TiO2 nanopowder which are randomly oriented across the particles. Fig. 1(c) shows the micrograph of TG, where TiO2 nanopowder can clearly be seen uniformly decorated on the surface of GO. Furthermore, the well resolved adjacent image (Fig. 1(d)) depicts the crystal planes of TiO2 nanopowder on the GO surface. From the SEM images of TR (Fig. 1(e) and (f)) it can be seen that the TiO2 nanopowder is well attached to the RGO surfaces. Thus, both TEM and SEM images (Fig. 1(c and f)) attest to the intimate contact between the TiO2 nanopowder and the GO and RGO sheets, which probably constitutes the basis for the electronic interactions between the components.53 These results further reveal that GO and RGO inhibit the aggregation of TiO2 nanopowder. The specific surface area of TiO2 nanopowder was measured by Brunauer–Emmett–Teller (BET) analysis, which showed the presence of a high specific surface area of TiO2 nanopowder of around ∼250 m2 g−1, attesting to the inhibition of TiO2 agglomeration (see ESI†). Additionally, the test also provided results for average pore diameter, which in the present case came out to be 0.24 nm. The Raman investigation (See ESI, Fig. S2†) supported the successful synthesis of GO, RGO, TiO2, TG and TR. Furthermore, Fourier transform infrared (FT-IR) spectra of the TiO2 nanopowder, TG and TR composites were measured to study the different functional groups and chemical bonds present, such as Ti–O–Ti vibrations and Ti–O–C vibrations in the system (Fig. S3, See ESI†), which were further confirmed by DFT calculations.
 |
| Fig. 1 (a) TEM images of TiO2 nanopowder; (b) HRTEM image of TiO2 nanopowder showing several crystal planes randomly oriented across the particles; (c) TEM image of TG; (d) HRTEM image of TG showing crystal planes. (e and f) SEM images of TR at different magnifications. | |
In order to study the formation of the chemical bonds Ti–O–C and Ti–C after loading TiO2 with GO and RGO, the interactions between TiO2 and GO/RGO were also investigated by the analysis of XPS results of TG and TR as shown in Fig. 2. The core level O 1s XPS spectra of TG and TR are shown to prove the existence of the Ti–O–C bond (Fig. 2(a and d)). The main peaks centered at 529.08 and 530.09 eV correspond to Ti–O–Ti (lattice O).54 The peaks with higher binding energy located at 530.02 and 530.89 eV are attributed to Ti–O–C for both TG and TR respectively.54 The other peaks centered at 532.11 eV and 532.89 eV correspond to Ti–OH and C–O groups for TG.54 Furthermore, in the case of TR, the peak centered at 531.65 eV was attributed to the C–O groups. Fig. 2(c) shows the core level spectra of C 1s for the TG hybrid with its peak positions observed at binding energies of 284.18, 284.94 and 287.44 eV, corresponding to C–C, C
O, and C–OH bonds, respectively.55 For the TR hybrid (Fig. 2(f)), three peaks centered at 284.21, 285.27, and 287.10 eV correspond to C–C in aromatic rings, C
O, and C–OH groups, respectively.2 Additionally, in TR, another peak at 282.5 eV (Ti–C) was observed, which could be because of the chemical bonding between titanium and carbon.55 Fig. 2(b) and (e) show the chemical states of the Ti(IV) species in TG and TR respectively. The Ti 2p core levels can be deconvoluted to a doublet (Ti 2p3/2 and Ti 2p1/2), exhibiting a binding energy difference (ΔEBE) of 5.61 and 5.71 eV for TG and TR respectively, which indicates the presence of normal states of Ti(IV), and is consistent with an earlier report.56 The binding of GO/RGO and TiO2 may be advantageous for the transport of electrons through the TG and TR hybrids. However, the increase in (ΔEBE) of TR reveals that the interaction between TiO2 and RGO is stronger than between TiO2 and GO.
 |
| Fig. 2 XPS analysis. O 1s (a and d), C 1s (c and f) and Ti 2p (b and e) core level XPS spectra of TG and TR hybrids, respectively. | |
Modified optical band gap study
The UV-Vis absorption spectra and PL spectra of the TiO2, TG and TR were measured in order to investigate the optical energy gaps of the samples. After the addition of GO/RGO, the synergistically interacting GO/RGO matrix modifies the electronic band gap structure of TiO2 and opens up an energy level between the conduction and valence bands, as a consequence of which the band gap energy of TiO2 is reduced, and an additional band edge originates. This result was explained analytically and supported by the similar double band edge structures obtained for the composites through DFT calculations.
Experimental study of the optical band gap
To determine the optical band gap, we plotted the modified Kubelka–Munk function, i.e., [αhν] 1/2 (α is the absorption coefficient, h is Planck’s constant, ν is the light frequency) versus the photon energy of the exciting light (hν). The absorption spectrum of bare TiO2 (Fig. 3(a)) shows one absorption edge corresponding to a band gap of 3.68 eV. The absorption spectra of GO and RGO show a weak absorption band of about 2.10 eV and 1.83 eV respectively (Fig. 3(b) and (c)). Uniquely, the absorption spectra of TG and TR composites show double absorption edges. For TG, the first absorption edge corresponds to an optical band gap of 3.51 eV, which must be driven by TiO2 domains in the composite. The value, as speculated, is less than that of bare TiO2 (3.68 eV), signifying the effect of the synergistic interaction of TiO2 and the underlying GO matrix on the TiO2 domains, caused by the Ti–O–C bond formation which was confirmed from the FT-IR spectra. In the case of the TR composites, this higher band edge value reduces to 3.42 eV, owing to enhanced interactions between TiO2 and the RGO matrix. This is attested to by the FT-IR analysis results, which show improved Ti–O–C bond signals in the case of the TR composites, in contrast to the case of the TG composites. The second (lower) absorption edge is obtained at 2.51 eV and 2.39 eV for the TG and TR composites respectively. The prominent driving force behind these absorption edges is the GO and RGO domains in the case of the TG and TR composites, respectively. Again as expected, the values of 2.51 eV (TG) and 2.39 eV (TR) are greater than those of pure GO (2.10 eV) and RGO (1.83 eV), which is a direct effect of TiO2 on the GO and RGO matrices, via Ti–O–C bond formation. Further, the quenching in the photoluminescence spectra of the TiO2 nanopowder after the addition of GO and RGO supports the reduction in the active band gap of TiO2 (see ESI, Fig. S4†). The above incisive explanation for multiple band gaps observed in the TG and TR results evinces the pioneering result of achieving the degradation of MB under normal visible light. This validates these composites as much better candidates, due to their better ecological profile compared to earlier UV-light-based MB degradation using TiO2 composites.
 |
| Fig. 3 (a) UV-Vis spectra of as-prepared TiO2 nanopowder, GO, RGO, TG and TR composites. The plot of the transformed Kubelka–Munk function versus the energy of light for the calculation of Eg, (b)–(f) for as-synthesized TiO2, GO, RGO, TG and TR composites respectively. | |
Computational study of the optical band gap
In order to support the experimental results outlined above, we calculated the optical spectra based on density functional theory (DFT) for the individual systems GO, RGO and TiO2 along with the composite systems GO and RGO with TiO2 (Fig. 4 and 5). The anatase TiO2 surface, which is a tetragonal crystal structure, was constructed with a slab size of 4 × 4 × 4, with an interlayer distance of 3.95 Å. The optical gap of any system is directly related to the first absorption peak of its optical spectrum. Therefore, determining the optical response is quite intuitive from the optical gap perspective. The visible-light-driven photocatalytic activity of the experimentally synthesized TiO2 nanopowder, TG and TR composites were compared from the optical spectra analysis, which is an consequence of the optical absorption gap of these materials. The calculated optical spectra can be compared to the UV-Vis spectra of experimentally synthesized TiO2 nanopowder, GO, RGO and their respective composites with TiO2 as depicted in Fig. 4 and 5. A similar trend was found between the experimentally and theoretically obtained optical responses. The absorption peak strength can also vary if one goes from an individual system to the composite systems. We started calculating the composites by introducing 3 Å distance between surface and adsorbate. This distance was chosen to be between physisorption and chemisorption binding. It was found that in the relaxed structures, this distance decreased to 2.4 Å and 2.1 Å for the TG and TR systems, respectively, as the shortest distance between adsorbate and surface. This leads to the inference that RGO binds more with anatase TiO2 than GO does, hence the charge transfer between the surface and the adsorbate is more significant in the case of TR than TG, which is in agreement with experimental findings. This influences the optical absorption peak for the nanocomposites as well. We can assume that the formation of the Ti–O–C bond is due to the bonding between the free electrons on the surface of TiO2 with some unpaired π-electrons, which then shift upward the valence band edge and reduce the band gap. Hence coinciding with the experimental findings, multiple absorption edges were found in the nanocomposites of TG and TR, whereas the single absorption edge is observed for the individual systems of TiO2, GO and RGO.
 |
| Fig. 4 Optimized structures and calculated imaginary dielectric functions (a.u.) as functions of energy for GO [(a) and (b), respectively], RGO [(c) and (d), respectively] and TiO2 [(e) and (f), respectively]. The cyan, red and yellow balls represent the carbon, oxygen and titanium atoms, respectively. | |
 |
| Fig. 5 Optimized structure (a) and calculated imaginary dielectric function (a.u.) as a function of energy (b) for GO + TiO2 heterojunction. Optimized structure (c) and calculated imaginary dielectric function (a.u.) as a function of energy (d) for RGO + TiO2 heterojunction. The cyan, red and yellow balls represent the carbon, oxygen and titanium atoms, respectively. | |
Enhanced photocatalytic activity
To study the effect of the wt% ratio of TiO2
:
GO/RGO on both the photodegradation efficiency of MB and the photocatalytic rate constants, five as-synthesized samples, abbreviated as bare TiO2 nanopowder, TG1, TG2, TR1, TR2 (for details see Section 2.5) were analyzed for their photocatalytic behavior in five equal time intervals (each of 60 min), under visible light (470 nm) irradiation. The observed change in normalized temporal concentration (C/C0) of MB during photodegradation is proportional to the normalized maximum absorbance (A/A0). Here initial concentration (C0) is regarded as the concentration of MB after adsorption equilibrium.
Fig. 6 illustrates the measured photodegradation performance of different photocatalysts with varying concentration under the same reaction conditions. Fig. 6(a) shows the remaining percentage of MB in solution after irradiation with visible light, and Fig. 6(b) depicts the photodegradation performance of MB with respect to time. It was found that the composites, TG and TR, exhibit faster and better photodegradation capability than pure TiO2 nanopowder. Multiple concentrations of TG1, TG2, TR1 and TR2 were studied for photodegradation of MB (Fig. 6(c) and 6(d)). An increase in the concentration of the TR composites in MB solution (P1, P2 and P3) improves the photocatalytic activity, while decreased photocatalytic activity is observed upon increasing the concentration of the TG composite (P1 to P3); (For details see Section 2.8). The TR2–P3 composite shows the highest photocatalytic activity with an average degradation of MB of 98.72% within 300 min, while with pure TiO2 nanopowder this value drops down to 36.84% and for GO or RGO, it is ∼38% for the same period of time. Without the use of a catalyst, the concentration of MB changes slightly both under exposed (around 5% during 300 min exposure) and dark (only 3%) conditions.
 |
| Fig. 6 The bar plot showing the remaining MB in solution after the irradiation with visible light (470 nm) over the as-synthesized TiO2 nanopowder, GO, RGO, TG and TR composites (a), in liquid phase maximum photocatalytic degradation of MB under visible light (470 nm) over TiO2, GO, RGO, TG and TR composites (b), photodegardation of MB over TG (5 : 1) and TR (5 : 1) (c) and photodegradation of MB over TG (2 : 1)and TR (2 : 1) (d) under visible light. | |
Fig. 7 summarizes the meticulous comparative analysis of photodegradation efficiencies and rate constants of all four as-synthesized TiO2 composites (TG1, TG2, TR1, TR2), with as-synthesized bare TiO2 nanopowder and the previously reported26 TiO2–graphene composite for MB degradation, carbon nanotubes/TiO2 nanotubes15 and M-fullerene/TiO2 for MO and MB degradation respectively.17 Fig. 7 clearly shows that the k value and photodegradation efficiency of our synthesized composites is high in comparison to previously reported TiO2–graphene composites even though they have used UV light which has a higher energy than visible light. For determining the rate constant, the degradation of dye could be assigned to a pseudo-first-order kinetics reaction by a linear plot with a simplified Langmuir–Hinshelwood model when C0 is low.57 That is,
where
k is the apparent first-order rate constant.
 |
| Fig. 7 Comparative study of rate constants (k) and photodegradation efficiencies of TG and TR composites (present work) vs. bare TiO2 (present work)/previously reported TiO2–graphene composites, CNT-TiO2 composites and Pd-fullerene TiO2 hybrids for photocatalytic degradation of methylene blue. | |
Clearly both TG (TG1 and TG2) and TR (TR1 and TR2) composites surpass bare TiO2 in terms of efficiency and rate constant. For the TR2 composite, the highest k value is 0.0621 min−1 (with efficiency ∼99%) and for the TG2 composite it is 0.0236 min−1 (with efficiency ∼76%), which is about 1780% and 614% higher than that of bare TiO2 (36% efficiency with k value 0.0033 min−1). Clearly both TR1/TG1 have lower rate constant values compared to TR2/TG2 respectively, attesting to the enhanced effect of decreasing wt% TiO2 in both composites on the rate constant. In contrast, the effect of decreased wt% TiO2 in composites on photodegradation efficiency, is the opposite for TG (a decrease), than in the case of TR (an increase). A detailed analytical model explaining the probable reasons behind such dependence of rate constant and photodegradation efficiency on the wt% of GO/RGO in TG and TR composites has been provided in the ESI.†
Mechanism of enhanced photodegradation efficiency
The schematic (Fig. 8(a)) illustrates the mechanism of charge transfer from TiO2 to GO and RGO via the interfaces supported by Ti–O–C bonds, which give a path for the charge transfer from TiO2 to the GO/RGO matrix and hinder the recombination of electron–hole pairs. After irradiation with visible light, photoexcitation in TiO2 occurs from O-2p orbital on the valance band (VB) to the Ti-3d orbital on the conduction band (CB), generating holes at the O-2p state with a very high redox potential.58 Due to the high redox potential of the holes, hydroxyl radicals (˙OH) are produced from water, having the potential to degrade the organic pollutants. The photo-generated electrons in the TG or TR photocatalyst can now easily migrate from the inner region to the surface and react with adsorbed O2 on the surface, resulting in generation of radicals such as O2˙−, thereby increasing the overall efficiency. The reaction mechanism behind the degradation of MB by the TR composite (also valid for TG composite by replacing RGO with GO) can be expressed as follows:
TiO2–RGO + hν → TiO2 (e−) − RGO + TiO2 (h+) − RGO |
TiO2 (e−) − RGO → TiO2 – RGO (e−) |
RGO (e−) + O2 → RGO + O2˙− |
TiO2 (h+) + H2O → H+ + OH˙ |
O2˙− + OH˙ + MB → Degradation of MB |
 |
| Fig. 8 (a) Schematic illustration of the enhanced photocatalytic activity of TR composites for the photodegradation of MB under visible light irradiation. (b) EIS changes of TiO2, TG and TR electrodes. The EIS measurements were performed in the presence of a PBS solution (pH 7) containing 5 mM [Fe(CN)6]3−/4−. | |
The enhancement of charge carrier separation clearly results in an increased concentration of more reactive oxidizing species (such as OH˙, O2˙−), which enhances the photodegradation of MB.25 The typical electrochemical impedance spectra (Fig. 8(b)) of ITO, TiO2, TG and TR clearly attest to enhanced photocatalytic degradation in TG and TR. Here the impedance spectra in the frequency range varying from 0.01 Hz to 10 kHz were recorded in the three electrode configuration using the catalytic materials as the working electrode, Ag/AgCl as the reference electrode, platinum as the counter electrode and PBS solution (pH 7) containing 5 mM [Fe(CN)6]3−/4− as the electrolyte. A single semicircle at the high frequency region and a straight line at the low frequency region indicate a mixed charge transfer and charge diffusion process.59 It is observed that, with the introduction of GO/RGO into TiO2, though in small amounts, the span of the semicircle is reduced, which indicates a decrease in both the solid state interface layer resistance and the charge transfer resistance (Rct) on the surface. The Rct values of the TG/TR electrodes were much smaller than that of the TiO2 electrode, which illustrates that TG/TR lead to a much lower charge transport resistance and a much higher separation efficiency of electrons and holes, both together resulting in enhanced photocatalytic degradation of MB.
Conclusions
Distilling the above work, we developed two classes of chemically bonded TiO2–GO/RGO hybrids with different weight-percent-ratios using a facile, economic, ecological and fast route, exhibiting high photocatalytic activities (for TR2 – 99%) and high rate constant values (for TR2 – 1900% more than bare TiO2) under visible light. FT-IR analysis confirms the formation of Ti–O–C bonds in both the TR and TG composites, resulting in the emergence of new a optical band edge in both TG (3.51 eV and 2.51 eV) and TR (3.42 eV and 2.39 eV) composites. Complementary DFT calculations again confirm, both a similar trend of double band edges for composites and the existence of Ti–O–C bonds, which shift upwards the valence band edge and reduce the band gap. Furthermore, these bonds provide a conductive pathway for charge carriers, inhibiting their recombination in TiO2 (confirmed by EIS and PL spectra), resulting in enhanced efficiency compared to bare TiO2. Greater narrowing of the band gap and better conductivity in the case of TR is observed compared to TG. Also, theoretically better binding of RGO with anatase TiO2, than of GO with anatase TiO2 is observed. The consequence is a better photocatalytic response of TR compared to TG composites.
Author contributions
S.U. and S.A. equally contributed on this work. A.S. conceived the experiment. S.U. and S.A. contributed to sample fabrication. S.U. carried out the UV absorption, PL measurement and FTIR spectra. V.C. carried out the Raman measurements. S.A. and F.T. performed the photocatalytic experiments. B.D. and J.P. discussed regularly the measurement results while conducting the experiments. C.J.R., S.C. and R.A. performed theoretical analysis by DFT. P.K.S. discussed all the optical measurement results. S.P. has corroborated the work with an analytical model for enhanced photocatalytic activity. S.U., S.A., S.P. and A.S. co-wrote the manuscript. All authors discussed the results and commented on the paper.
Conflict of interests
The authors declare no competing financial interest.
Acknowledgements
The authors express their sincere gratitude to the late Prof. B. P. Asthana, who had initiated this project. The authors are thankful to Andy Scheffel and Dr Jan Dellith from IPHT, Jena for SEM measurements, Mrs Anna Schmidt from IPC, Jena for BET measurements, Christa Schmidt from IPHT and Mr Vineet Srivastava from IIT Kanpur for XRD measurements, Dr Il-Kwon Oh from KAIST, South Korea for TEM measurements, and Prof. Snajay Kumar from Bio-physics lab, BHU, for PL and some of UV-Vis measurements. The authors are thankful to Dr Preeti Suman Saxena, Department of Zoology, Banaras Hindu University for providing some of her laboratory facilities. Two of us (SA, JP) are thankful to Deutsche Forschungs-Gemeinschaft (DFG). AS acknowledges the CAS program sponsored by UGC at Department of Physics, B. H. U and DST, New Delhi, India. SU, SA and RKS express their gratitude for the U.G.C. financial assistance. BD and FT gratefully acknowledge funding of the research project ‘Photonic Nanomaterials’ – PhoNa (Grant no. 03IS210EA) within the framework ‘Spitzenforschung und Innovation in den Neuen Ländern’ from the Bundesministerium für Bildung und Forschung (BMBF). CR would like to acknowledge CNPq and CAPES for the financial support. SC and RA would like to acknowledge the Carl Tryggers Stiftelse for Vetenskaplig Forskning (CTS), Swedish Research Council (VR), Swedish Energy Agency, and Stiffelsen J. Gust Richerts Minne (SWECO) for financial support. SNIC is also acknowledged for providing computing time.
References
- M. A. Al-Ghouti, M. A. M. Khraisheh, S. J. Allen and M. N. Ahmad, J. Environ. Manage., 2003, 69, 229–238 CrossRef CAS PubMed.
- M. R. Hoffmann, S. T. Martin, W. Choi and D. W. Bahnemann, Chem. Rev., 1995, 95, 69–96 CrossRef CAS.
- A. Fujishima and K. Honda, Nature, 1972, 238, 37–38 CrossRef CAS.
- H. S. Wahab, T. Bredow and S. M. Aliwi, Chem. Phys., 2008, 353, 93–103 CrossRef CAS PubMed.
- A. Yamakata, T.-a. Ishibashi and H. Onishi, Chem. Phys., 2007, 339, 133–137 CrossRef CAS PubMed.
- Y. Ni, Y. Zhua and X. Ma, Dalton Trans., 2011, 40, 3689–3694 RSC.
- R. M. D. Hernandez-Alonso, F. Fresno, S. Suarez and J. M. Coronado, Energy Environ. Sci., 2009, 2, 1231–1257 Search PubMed.
- A. L. Linsebigler, G. Lu and J. T. Yates, Chem. Rev., 1995, 95, 735–758 CrossRef CAS.
- A. Kudo, K. Omori and H. Kato, J. Am. Chem. Soc., 1999, 121, 11459–11467 CrossRef CAS.
- S. Kim, S. J. Hwang and W. Choi, J. Phys. Chem. B, 2005, 109, 24260–24267 CrossRef CAS PubMed.
- X. Zhang, Y. Liu, S.-T. Lee, S. Yang and Z. Kang, Energy Environ. Sci., 2014, 7, 1409–1419 CAS.
- T. Tong, J. Zhang, B. Tian, F. Chen, D. He and M. An, J. Colloid Interface Sci., 2007, 315, 382–388 CrossRef CAS PubMed.
- E. A. Kozlova, N. S. Kozhevnikova, S. V. Cherepanova, T. P. Lyubina, E. Y. Gerasimov, V. V. Kaichev, A. V. Vorontsov, S. V. Tsybulya, A. A. Rempel and V. N. Parmon, J. Photochem. Photobiol., A, 2012, 250(103), 103–109 CrossRef CAS PubMed.
- X. Yu, J. Liu, Y. Yu, S. Zuo and B. Li, Carbon, 2014, 68, 718–724 CrossRef CAS PubMed.
- M. L. Chen, F. J. Zhang and W. C. Oh, J. Korean Ceram. Soc., 2008, 45, 651–657 CrossRef CAS.
- J. Yu, T. Ma and S. Liu, Phys. Chem. Chem. Phys., 2011, 13, 3491–3501 RSC.
- Z.-D. Meng, F.-J. Zhang, L. Zhu, C.-Y. Park, T. Ghosh, J.-G. Choi and W.-C. Oh, Mater. Sci. Eng., C, 2012, 32, 2175–2182 CrossRef CAS PubMed.
- M. Wang, J. Ioccozia, L. Sun, C. Lin and Z. Lin, Energy Environ. Sci., 2014, 7, 2182–2202 CAS.
- Z. Zhang, C. Shao, X. Li, Y. Sun, M. Zhang, J. Mu, P. Zhang, Z. Guo and Y. Liu, Nanoscale, 2013, 5, 606–618 RSC.
- P. A. DeSario, J. J. Pietron, D. E. DeVantier, T. H. Brintlinger, R. M. Stroud and D. R. Rolison, Nanoscale, 2013, 5, 8073–8083 RSC.
- W. Ren, Z. Ai, F. Jia, L. Zhang, X. Fan and Z. Zou, Appl. Catal., B, 2007, 69, 138–144 CrossRef CAS PubMed.
- W. Wang, J. Yu, Q. Xiang and B. Cheng, Appl. Catal., B, 2012, 119–120, 109–116 CrossRef CAS PubMed.
- Y. Yao, G. Li, S. Ciston, R. M. Lueptow and K. A. Gray, Environ. Sci. Technol., 2008, 42, 4952–4957 CrossRef CAS.
- K. S. Novoselov, A. K. Geim, S. V. Morozov, D. Jiang, Y. Zhang, S. V. Dubonos, I. V. Grigorieva and A. A. Firsov, Science, 2004, 306, 666–669 CrossRef CAS PubMed.
- A. K. Geim, Science, 2009, 324, 1530–1534 CrossRef CAS PubMed.
- K. Krishnamoorthy, R. Mohan and S.-J. Kim, Appl. Phys. Lett., 2011, 98, 244101–244103 CrossRef PubMed.
- T.-F. Yeh, J.-M. Syu, C. Cheng, T. T.-H. Chang and H. Teng, Adv. Funct. Mater., 2010, 20, 2255–2262 CrossRef CAS.
- N. Zhang, Y. Zhang and Y.-J. Xu, Nanoscale, 2012, 4, 5792–5813 RSC.
- N. Yang, Y. Liu, H. Wen, Z. Tang, H. Zhao, Y. Li and D. Wang, ACS Nano, 2013, 7, 1504–1512 CrossRef CAS PubMed.
- G. Jiang, Z. Lin, C. Chen, L. Zhu, Q. Chang, N. Wang, W. Wei and H. Tang, Carbon, 2011, 49, 2693–2701 CrossRef CAS PubMed.
- Y. Gao, X. Pu, D. Zhang, G. Ding, X. Shao and J. Ma, Carbon, 2012, 50, 4093–4101 CrossRef CAS PubMed.
- H. Zhang, X. Lv, Y. Li, Y. Wang and J. Li, ACS Nano, 2009, 4, 380–386 CrossRef PubMed.
- X. Yin, H. Zhang, P. Xu, J. Han, J. Li and M. He, RSC Adv., 2013, 3, 18474–18481 RSC.
- Q. Xiang, J. Yu and M. Jaroniec, Chem. Soc. Rev., 2012, 41, 782–796 RSC.
- X. An and J. C. Yu, RSC Adv., 2011, 1, 1426–1434 RSC.
- Q. Xiang, J. Yu and M. Jaroniec, Nanoscale, 2011, 3, 3670–3678 RSC.
- X. Zhou, T. Shi, J. Wua and H. Zhoua, Appl. Surf. Sci., 2013, 287, 359–368 CrossRef CAS PubMed.
- S. M. -Torres, L. M. P. -Martínez, J. L. Figueiredo, J. L. Faria and A. M. T. Silva, Appl. Surf. Sci., 2013, 275, 361–368 CrossRef PubMed.
- C. Chen, W. Cai, M. Long, B. Zhou, Y. Wu, D. Wu and Y. Feng, ACS Nano, 2010, 4, 6425–6432 CrossRef CAS PubMed.
- G. S. Anjusree, A. S. Nair, S. V. Nair and S. Vadukumpully, RSC Adv., 2013, 3, 12933–12938 RSC.
- S. D. Perera, R. G. Mariano, K. Vu, N. Nour, O. Seitz, Y. Chabal and K. J. Balkus, ACS Catal., 2012, 2, 949–956 CrossRef CAS.
- N. R. Khalid, E. Ahmed, Z. Hong, L. Sana and M. Ahmed, Curr. Appl. Phys., 2013, 13, 659–663 CrossRef PubMed.
- Q. Huang, S. Tian, D. Zeng, X. Wang, W. Song, Y. Li, W. Xiao and C. Xie, ACS Catal., 2013, 3, 1477–1485 CrossRef CAS.
- L. Ci, L. Song, C. Jin, D. Jariwala, D. Wu, Y. Li, A. Srivastava, Z. F. Wang, K. Storr, L. Balicas, F. Liu and P. M. Ajayan, Nat. Mater., 2010, 9, 430–435 CrossRef CAS PubMed.
- D. C. Marcano, D. V. Kosynkin, J. M. Berlin, A. Sinitskii, Z. Sun, A. Slesarev, L. B. Alemany, W. Lu and J. M. Tour, ACS Nano, 2010, 4, 4806–4814 CrossRef CAS PubMed.
- D. Li, M. B. Muller, S. Gilje, R. B. Kaner and G. G. Wallace, Nat. Nano., 2008, 3, 101–105 CrossRef CAS PubMed.
- P. Hohenberg and W. Kohn, Phys. Rev., 1964, 136, 864–871 CrossRef.
- W. Kohn and L. Sham, Phys. Rev. A: At., Mol., Opt. Phys., 1965, 140, 1133–1138 CrossRef.
- G. Kresse and J. Hafner, Phys. Rev. B: Condens. Matter Mater. Phys., 1994, 49, 14251–14269 CrossRef CAS.
- G. Kresse and J. Furthmüller, Comput. Mater. Sci., 1996, 6, 15–50 CrossRef CAS.
- J. P. Perdew, J. A. Chevary, S. H. Vosko, K. A. Jackson, M. R. Pederson, D. J. Singh and C. Fiolhais, Phys. Rev. B: Condens. Matter Mater. Phys., 1992, 46, 6671–6687 CrossRef CAS.
- J. P. Perdew and Y. Wang, Phys. Rev. B: Condens. Matter Mater. Phys., 1992, 45, 13244–13249 CrossRef.
- T. Xu, L. Zhang, H. Cheng and Y. Zhu, Appl. Catal., B, 2011, 101, 382–387 CrossRef CAS PubMed.
- T. Lu, R. Zhang, C. Hu, F. Chen, S. Duo and Q. Hu, Phys. Chem. Chem. Phys., 2013, 15, 12963–12970 RSC.
- H.-N. Kim, H. Yoo and J. H. Moon, Nanoscale, 2013, 5, 4200–4204 RSC.
- N. K. Allam, F. Alamgir and M. A. El-sayed, ACS Nano, 2010, 4, 5819–5826 CrossRef CAS PubMed.
- X. H. Wang, J. G. Li, H. Kamiyama, Y. Moriyoshi and T. Ishigaki, J. Phys. Chem. B, 2006, 110, 6804–6809 CrossRef CAS PubMed.
- W. Geng, H. Liu and X. Yao, Phys. Chem. Chem. Phys., 2013, 15, 6025–6033 RSC.
- Y. Liu, D.-P. Wang, Y.-X. Yu and W.-D. Zhang, Int. J. Hydrogen Energy, 2012, 37, 9566–9575 CrossRef CAS PubMed.
Footnotes |
† Electronic supplementary information (ESI) available: The supporting file includes the Raman and FTIR spectra and the XRD diffraction patterns of as-synthesized GO, RGO, TiO2, and composites as well as PL emission spectra with explanations. See DOI: 10.1039/c4ra10572a |
‡ These authors contributed equally to this work. |
|
This journal is © The Royal Society of Chemistry 2014 |
Click here to see how this site uses Cookies. View our privacy policy here.