DOI:
10.1039/C4RA10311D
(Communication)
RSC Adv., 2014,
4, 56809-56815
Mesopattern of immobilised bone morphogenetic protein-2 created by microcontact printing and dip-pen nanolithography influence C2C12 cell fate†
Received
12th September 2014
, Accepted 27th October 2014
First published on 27th October 2014
Abstract
Dip-pen nanolithography and microcontact printing were used to fabricate mesopatterned substrates for cell differentiation experiments. A biotin–thiol was patterned on gold substrates and subsequently functionalised with streptavidin and biotinylated bone morphogenetic protein-2 (BMP-2). The feasibility of mesopatterned substrates containing immobilised BMP-2 was proven by obtaining similar differentiation outcomes compared to the growth factor in solution. Therefore, these substrates might be suitable for replacing conventional experiments with BMP-2 in solution.
Introduction
Chemical surface modifications for cell adhesion, migration and differentiation experiments have been extensively described for both the microscale (from 20 μm upwards) and the nanoscale (from 500 nm downwards). By definition,1,2 micropatterning or “cell patterning” is used to place cells in a certain manner on the substrate or dictate their shape, which, in turn, has been shown to highly influence cell fate (see the review of M. Théry for a detailed summary3). On the other hand, nanopatterns are usually applied for controlling cell-substrate interactions and are known to influence cell adhesion,4 proliferation and differentiation.5 Nevertheless, few examples so far are located in the “gap” between micro- and nanoscale features. Graham and co-workers denominated patterns with features smaller than 10 μm mesopatterns to clearly distinguish them from conventional micropatterns.6 On these mesopatterns cells are able to spread across various features and overcome possible pattern restrictions.7,8 This characteristic allows for tuning and controlling the concentration and spatial arrangement of an immobilised molecule.9 Protein patterns with features between 1 and 10 μm are easily obtained by microcontact printing (μCP), even though inefficient molecule transfer can be a drawback.1 For patterning with μCP, a silicon master is fabricated via photolithography and subsequently used to produce a PDMS stamp. The molecule transfer occurs by placing an inked stamp in contact with a surface. A very interesting alternative for the fabrication of protein mesopattern is the nanofabrication technique dip-pen nanolithography (DPN),6,10 which allows direct and controlled deposition of biomolecules. DPN is an AFM-based direct-writing technique where a sharp cantilever is used to deposit molecules via a water meniscus or as ink droplets. In contrast to μCP, DPN is a maskless technique and time and cost expensive fabrication of masters is not necessary, thus providing easy flexibility in pattern design. DPN furthermore permits multiplexing, i.e. writing with different inks at the same time.11 To our knowledge, mesopatterns have to date been used exclusively for studying cell adhesion, migration and guidance, mostly by immobilising extra cellular matrix (ECM) proteins or their components.7,12 Other biologically relevant molecules, like growth factors, have not yet been applied to mesopatterns. Influencing cellular growth, proliferation and differentiation, growth factors are known to not only have dose-dependent effects on cells, but also their distribution and spatial organisation are crucial. Therefore, cell differentiation experiments call for enhanced control over distribution and local density of the respective factor. For example, bone morphogenetic protein-2 (BMP-2) is known to have a dose-dependent effect.13 Surface immobilisation is thought to have advantages over presenting a growth factor in solution. Immobilised BMP-2 can in principle bind their receptors on the cell surface without being internalised, thus extending the signalling time.14 Pohl et al. mention as advantages targeted presentation and control over the local density of a factor.15 Furthermore, the loss of the signalling molecule due to diffusion in the culture medium can be avoided, which leads to its sustained influence.16 Our group has successfully applied a sandwich complex, for the covalent immobilisation of BMP-2 on substrates, most importantly maintaining its biological activity.17,18
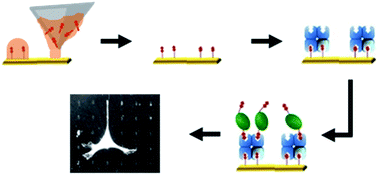
In this communication, we present the proof of concept that mesopatterns are suitable for cell differentiation experiments. For the fabrication of the mesopatterns, DPN was employed as well as μCP, which served as a reference patterning technique. Both techniques were used to deposit a biotin–thiol molecule.19 Gold substrates with a homogeneous layer of biotin–thiol were used as control. Further derivatisation with streptavidin and lastly biotinylated bone morphogenetic protein-2 (BMP-2) ensured that BMP-2 was anchored in a stable and directional manner on the substrate (see Fig. 1). The response of myoblastic C2C12 cells to the immobilised BMP-2 was analysed and quantified by staining for the early differentiation marker osterix.
 |
| Fig. 1 Schematic representation of the functionalisation steps for the gold substrates: biotin–thiol, streptavidin and bone morphogenetic protein-2 (BMP-2). | |
Results and discussion
Deposition of biotin–thiol via μCP was straight-forward: the elastomeric stamp with round features of 5 μm in diameter was incubated in a solution of biotin–thiol in ethanol. The biotin–thiol was transferred onto the gold by placing the stamp in contact with the surface. The remaining free space between the pattern was passivated against unspecific cell adhesion with polyethylene-glycol. For deposition of biotin–thiol via DPN, a carrier molecule was used, namely 1,2-dioleoyl-sn-glycero-3-phosphocholine (DOPC). This strategy was chosen because the deposition rate of biotin–thiol without a carrier molecule was very slow (see Fig. S2†).20 By using DOPC as a carrier, dwell times of 0.2 s could be obtained (compared to around 60 s without the use of DOPC). As stated by Derda et al.,21 substrates suitable for cell experiments have to have a patterned area of minimum 0.25 mm2. Due to the vast reduction in needed dwell time by utilising the carrier ink DOPC instead of pure biotin–thiol (0.2 s instead of 60 s), patterning on this area size scale became feasible, with typical writing times of 30–40 min per sample of 2.36 mm2. After allowing the biotin–thiol to bind to the gold, the carrier lipid was washed away. Though DPN, in contrast to μCP, can pattern only comparably small areas in one writing step, patterning of sufficiently large areas for cell culture experiments can be achieved by using cantilever arrays and an adequate writing strategy. The fabrication process, reaching a homogeneous mesopattern over a large area, is given in Fig. S3–S6.† Fig. S7† shows the darkfield microscopy image of an optimised mesopattern of DOPC containing biotin–thiol on gold, with a total pattern area of 2.36 mm2. The homogeneity of the pattern is satisfying, because all dots have similar diameters with a narrow distribution. The mean dot size was determined to be 4.01 ± 0.90 μm in diameter.
An overview over all the substrates used for cell experiments can be found in Table 1. Experiments with BMP-2 in solution have been carried out in a representative experiment.18
Table 1 Pattern parameters for all substrates
|
Homogeneous |
μCP |
DPN |
Method |
Immersion |
Microcontact printing |
Dip-pen nanolithography |
Feature size |
Monolayer |
5 μm round |
4 μm dots |
Spacing |
— |
5 μm |
22 μm |
After immobilising biotin–thiol on the substrates, they were incubated with streptavidin, leading to a transformation of the biotin pattern into a streptavidin pattern. Subsequently, half of the substrates were functionalised with biotinylated BMP-2 binding to the streptavidin features, while the other half, without BMP-2, served as negative control. For cell differentiation experiments, C2C12 myoblastic cells were seeded on the substrates. BMP-2 is known to play a very important role in the C2C12 cell fate: in the presence of BMP-2 they will differentiate towards osteoblasts.22 Without BMP-2, they will stay in the myoblastic lineage. Quantification of osteogenic differentiation was performed as described below (see Fig. 7): cells with a “hollow”, i.e. black nucleus have not started to differentiate towards osteoblast lineage cells. Cells which are homogeneously stained or have a pronounced green nucleus have started to differentiate towards osteoblasts. Fig. 2 shows a representative fluorescence image of C2C12 cells on a substrate prepared by μCP with (+) and without (−) BMP-2. The solid white arrows indicate cells which have started to differentiate towards osteoblast lineage cells. The dashed white arrows indicate cells which are not in the osteoblastic regime. As expected, more cells have differentiated towards osteoblast lineage cells on the BMP-2 containing substrates.
 |
| Fig. 2 Fluorescence microscopy images of C2C12 myoblastic cells on microcontact printed substrates with BMP-2 (+) and without BMP-2 (−). (Dashed) white arrows indicate cells which have (not) differentiated towards the osteoblastic regime. The scale bars equal 50 μm. | |
For the substrates without BMP-2 (−), less cells adhered to the substrate. This might be explained by the fact that streptavidin slows down cell adhesion, acting as an anti-adhesive matrix towards both proteins and cells: cell adhesion was found to be initiated after 18 h.23 Since staining for osterix was performed after 24 h, the cells had only little time to adhere and spread. This was also observed for cells on the other substrates without BMP-2 (DPN and homogeneous). Fig. 3 shows the fluorescence images of C2C12 cells on substrates fabricated with DPN. The substrate containing BMP-2 (+) clearly shows that all cells in the image have osterix located inside the nucleus, whereas the substrate without BMP-2 (−) shows only empty nuclei. Nevertheless, the efficiency of the DPN substrates did not reach 100%: apart from differentiated cells, there were also many cells with an empty nucleus, even though located on top of the BMP-2 pattern (data not shown).
 |
| Fig. 3 Fluorescence microscopy images of C2C12 myoblastic cells on substrates fabricated by dip-pen nanolithography, with BMP-2 (+) and without BMP-2 (−). The scale bars equal 50 μm. | |
On the basis of evaluated images for all substrates, the percentage of differentiated cells was calculated and is represented in Fig. 4. Significant differences were obtained between respective substrates with/without BMP-2. Precise values for the percentage of cell differentiation towards osteoblast lineage cells are given in Table 2. For comparison, when working with BMP-2 in solution, the reported percentages are around 90%.24
 |
| Fig. 4 Graph representing the percentage of the fluorescently marked protein osterix (OSX) localised in the cytosol (light grey), cytosol and nucleus (grey) and mostly in the nucleus (dark grey). The left side shows the substrates with BMP-2, the right side the substrates without BMP-2. At least 80 cells were evaluated per substrate and all substrates were prepared triplicate. For statistical purposes ANOVA was performed with a value of α = 0.05. | |
Table 2 Percentage of differentiated C2C12 myoblastic cells towards osteoblast lineage cells in comparison to the values of BMP-2 surface coverage and density for the three substrates used in cell culture experiments: dip-pen nanolithography (DPN), microcontact printing (μCP) and without pattern feature (homogeneous)
Substrate (+BMP-2) |
Homogeneous |
μCP |
DPN |
Percentage of differentiated cells (%) |
82 ± 3 |
91 ± 1 |
61 ± 3 |
Overall surface coverage BMP-2 |
35.5% |
28.3% |
2.6% |
Overall BMP-2 density (pmol cm−2) |
4.44 |
3.53 |
0.33 |
Local surface coverage BMP-2 |
35.5% |
100% |
100% |
Local BMP-2 density (amol μm−2) |
0.04 |
0.13 |
0.13 |
The obtained values for the percentage of differentiated cells can all be attributed to the differences in BMP-2 surface density. The values for the respective BMP-2 surface density were estimated (see Experimental section below) and are presented in Table 2. Overall density refers to the amount of BMP-2 molecules on the whole substrate; local density refers to the density of BMP-2 molecules in one pattern feature, i.e. per round feature or per dot (for detailed definition see Fig. 6 below). For “homogeneous” (therefore featureless) substrates, both densities are the same, because, in contrast to the spatially confined localisation of BMP-2 on the patterned substrates, the homogeneous substrates are assumed to have a random BMP-2 distribution.
 |
| Fig. 5 Frequency analysis for the values of cell differentiation, comparing the microcontact printed substrates (μCP) to the ones prepared with dip-pen nanolithography (DPN). | |
The lower percentage of cell differentiation found for DPN substrates in comparison to μCP substrates might be attributed to the different overall BMP-2 density, since the local density in one “pattern feature (round or dot)” of the array and the feature size are comparable. The only difference is the spacing between the features, leading to a smaller overall density and a decrease of the cell surface area stimulated by the BMP-2. Also, it has been shown in our group that by applying a BMP-2 surface concentration gradient, differences in cell differentiation are obtained. Differentiation values higher than 80% are obtained for overall BMP-2 surface concentrations of ≥2 pmol cm−2,18 being in accordance with the values reported here.
The lower percentage for cell differentiation on the homogeneous substrates (∼82%) when compared to the μCP substrates (∼91%) can most likely be attributed to the differences in local BMP-2 density. When administered in solution, it has been reported that the concentration of BMP-2 has an effect on the cell differentiation outcome.13 When immobilised on surfaces, BMP-2 surface density is also known to play an important role in stem cell differentiation.25 BMP-2 receptors naturally exist in the cell membrane in multiple forms of pre-assembled oligomers and monomers.26 BMP-2 surface immobilisation can lead to regions with high ligand local densities (like in the microcontact printed spots), which can improve dramatically the occupancy of BMP-2 receptors. Furthermore, surface immobilisation restricts BMP-2 diffusion and avoids its complete detachment from the receptor.27 Interaction of BMP-2 with a single receptor, in turn, can lead to receptor oligomerisation28 and thus increase the overall signalling. The percentage of cell differentiation for the microcontact printed substrates corresponds to what has been found for cell differentiation in solution (90%), leading to the conclusion that this type of substrates could replace cell experiments with BMP-2 in solution.
To further evaluate the differences among the values of cell differentiation for all substrates containing BMP-2, a frequency analysis was performed. The best result was obtained for DPN prepared substrates (see Fig. 5).
All cells identified as positive for differentiation are completely differentiated, being reflected in the cells having a green nucleus (as shown in the images of Fig. 5). This result may be related with a better performance of the DPN technique in terms of pattern homogeneity when compared to μCP.1
Conclusions
In conclusion, we have shown that mesopatterned substrates are suitable for cell differentiation experiments. μCP is a fast and reproducible patterning method for a total pattern area of around 1 cm2. These substrates are suitable to replace conventional experiments with BMP-2 in solution. On the other hand, DPN allows the facile and flexible variation of the pattern spacing, because it is a maskless technique. Even though cell differentiation for the substrates fabricated with DPN is not as high as reported for BMP-2 in solution, this approach is very promising and has a lot of potential as flexible platform for this kind of cell response studies. While patterns can be changed on the go without the need of fabricating new masters, the main argument often brought forward against using DPN for large area cell studies is the intrinsic limited area throughput. However, the presented study shows that adequate area sizes can be produced with reasonable expenditure of time thanks to the reduced dwell times enabled by the use of carrier inks.
Experimental
Estimating the BMP-2 surface density
The estimations started from the underlying biotin–thiol layer. It was assumed that both, the homogeneous (homo) and the microcontact printed (μCP) substrates have a monolayer of biotin–thiol. For the substrates fabricated with dip-pen nanolithography (DPN), prior calculations had to be done: in order to estimate the approximate quantity of deposited DOPC and biotin–thiol, the mean dot size for the arrays was determined as 4.01 ± 0.90 μm (mean dot area 53.20 ± 23.89 μm2; determined from 100 random dots in the array). Furthermore, a recently published work determined the mass transfer of DOPC doing dip-pen nanolithography.29 Following these calculations, we take into account that dot areas >65 μm2 have a mass transfer of 1.59 ± 0.10 pg ink per dot and dot areas <65 μm2 have a mass transfer of 0.08 ± 0.02 pg ink per dot, since the dots are bigger at the beginning of the array and get smaller during patterning because of ink loss (for the calculated dots, 72% are bigger than 65 μm2 and 28% smaller). The estimated number of molecules is therefore 2.48 × 10⁸ (for bigger dots) and 1.25 × 10⁷ (for smaller dots). Thus it can be deduced that for bigger dots 411.82 amol of biotin–thiol are deposited and for smaller dots 20.72 amol. These values are only estimated since the humidity during deposition varied and ranged from 35% to 55% and was therefore not fixed as for the work of Fuchs and co-workers.
Further combination of the obtained values for number of molecules deposited and dot areas obtained from the images leads to the estimation of biotin–thiol molecules per surface area: around 2.5 × 10⁶ molecules per μm2 for all dots, which corresponds to 4.1 amol μm−2 biotin–thiol (in more detail: 3.1 × 10⁵ molecules per μm2 for small droplets and 2.7 × 10⁶ molecules per μm2 for big droplets).
In order to be able to calculate if a monolayer of biotin–thiol was formed in the spots, the stearic acid molecule was chosen as approach. This comparison is based on the structural similarity which both molecules present due to their aliphatic chain and they should very likely arrange themselves in a similar way. If we estimate that one molecule of stearic acid (M = 284 g mol−1) occupies 21 Å2 (taken from ref. 30) we can calculate that there is a density of 4.76 × 10⁶ molecules μm−2 for the stearic acid. For the biotin–thiol, the values for large droplets correspond to a closed monolayer whereas the values for the smaller droplets correspond to a spaced-out monolayer.
Assuming furthermore, that even if there was no complete monolayer (substrates DPN), the size of the protein streptavidin (4.5 × 4.5 × 5.3 nm3)31 will be able to overcome possible “holes” in the monolayer. Since a sufficient amount of streptavidin was provided during incubation, the calculated values are based on a monolayer of streptavidin for all substrates.
We hypothesise that each molecule of streptavidin will bind 1 molecule of BMP-2 since their dimensions are very similar (BMP-2 (ref. 32): 7 × 3.5 × 2.5 nm3). Therefore, the density of BMP-2 depends only on the amount of BMP-2 provided during incubation. The local values indicate the density of BMP-2 on the pattern features. Since the homogeneous substrate does not have any areas where BMP-2 could not bind and a random but homogeneous distribution is assumed for the whole surface, the local and the overall densities are the same. The patterned substrates, on the other hand, exhibit regions without streptavidin (the passivated areas), where BMP-2 cannot bind. Therefore, the overall area for BMP-2 attachment is smaller. This area was calculated taking into account the pattern parameters and is reflected in the overall surface coverage of BMP-2. The resulting values for the overall density of BMP-2 show a decrease in the density from the substrates homo to μCP to DPN. An interesting point to highlight here is that the assembly of BMP-2 on the substrates homo is random, whereas on the substrates μCP and DPN, the assembly is guided by the pattern features and most accurately localised.
The terms local and overall density are also depicted in Fig. 6, whereas local density is indicated in red, referring to the density of BMP-2 molecules in 1 pattern feature (round or dot). Overall density refers to the amount of BMP-2 on the whole substrate. Since the homogeneous substrates (homo) don't have pattern features and the BMP-2 distribution is random, both densities are the same.
 |
| Fig. 6 Schematic figure representing the BMP-2 densities of the substrates homo, μCP and DPN. The red color indicates the local density of BMP-2. | |
Osterix as early differentiation marker
Quantification of osteogenic differentiation was performed by staining for a so called “early differentiation” marker. It has been reported that osterix (OSX) is induced rapidly in C2C12 cells by BMP-2 during the first 24 h of administration,33 making it an ideal candidate for fast assessment of cell differentiation. The quantification of OSX positive cells (i.e. cells starting to have differentiated towards osteoblasts) was based on the criteria defined by the group of Polak who reported that OSX was activated and translocated from the cell cytosol into the nucleus during preosteoblast stages of osteoblastic lineage differentiation.34 Therefore, all cells with a void nucleus are counted as negative and all cells with a homogeneous colouring or a pronounced green nucleus are counted as positive for differentiation towards the osteoblastic regime (see Fig. 7).
 |
| Fig. 7 Osterix staining of C2C12 myoblastic cells. The cell on the left side (A) shows an empty nucleus and is considered negative for differentiation. On the other hand, the cells on the right side are positive for differentiation because they are homogeneously green (B) or have a brighter green nucleus (C). The scale bars equal 25 μm. | |
Frequency analysis
A frequency analysis is based on the individual analysed images (at least 18 images per sample) and their respective differentiation rates. This means that each of the images taken into account are evaluated for their respective differentiation percentages and, in the case of 100% differentiation, classified as yes (100%) or no (<100%).
Acknowledgements
CIBER-BBN is an initiative funded by the VI National R&D&i Plan 2008–2011, Iniciativa Ingenio 2010, Consolider Program, CIBER Actions and financed by the Instituto de Salud Carlos III with assistance from the European Regional Development Fund. The Nanobioengineering group has support from the Commission for Universities and Research of the Department of Innovation, Universities, and Enterprise of the Generalitat de Catalunya (2009 SGR 505). This study was supported by “Fundación M. Botín”, Santander, Spain. Part of the work was carried out with support of the European Community. We appreciate the support of the European Research Infrastructure EUMINAfab (funded under the FP7 specific program Capacities, Grant Agreement Number 226460) and its partner at the Karlsruhe Institute of Technology (KIT). This work was partly carried out with the support of the Karlsruhe Nano Micro Facility (KNMF, www.kmf.kit.edu), a Helmholtz Research Infrastructure at Karlsruhe Institute of Technology (KIT, www.kit.edu). We thank Miriam Funes for technical help. The IRB group has support of CICYT (CTQ2012-30930) and Generalitat of Catalunya (2009SGR1024).
Notes and references
- J. Y. Lim and H. J. Donahue, Tissue Eng., 2007, 13, 1879 CrossRef CAS PubMed.
- K. Kolind, K. W. Leong, F. Besenbacher and M. Foss, Biomaterials, 2012, 33, 6626 CrossRef CAS PubMed.
- M. Théry, J. Cell Sci., 2010, 123, 4210 CrossRef PubMed.
- M. Arnold, E. A. Cavalcanti-Adam, R. Glass, J. Blümmel, W. Eck, M. Kantlehner, H. Kessler and J. P. Spatz, ChemPhysChem, 2004, 5, 383 CrossRef CAS PubMed.
-
(a) K. Y. Lee, E. Alsberg, S. Hsiong, W. Comisar, J. Linderman, R. Ziff and D. Mooney, Nano Lett., 2004, 4, 1501 CrossRef CAS PubMed;
(b) J. M. Curran, R. Chen, R. Stokes, E. Irvine, D. Graham, E. Gubbins, D. Delaney, N. Amro, R. Sanedrin, H. Jamil and J. A. Hunt, J. Mater. Sci.: Mater. Med., 2010, 21, 1021 CrossRef CAS PubMed;
(c) L. R. Giam, M. D. Massich, L. Hao, L. S. Wong, C. C. Mader and C. A. Mirkin, Proc. Natl. Acad. Sci. U. S. A., 2012, 109, 4377 CrossRef CAS PubMed.
- D. G. Thompson, E. O. McKenna, A. Pitt and D. Graham, Biosens. Bioelectron., 2011, 26, 4667 CrossRef CAS PubMed.
- C. S. Chen, J. L. Alonso, E. Ostuni, G. M. Whitesides and D. E. Ingber, Biochem. Biophys. Res. Commun., 2003, 307, 355 CrossRef CAS PubMed.
- G. Csucs, R. Michel, J. W. Lussi, M. Textor and G. Danuser, Biomaterials, 2003, 24, 1713 CrossRef CAS PubMed.
- M. Ventre, F. Causa and P. A. Netti, J. R. Soc., Interface, 2012, 9, 2017 CrossRef CAS PubMed.
-
(a) R. D. Piner, J. Zhu, F. Xu, S. Hong and C. A. Mirkin, Science, 1999, 283, 661 CrossRef CAS PubMed;
(b) E. J. Irvine, A. Hernandez-Santana, K. Faulds and D. Graham, Analyst, 2011, 136, 2925 RSC;
(c) C.-C. Wu, D. N. Reinhoudt, C. Otto, V. Subramaniam and A. H. Velders, Small, 2011, 7, 989 CrossRef CAS PubMed;
(d) S. Sekula-Neuner, J. Maier, E. Oppong, A. C. B. Cato, M. Hirtz and H. Fuchs, Small, 2012, 8, 585 CrossRef CAS PubMed.
-
(a) S. Sekula, J. Fuchs, S. Weg-Remers, P. Nagel, S. Schuppler, J. Fragala, N. Theilacker, M. Franzreb, C. Wingren, P. Ellmark, C. A. Borrebaeck, C. A. Mirkin, H. Fuchs and S. Lenhert, Small, 2008, 4, 1875 CrossRef PubMed;
(b) P. L. Stiles, Nat. Methods, 2010, 7, I CAS.
-
(a) C. S. Chen, M. Mrksich, S. Huang, G. M. Whitesides and D. E. Ingber, Science, 1997, 276, 1425 CrossRef CAS PubMed;
(b) A. Offenhäusser, S. Böcker-Meffert, T. Decker, R. Helpenstein, P. Gasteier, J. Groll, M. Möller, A. Reska, S. Schäfer, P. Schulte and A. Vogt-Eisele, Soft Matter, 2007, 3, 290 RSC;
(c) C.-J. Pan, H.-Y. Ding and Y.-X. Dong, Colloids Surf., B, 2013, 102, 730 CrossRef CAS PubMed;
(d) N. P. Westcott, W. Luo and M. Yousaf, J. Colloid Interface Sci., 2014, 430, 207 CrossRef CAS PubMed.
-
(a) J. van den Dolder, A. J. E. de Ruijter, P. H. M. Spauwen and J. A. Jansen, Biomaterials, 2003, 24, 1853 CrossRef CAS PubMed;
(b) I. Song, B. S. Kim, C.-S. Kim and G.-I. Im, Biochem. Biophys. Res. Commun., 2011, 408, 126 CrossRef CAS PubMed.
- E. Yamachika, H. Tsujigiwa, N. Shirasu, T. Ueno, Y. Sakata, L. Fukunaga, N. Mizukawa, M. Yamada and T. Sugahara, J. Biomed. Mater. Res., Part A, 2009, 88, 599 CrossRef PubMed.
- T. L. Pohl, J. H. Boergermann, G. K. Schwaerzer, P. Knaus and E. A. Cavalcanti-Adam, Acta Biomater., 2012, 8, 772 CrossRef CAS PubMed.
- Y. N. Zhao, J. Zhang, X. Wang, B. Chen, Z. F. Xiao, C. Y. Shi, Z. L. Wei, X. L. Hou, Q. B. Wang and J. W. Dai, J. Controlled Release, 2010, 141, 30 CrossRef CAS PubMed.
- A. Lagunas, J. Comelles, E. Martínez and J. Samitier, Langmuir, 2010, 26, 14154 CrossRef CAS PubMed.
- A. Lagunas, J. Comelles, S. Oberhansl, V. Hortigüela, E. Martínez and J. Samitier, Nanomedicine: Nanotechnology, Biology and Medicine, 2013, 9, 694 CrossRef CAS PubMed.
- E. Prats-Alfonso, F. Garcia-Martin, N. Bayo, L. J. Cruz, M. Pla-Roca, J. Samitier, A. Errachid and F. Albericio, Tetrahedron, 2006, 62, 6876 CrossRef CAS.
- S. Oberhansl, PhD thesis, University of Barcelona, Spain, October, 2012, pp. 153–155.
- R. Derda, L. Li, B. P. Orner, R. L. Lewis, J. A. Thomson and L. L. Kiessling, ACS Chem. Biol., 2007, 2, 347 CrossRef CAS PubMed.
- H. M. Ryoo, M. H. Lee and Y. J. Kim, Gene, 2006, 366, 51 CrossRef CAS PubMed.
- M. Lehnhert, M. Gorbahn, M. Klein, B. Al-Nawas, I. Köper, W. Knoll and M. Veith, J. Biomed. Mater. Res., Part A, 2012, 100, 388 CrossRef PubMed.
- T. Katagiri, A. Yamaguchi, M. Komaki, E. Abe, N. Takahashi, T. Ikeda, V. Rosen, J. M. Wozeny, A. Fujisawa-Sehara and T. Suda, J. Cell Biol., 1994, 127, 1755 CrossRef CAS PubMed.
- W. Luo, E. W. L. Chan and M. N. Yousaf, J. Am. Chem. Soc., 2010, 132, 2614 CrossRef CAS PubMed.
- K. Heinecke, A. Seher, W. Schmitz, T. D. Mueller, W. Sebald and J. Nickel, BMC Biol., 2009, 7, 59 CrossRef PubMed.
- T. Crouzier, L. Fourel, T. Boudou, C. Albigès-Rizo and C. Picart, Adv. Mater., 2011, 23, H111 CrossRef CAS PubMed.
- T. Kirsch, J. Nickel and W. Sebald, EMBO J., 2000, 19, 3314 CrossRef CAS PubMed.
- S. Biswas, M. Hirtz and H. Fuchs, Small, 2011, 7, 2081 CrossRef CAS PubMed.
- Taken from http://www.philasim.org/newmanual/exp21.pdf, accessed, July 2012.
- W. Knoll, M. Zizelsperger, T. Liebermann, S. Arnold, A. Badia, M. Liley, D. Piscevic, F.-J. Schmitt and J. Spinke, Colloids Surf., A, 2000, 161, 115 CrossRef CAS.
- M. Laub, T. Seul, E. Schmachtenberg and H. P. Jennissen, Mater. Sci. Eng., 2001, 32, 926 CAS.
- M. Hayashi, S. Maeda, H. Aburatani, K. Kitamura, H. Miyoshi, K. Miyazono and T. Imamura, J. Biol. Chem., 2008, 283, 565 CrossRef CAS PubMed.
- G. Tai, I. Christodoulou, A. E. Bishop and J. M. Polak, Biochem. Biophys. Res. Commun., 2005, 333, 1116 CrossRef CAS PubMed.
Footnote |
† Electronic supplementary information (ESI) available: Materials and methods, surface functionalisation protocols, cell culture protocol and in-detail fabrication process of DPN patterned substrates. See DOI: 10.1039/c4ra10311d |
|
This journal is © The Royal Society of Chemistry 2014 |
Click here to see how this site uses Cookies. View our privacy policy here.