Ni-doped ZnO nanotower arrays with enhanced optical and field emission properties
Yu-Cheng Chang*
Department of Materials Science and Engineering, Feng Chia University, No. 100, Wenhwa Rd., Seatwen, Taichung 40724, Taiwan. E-mail: ychang0127@gmail.com; Fax: +886-4-24510014; Tel: +886-4-24517250 ext. 5348
First published on 23rd October 2014
Abstract
Aligned Ni-doped ZnO nanotower arrays have been grown on a silicon substrate with a ZnO film by a thermal evaporation method. The source temperature was exploited to control the morphologies of ZnO nanostructures. The Ni-doped ZnO nanotower arrays exhibit very strong and sharp ultraviolet emissions from the band gap, while almost no green emission is attributed to singly ionized oxygen vacancies in the cathodoluminescence spectrum. The Ni-doped ZnO nanotower arrays with large alignment variation display broadband and omnidirectional antireflection properties due to the gradual index profile. In addition, Ni-doped ZnO nanotower arrays have good geometric structures and appropriate density for field emission, which led to very low turn-on and threshold fields. The present work can provide insight into further structural design for nanostructured optical and electrical applications.
Introduction
Zinc oxide (ZnO) is one of the most important and versatile semiconductors for optoelectronics and piezoelectricity effects because of its wide direct band-gap (3.37 eV), large exciton binding energy (60 meV), and non-centrosymmetric structure.1–3 It has been extensively used in several industrial products, such as ceramics, rubber additives, pigments, and medicines.4–7 One-dimensional ZnO nanostructures have great potential applications in ultraviolet (UV) lasers,8,9 light-emitting diodes (LED),10–12 photonic crystals,13,14 chemical sensors,15,16 field emission transistors (FET),17–19 field emission (FE) devices,20,21 piezoelectric nanogeneators,22–24 and solar cells.25,26Various physical and chemical routes, such as molecular beam epitaxy (MBE),27 pulsed laser deposition,28,29 thermal evaporation,30–33 and wet chemical methods34–37 have been used to prepare a wide range of ZnO nanostructures. Among them, thermal evaporation is the one most commonly employed in investigation of oxide nanostructures. Recently, there have been extensive reports on the fabrication of different ZnO nanostructures by thermal evaporation method, such as nanorods,38–41 nanowires,8,23 nanobelts,42 nanoneedles,43 nanosprings,44 and nanohelices.45 For thermal evaporation method, the vapor–liquid–solid (VLS) process has been widely adapted as the mechanism for growing one-dimensional structures, such as nanorods,38,40 nanobelts,42 and nanowires.8,23 In general, this process is important to choose an appropriate catalyst and synthesis temperature so that there is a coexistence of liquid alloy and solid nanostructure materials.46 For the disadvantage of VLS route, the catalyst often diffuses into the ZnO matrix during growth, creating deep traps within the band gap.47 On the other hand, the vapor–solid (VS) route exhibits no catalyst to be more versatile.48 The growth mechanism of VS can be quite complex and often involves with several factor, such as intrinsic surface polarity, defect propagation, surface-dependent oxidation, and orientation-dependent growth speed.49,50 Recently, the VS mechanism has been widely used to grow many kinds of ZnO architectures and hierarchical nanostructures.51–53 However, there are fewer reports about the growth of metal doped ZnO nanostructures by VS routes.
Dilute magnetic semiconductors (DMSs) are obtained by the incorporation of rare earth or transition metal ion into the core of semiconductor materials, have attracted much attention for spintronic devices.32,47,54 Among them, ZnO-based DMSs have received considerable attention due to their outstanding optical and electrical properties.33 Especially, Ni-doped ZnO nanostructures are very promising materials for spintronic devices operating at room temperature.32 In addition, ZnO compound can be easily substituted by Ni2+, which is attributed to the ion radius of Ni2+ smaller than Zn2+.33 Recently, the different morphologies of Ni-doped ZnO nanostructures have widely been reported, such as nanoparticles, nanocombs, and nanowires.33,55,56 However, there are no reports about the growth of Ni-doped ZnO nanotower arrays. Furthermore, the vertically alignment and sharp tip of Ni-doped ZnO nanotower arrays can be beneficial for antireflection and field emission properties.
The present study uses an appropriate reaction condition in conjunction with thermal evaporation to grow Ni-doped ZnO nanotower arrays. The ZnO film plays a crucial role in determining the alignment of ZnO nanostructures. The Ni-doped ZnO nanotower arrays exhibit a very strong in UV emissions and almost no green emissions attributed to singly ionized oxygen vacancies. In addition, the Ni-doped ZnO nanotower arrays have good geometric structures for antireflection coatings, which display broadband reflection suppression from 400 to 1950 nm. Low turn-on and threshold fields indicate that Ni-doped ZnO nanotower arrays are promising for applications in FE devices. The superior ultraviolet emission, antireflection, and field emission properties indicate that Ni-doped ZnO nanotower arrays are promising for the application in optical and field emission devices.
Experimental
Synthesis
The Ni-doped ZnO nanotower arrays were grown on n-type Si [001] wafer with thin ZnO film on the top by using a thermal evaporation method without growth catalysts in a two-zone furnace. A thin film of zinc acetate was then coated on the substrate by spinning a layer of 20 mM zinc acetate dihydrate (98%, Aldrich) in ethanol; this process was repeated 10 times. 10–20 nm thick ZnO film was produced after annealing at 350 °C in air for 30 min. A mixture of ZnO powder and graphite powder with a weight ratio of 2![[thin space (1/6-em)]](https://www.rsc.org/images/entities/char_2009.gif) :
:![[thin space (1/6-em)]](https://www.rsc.org/images/entities/char_2009.gif) 1 was used as source, and appropriate amounts of nickel chloride (98%, Aldrich) were used as the dopant source. The ZnO/C sources were placed on an alumina boat and positioned in the high temperature zone of the furnace. The dopant source (nickel chloride) was also placed on an alumina boat and set a fixed distance upstream from the source (ZnO/C) boat. In addition, ZnO-coated Si substrate was set to a fixed distance downstream from the source (ZnO/C) boat. The furnace pumped to a pressure of 1.2 × 10⁻² Torr. A mixture of 100 sccm Ar and 10 sccm O2 was used as carrier gas. The different source temperatures and the furnace system were kept at 0.6–1 Torr for 90 min.
1 was used as source, and appropriate amounts of nickel chloride (98%, Aldrich) were used as the dopant source. The ZnO/C sources were placed on an alumina boat and positioned in the high temperature zone of the furnace. The dopant source (nickel chloride) was also placed on an alumina boat and set a fixed distance upstream from the source (ZnO/C) boat. In addition, ZnO-coated Si substrate was set to a fixed distance downstream from the source (ZnO/C) boat. The furnace pumped to a pressure of 1.2 × 10⁻² Torr. A mixture of 100 sccm Ar and 10 sccm O2 was used as carrier gas. The different source temperatures and the furnace system were kept at 0.6–1 Torr for 90 min.
Characterization
The morphology of nanostructures was examined with a field emission scanning electron microscope (FESEM) using a JEOL JSM-6500F SEM operating at 10 kV accelerating voltage. The density of ZnO nanostructures were calculated from top-view SEM images. A JEOL-2010 transmission electron microscope (TEM) operating at 200 kV was used to examine the microstructures. The crystalline phase of the ZnO nanostructures was determined using the X-ray powder diffraction method (Shimadzu XRD-6000, CuKα1 radiation (λ = 0.1505 nm)). The cathodoluminescence (CL) spectra were acquired with an electron probe microanalyzer (Shimadzu EPMA-1500) attached to a SEM. CL spectra were accumulated in a single shot mode within an exposure rate of 1 nm s−1. All the CL spectra were taken at room temperature. The reflection spectra were obtained with a Hitachi Model U-4100 spectrophotometer. A Keithley 237 source-measurement unit was used to obtain the current–voltage (I–V) and field emission characteristics. The field emission measurements were carried out in a vacuum chamber with a pressure of 1 × 10⁻⁶ Torr at room temperature. A copper electrode probe used as an anode with an area of 3.3 × 10⁻³ cm2 was placed at the different distance from the tips of the nanostructures and was adjusted by a precision screw meter with an accuracy of ±0.1 μm.Results and discussion
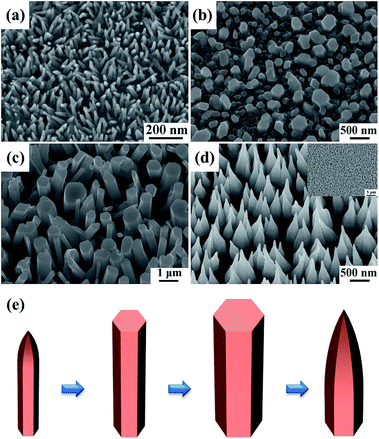
Fig. 1 show 20° tilt-view SEM images of Ni-doped ZnO nanostructures were grown on the silicon substrates with ZnO film at the different source (ZnO/C) temperature by a thermal evaporation method. The source temperatures are 950, 1000, 1050, and 1100 °C, respectively. The weight ratio of source and dopant source (nickel chloride) was fixed in 6![[thin space (1/6-em)]](https://www.rsc.org/images/entities/char_2009.gif) :
:![[thin space (1/6-em)]](https://www.rsc.org/images/entities/char_2009.gif) 1. The substrates were covered with ZnO film prepared with a total growth time of 90 min. The variation of source temperature was found to affect the morphology of Ni-doped ZnO nanostructures. Ni-doped ZnO nanoneedle arrays were grown at the source temperature of 950 °C, as shown in Fig. 1a. The average diameter and density of Ni-doped ZnO nanoneedles are 31.8 nm and 3.1 × 1010 cm−2, respectively. Fig. 1b shows a 20° tilt-view SEM image depicting the Ni-doped ZnO nanorod arrays grown at the source temperature of 1000 °C. The average diameter and density of Ni-doped ZnO nanorod arrays are 167.5 nm and 3.6 × 109 cm−2, respectively. With increasing at the source temperature of 1050 °C, the average diameter and density of Ni-doped ZnO submicrorod arrays are 439.3 nm and 1.1 × 108 cm−2, respectively, as shown in Fig. 1c. The sizes of Ni-doped ZnO nanostructures are progressively increasing with the source temperature. In addition, the density of Ni-doped ZnO nanostructures varied with reverse tendency. At the source temperature of 1100 °C, the Ni-doped and tapered ZnO nanostructures, herein in call nanotowers, are formed, as shown in Fig. 1d. The average diameter and density of Ni-doped ZnO nanotower arrays are 268.4 nm and 5.1 × 108 cm−2, respectively. The inset is a low magnification SEM image depicting aligned and regular ZnO nanotower arrays in large scale. Fig. 1e shows schematic diagrams illustrating the variation in the morphology with the source temperature. On the other hand, the varied source temperature are useful in controlling grow the different morphologies of Ni-doped ZnO nanostructures, such as, nanoneedles, nanorods, submicrorods, and nanotowers.
1. The substrates were covered with ZnO film prepared with a total growth time of 90 min. The variation of source temperature was found to affect the morphology of Ni-doped ZnO nanostructures. Ni-doped ZnO nanoneedle arrays were grown at the source temperature of 950 °C, as shown in Fig. 1a. The average diameter and density of Ni-doped ZnO nanoneedles are 31.8 nm and 3.1 × 1010 cm−2, respectively. Fig. 1b shows a 20° tilt-view SEM image depicting the Ni-doped ZnO nanorod arrays grown at the source temperature of 1000 °C. The average diameter and density of Ni-doped ZnO nanorod arrays are 167.5 nm and 3.6 × 109 cm−2, respectively. With increasing at the source temperature of 1050 °C, the average diameter and density of Ni-doped ZnO submicrorod arrays are 439.3 nm and 1.1 × 108 cm−2, respectively, as shown in Fig. 1c. The sizes of Ni-doped ZnO nanostructures are progressively increasing with the source temperature. In addition, the density of Ni-doped ZnO nanostructures varied with reverse tendency. At the source temperature of 1100 °C, the Ni-doped and tapered ZnO nanostructures, herein in call nanotowers, are formed, as shown in Fig. 1d. The average diameter and density of Ni-doped ZnO nanotower arrays are 268.4 nm and 5.1 × 108 cm−2, respectively. The inset is a low magnification SEM image depicting aligned and regular ZnO nanotower arrays in large scale. Fig. 1e shows schematic diagrams illustrating the variation in the morphology with the source temperature. On the other hand, the varied source temperature are useful in controlling grow the different morphologies of Ni-doped ZnO nanostructures, such as, nanoneedles, nanorods, submicrorods, and nanotowers.
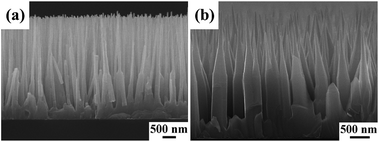
In our previous work, the ZnO seed layer facilitated the growth of aligned nanorod arrays by a wet chemical method. In our optimized procedure, a substrate is spin-coated 5 mM zinc acetate dihydrate in ethanol for ten times. This substrate is covered with a film of zinc acetate and heated to 350 °C in air for 30 min to yield layers of ZnO seeds with their (0001) planes parallel to the substrate surface. Although the ZnO seed layer have been extensively investigated to grow the vertically aligned ZnO nanostructures by a wet chemical method, such as nanorods, nanowires, and nanoneedles.57,58 This strategy has not been used for the preparation and systematic control of large arrays of oriented nanostructures by a thermal evaporation method. In order to improve thin ZnO seed layer, high concentration (20 mM) zinc acetate dihydrate were used to prepare more thick and uniform ZnO film for the epitaxial growth of ZnO nanostructures by a thermal evaporation method. Fig. 2a shows a cross-section view SEM image depicting vertical alignment ZnO nanowire arrays were grown from no dopant source (nickel chloride) at the source temperature of 1100 °C. The average length and density of ZnO nanowire arrays are 4.3 μm and 1.9 × 109 cm−2, respectively. The average diameter of nanowires is 82 nm. For the same reaction condition with dopant source, the morphology is changed from nanowires to nanotowers, as shown in Fig. 2b. The average length of Ni-doped ZnO nanotower arrays are 3.4 μm. In addition, the ZnO nanowires and nanotowers with sharp tips are attributed to the rapid evaporation of source at the higher temperature. It is significant that the presence of dopant source not only influences the growth of morphology of ZnO, but also efficiently changes the dimension and density.
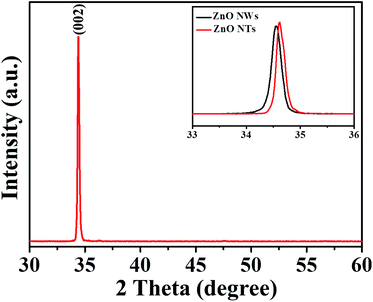
Fig. 3 shows the XRD pattern of Ni-doped ZnO nanotower arrays (Fig. 1d) grown on the silicon substrates with ZnO film. A strong and sharp diffraction peak corresponding to the [002] crystal plane of ZnO indicates that the preferred growth direction of the ZnO nanotower arrays is in the [001] direction. No peaks of impurities were observed, indicating that the product is a pure phase compound. As shown in the inset of Fig. 3, the [002] peak of the Ni-doped ZnO nanotower arrays show a clear shift of 0.06° to the right compared to the pure ZnO nanowire arrays (Fig. 2a), which agrees with previous studies. The shrinkage of lattice constants after doping is due to the substitution of Zn2+ (0.06 nm) by smaller Ni2+ (0.055 nm).54
Fig. 4a shows a TEM image of a Ni-doped ZnO nanotower (in Fig. 1d) with a length of 2881 nm and a tip diameter of about 12 nm. The high-resolution TEM image taken from part of an individual nanotower and the corresponding selected area electron diffraction (SAED) pattern are shown in Fig. 4b and c, respectively, and displays a (010) zone-axis SAED pattern. Both the TEM image and diffraction pattern indicate that the nanotower is single-crystalline and grown in [001] direction. This result is the same with above XRD pattern. The chemical composition of the nanotower was analyzed by energy-dispersive spectroscopy (EDS). The EDS spectrum (Fig. 4d) reveals the composition of Ni-doped ZnO nanotower with Zn, Ni, and O (Cu is from the TEM grid) is present in the different position of nanotower. These results confirm that the ZnO nanotower arrays have been doped by Ni. The composition of Ni of nanotower was indeed found to significant decrease from bottom to top, as shown in Fig. 4e. It was anticipated that the composition gradient would develop with reaction since dopant source was continuously depleted by reaction process. In order to improve the low doping concentration of Ni, high weight ratio (3![[thin space (1/6-em)]](https://www.rsc.org/images/entities/char_2009.gif) :
:![[thin space (1/6-em)]](https://www.rsc.org/images/entities/char_2009.gif) 1) of source and dopant source (nickel chloride) were used to grow Ni-doped ZnO nanostructures. In this case, the SEM image (not shown) cannot obtain any ZnO nanostructures and ZnO film on this silicon substrate. The result is attributed to excessive nickel chloride shall be not only restrained the growth of ZnO nanostructures, but also etched the ZnO film on this silicon substrate. On the other hand, appropriate weight ratio of source and dopant source are conducive to grow Ni-doped ZnO nanotower arrays.
1) of source and dopant source (nickel chloride) were used to grow Ni-doped ZnO nanostructures. In this case, the SEM image (not shown) cannot obtain any ZnO nanostructures and ZnO film on this silicon substrate. The result is attributed to excessive nickel chloride shall be not only restrained the growth of ZnO nanostructures, but also etched the ZnO film on this silicon substrate. On the other hand, appropriate weight ratio of source and dopant source are conducive to grow Ni-doped ZnO nanotower arrays.
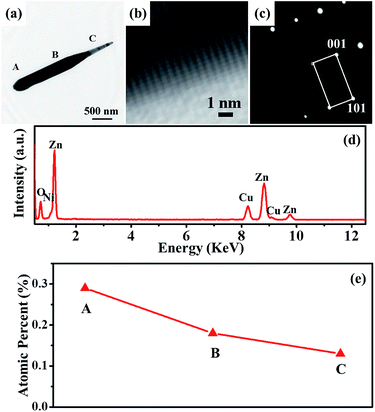 | ||
| Fig. 4 (a) TEM image shows a Ni-doped ZnO nanotower in Fig. 1d. (b) HRTEM and (c) SAED pattern confirming the single-crystallinity of the nanotower in (a). (d) The EDS spectrum of ZnO nanotower. (e) Plot showing the concentration of Ni at the different position of nanotower. | ||
If ZnO film changed to Au NPs, the ZnO nanostructures appeared to be complicate and random orientation. Fig. 5a and b show the low and high magnification SEM images of Ni-doped ZnO nanostructures grown on the silicon substrates with self-assembled Au NPs at 1100 °C by a thermal evaporation method. The well-disperse Au NPs can be effectively self-assembled on a 3-aminopropyltrimethoxysilane (APTMS)-modified silicon substrate for catalyst growth of single crystal Si nanowires.59 From the SEM images, the ZnO nanotowers are only grown on the ZnO nanowires. In previous work, the suitable substrate (such as single-crystal Al2O3 substrate) and Au NPs are beneficial to grow well-aligned ZnO nanowire arrays by VLS and epitaxial growth process. Herein, the Au NPs and silicon [001] wafer cannot provide epitaxial growth of well-aligned ZnO nanotower arrays. In addition, the sizes of Ni-doped ZnO nanostructures are similar to above results progressively increased with the source temperature and only obtained ZnO nanotowers at the source temperature of 1100 °C. Fig. 5c shows a TEM image of a Ni-doped ZnO nanotower (in Fig. 5a) with a length of 1267 nm and a tip diameter of about 9 nm. The high-resolution TEM image taken from part of an individual nanotower and the corresponding selected area electron diffraction (SAED) pattern are shown in Fig. 5d and e, respectively, and displays a (010) zone-axis SAED pattern. Both the TEM image and diffraction pattern indicate that the nanotower is also single-crystalline and grown in [001] direction. The EDS spectrum and Ni composition profile for nanotower are the similar to about results.
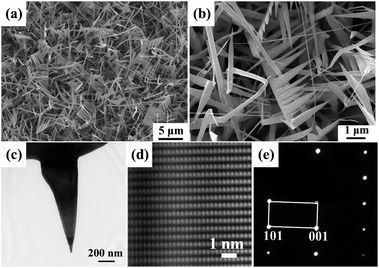 | ||
| Fig. 5 The (a) low and (b) high magnification SEM images of Ni-doped ZnO nanostructures grown on the silicon substrates with self-assembled Au NPs at the source temperature of 1100 °C. (c) TEM image of a nanotower in Fig. 5a. (d) HRTEM and (e) SAED pattern confirming the single-crystallinity of the nanotower in (c). | ||
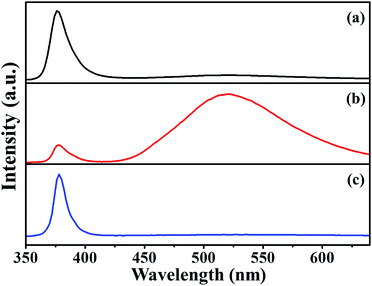
Cathodoluminescence is a useful technique for characterizing the optical properties of nanostructures. Since CL uses an electron beam for excitation, it is feasible to excite only a single or a small group of nanostructures. All the CL spectra were taken at room temperature for the area of 10 μm × 10 μm. The ZnO nanorod arrays were grown on the ZnO-coated Si substrate at the source temperature of 1000 °C, as shown in Fig. 6a. The stronger UV emission is at about 377 nm (3.29 eV), which comes from a recombination of excitons and a very weak green emission at about 522 nm. Fig. 6b represents the ZnO submicrorod arrays grown on the ZnO-coated Si substrate at the source temperature of 1050 °C. For the submicrorod arrays, the weak UV emission is at about 378 nm (3.28 eV), which comes from a recombination of excitons and a very strong green emission at about 520 nm. Accompanying with the increase in the sizes of ZnO structures, the green emission exhibit the same tendency. This result is consistent with the currently accepted model that the green emission arises from the recombination between holes trapped at the surface defect and electrons trapped at the oxygen vacancy.57 The large sizes of ZnO submicrorods may induce the formation of surface defects and influence the optical emission. For ZnO nanotower arrays, a strong UV emission is at 378 nm (3.28 eV) and no defect emission, as shown in Fig. 6c. In contrast to previous reports, ZnO nanotower arrays exhibit a stronger UV emission from band gap, which is attributed to their smooth-surfaced and high crystal quality.60,61 In addition, the present work used VS growth method to avoid catalyst creating deep traps within the band gap, which would lead to the formation of the oxide vacancies. The present mild processing conditions apparently favor the growth of ZnO nanotower arrays with high enhancement UV emission.
Antireflection coating layers play an important role in enhancing the efficiency of photovoltaic devices by increasing the light coupled into the region of the absorber layers.62 Recently, ZnO nanostructures have been become suitable for forming efficient antireflection coating, due to their good transparency, appropriative refractive index, and feasible fabrication process.26,63 To investigate the antireflective characteristic of ZnO nanostructures over the broad range of wavelengths, the present work used the specular reflection over a wavelength from 350–1950 nm, as shown in Fig. 7. The incident angle was fixed at 5° relative to the normal of samples in the measurement. Comparisons of the reflectance of Si, ZnO film, ZnO nanorod, and nanotower arrays reveal the importance of morphology on antireflection coating layer performance. ZnO nanorod and nanotower arrays exhibited significantly lower reflectance spectra compared with Si and ZnO film in the large range of wavelength. The morphology of ZnO nanotower arrays with sharp tip exhibit a gradual decrease of refractive index from the surface of Si substrate to the ambient air, resulting in the best antireflection property. The broadband antireflection characteristics are generally correlated with graded refractive index profile. In addition, the little bumps at 890 nm on the curve come from the detector change during the data collection of the equipment. The ZnO nanotower arrays with the broadband and omnidirectional antireflection coatings can benefit greatly the performance of optical and electric devices, such as light-emitting diodes and photovoltaics.
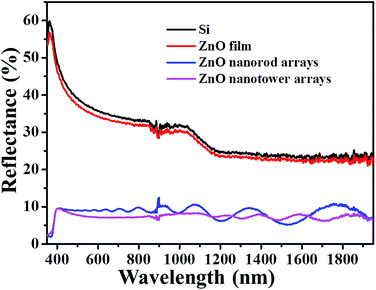 | ||
| Fig. 7 The reflection spectra of the different ZnO nanostructures were grown on the silicon substrates. | ||
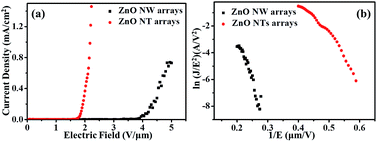
In general, one-dimensional ZnO nanostructures are potentially good field emitters because of their favorable aspect ratios and suitable work functions. The FE properties can be influenced by many parameters, such as the size, curvature, uniformity, and density of emitter. The measured field emission current density as a function of the electric field is shown in Fig. 8a. Turn-on electric fields were obtained at an emission current density of 0.1 μA cm−2. The turn-on fields for nanowires (Fig. 2a) and nanotowers (Fig. 2b) were found to be 3.25 and 1.53 V μm−1. At the emission current density of 0.1 mA cm−2, the threshold field of nanopagodas and ultra-sharp nanopagodas are 4.25 and 1.88 V μm−1, respectively. The nanotower arrays possess predominant field emission properties with lower turn-on field and threshold field.
The Fowler–Nordheim (FN) plot was used to obtain the field enhancement factors of nanowires and nanotowers, as shown in Fig. 8b. Fitting the measured data with the following relationship:
| ln(J/E2) = (−Bφ3/2/β)(1/E) + ln(Aβ2/φ) | (1) |
Conclusions
Aligned and Ni-doped ZnO nanotowers have been synthesized on the previously grown ZnO film on Si wafer using a facile thermal evaporation method. The appropriate source temperature plays an important role in growing the Ni-doped ZnO nanotower arrays. The ZnO nanotower arrays exhibited a significantly strong and sharp UV emission with almost no green emission, which is attributed to singly ionized oxygen vacancies. The sharp tip of ZnO nanotower arrays provided excellent impedance matching between Si and air through a gradual reduction of the effective refractive index away from the surface, resulting superior antireflection property over a large range of wavelengths. Low turn-on and threshold field indicate that lower density and sharper tip of ZnO nanotowers are promising for the application in field emission microelectronic devices. The ZnO nanotower arrays shall be very useful in fabricating novel devices, such as field emitters, ultraviolet laser, and solar cells.Acknowledgements
This study was supported financially by the National Science Council Taiwan (NSC 102-2218-E-035-009).References
- U. Ozgur, Y. I. Alivov, C. Liu, A. Teke, M. A. Reshchikov, S. Dogan, V. Avrutin, S. J. Cho and H. Morkoc, J. Appl. Phys., 2005, 98, 041301 CrossRef.
- Z. Fan and J. G. Lu, J. Nanosci. Nanotechnol., 2005, 5, 1561–1573 CrossRef CAS PubMed.
- Z. L. Wang, Mater. Today, 2004, 7, 26–33 CrossRef CAS.
- W. I. Lee and R. L. Young, Appl. Phys. Lett., 1996, 69, 526–528 CrossRef CAS.
- K. G. Hendrikse, W. J. McGill, J. Reedijk and P. J. Nieuwenhuizen, J. Appl. Polym. Sci., 2000, 78, 2290–2301 CrossRef CAS.
- K. G. Hendrikse and W. J. McGill, J. Appl. Polym. Sci., 2000, 78, 2302–2310 CrossRef CAS.
- S. C. Pillai, J. M. Kelly, D. E. McCormack, P. O'Brien and R. Ramesh, J. Mater. Chem., 2003, 13, 2586–2590 RSC.
- M. H. Huang, S. Mao, H. Feick, H. Yan, Y. Wu, H. Kind, E. Weber, R. Russo and P. Yang, Science, 2001, 292, 1897–1899 CrossRef CAS PubMed.
- H. Zhou, M. Wissinger, J. Fallert, R. Hauschild, F. Stelzl, C. Klingshirn and H. Kalt, Appl. Phys. Lett., 2007, 91, 181112–181113 CrossRef.
- M.-T. Chen, M.-P. Lu, Y.-J. Wu, J. Song, C.-Y. Lee, M.-Y. Lu, Y.-C. Chang, L.-J. Chou, Z. L. Wang and L.-J. Chen, Nano Lett., 2010, 10, 4387–4393 CrossRef CAS PubMed.
- R. Könenkamp, R. C. Word and M. Godinez, Nano Lett., 2005, 5, 2005–2008 CrossRef PubMed.
- X. Tang, G. Li and S. Zhou, Nano Lett., 2013, 13, 5046–5050 CrossRef CAS PubMed.
- X. D. Wang, C. Neff, E. Graugnard, Y. Ding, J. S. King, L. A. Pranger, R. Tannenbaum, Z. L. Wang and C. J. Summers, Adv. Mater., 2005, 17, 2103–2106 CrossRef CAS.
- Y.-C. Chang, H.-W. Wu, H.-L. Chen, W.-Y. Wang and L.-J. Chen, J. Phys. Chem. C, 2009, 113, 14778–14782 CAS.
- P. Jae Young, S. Dong Eon and K. Sang Sub, Nanotechnology, 2008, 19, 105503 CrossRef PubMed.
- G. N. Dar, A. Umar, S. A. Zaidi, S. Baskoutas, S. W. Hwang, M. Abaker, A. Al-Hajry and S. A. Al-Sayari, Talanta, 2012, 89, 155–161 CrossRef CAS PubMed.
- P.-C. Chang, Z. Fan, C.-J. Chien, D. Stichtenoth, C. Ronning and J. G. Lu, Appl. Phys. Lett., 2006, 89, 263102 CrossRef.
- N. A. Andrey and P. S. Igor, J. Phys. D: Appl. Phys., 2010, 43, 315104 CrossRef.
- H. Wu, D. Lin, R. Zhang and W. Pan, J. Am. Ceram. Soc., 2008, 91, 656–659 CrossRef CAS.
- C.-H. Chen, S.-J. Chang, S.-P. Chang, Y.-C. Tsai, I. C. Chen, T.-J. Hsueh and C.-L. Hsu, Chem. Phys. Lett., 2010, 490, 176–179 CrossRef CAS.
- X. D. Wang, J. Zhou, C. S. Lao, J. H. Song, N. S. Xu and Z. L. Wang, Adv. Mater., 2007, 19, 1627–1631 CrossRef CAS.
- M.-P. Lu, J. Song, M.-Y. Lu, M.-T. Chen, Y. Gao, L.-J. Chen and Z. L. Wang, Nano Lett., 2009, 9, 1223–1227 CrossRef CAS PubMed.
- Z. L. Wang and J. Song, Science, 2006, 312, 242–246 CrossRef CAS PubMed.
- P. Fei, P.-H. Yeh, J. Zhou, S. Xu, Y. Gao, J. Song, Y. Gu, Y. Huang and Z. L. Wang, Nano Lett., 2009, 9, 3435–3439 CrossRef CAS PubMed.
- X. Zhang, X. Huang, C. Li and H. Jiang, Adv. Mater., 2013, 25, 4093–4096 CrossRef CAS PubMed.
- Y.-J. Lee, D. S. Ruby, D. W. Peters, B. B. McKenzie and J. W. P. Hsu, Nano Lett., 2008, 8, 1501–1505 CrossRef CAS PubMed.
- D. C. Look, D. C. Reynolds, C. W. Litton, R. L. Jones, D. B. Eason and G. Cantwell, Appl. Phys. Lett., 2002, 81, 1830–1832 CrossRef CAS.
- X. W. Sun and H. S. Kwok, J. Appl. Phys., 1999, 86, 408–411 CrossRef CAS.
- E. M. Kaidashev, M. Lorenz, H. Von Wenckstern, A. Rahm, H. C. Semmelhack, K. H. Han, G. Benndorf, C. Bundesmann, H. Hochmuth and M. Grundmann, Appl. Phys. Lett., 2003, 82, 3901–3903 CrossRef CAS.
- W. Zhong Lin, J. Phys.: Conf. Ser., 2006, 26, 1 CrossRef.
- W. L. Hughes and Z. L. Wang, J. Am. Chem. Soc., 2004, 126, 6703–6709 CrossRef CAS PubMed.
- B. Zhang, X.-T. Zhang, H.-C. Gong, Z.-S. Wu, S.-M. Zhou and Z.-L. Du, Phys. Lett. A, 2008, 372, 2300–2303 CrossRef CAS.
- Z. ShaoMin, Y. HongLei, L. LiSheng, C. XiLiang, L. ShiYun, H. YaoMing, Y. RuiJian and L. Ning, Nanoscale Res. Lett., 2010, 5, 1284–1288 CrossRef PubMed.
- S. Xu and Z. Wang, Nano Res., 2011, 4, 1013–1098 CrossRef CAS.
- L. E. Greene, B. D. Yuhas, M. Law, D. Zitoun and P. Yang, Inorg. Chem., 2006, 45, 7535–7543 CrossRef CAS PubMed.
- Z. R. Tian, J. A. Voigt, J. Liu, B. McKenzie, M. J. McDermott, M. A. Rodriguez, H. Konishi and H. Xu, Nat. Mater., 2003, 2, 821–826 CrossRef CAS PubMed.
- Y. Tak and K. Yong, J. Phys. Chem. B, 2005, 109, 19263–19269 CrossRef CAS PubMed.
- W. I. Park, D. H. Kim, S. W. Jung and G.-C. Yi, Appl. Phys. Lett., 2002, 80, 4232–4234 CrossRef CAS.
- D. Calestani, M. Z. Zha, L. Zanotti, M. Villani and A. Zappettini, CrystEngComm, 2011, 13, 1707–1712 RSC.
- T. Nguyen, N. T. Tuan, V. D. Nguyen, N. D. Cuong, N. D. T. Kien, P. T. Huy, V. H. Nguyen and D. H. Nguyen, J. Lumin., 2014, 156, 199–204 CrossRef CAS.
- A. Umar, S. H. Kim, E. K. Suh and Y. B. Hahn, Chem. Phys. Lett., 2007, 440, 110–115 CrossRef CAS.
- X. Y. Kong and Z. L. Wang, Appl. Phys. Lett., 2004, 84, 975–977 CrossRef CAS.
- H. Z. Zhang, R. M. Wang and Y. W. Zhu, J. Appl. Phys., 2004, 96, 624–628 CrossRef CAS.
- P. X. Gao and Z. L. Wang, Small, 2005, 1, 945–949 CrossRef CAS PubMed.
- P. X. Gao, W. Mai and Z. L. Wang, Nano Lett., 2006, 6, 2536–2543 CrossRef CAS PubMed.
- J. Hu, T. W. Odom and C. M. Lieber, Acc. Chem. Res., 1999, 32, 435–445 CrossRef CAS.
- Z. Zhang, J. B. Yi, J. Ding, L. M. Wong, H. L. Seng, S. J. Wang, J. G. Tao, G. P. Li, G. Z. Xing, T. C. Sum, C. H. Alfred Huan and T. Wu, J. Phys. Chem. C, 2008, 112, 9579–9585 CAS.
- Y. Xia, P. Yang, Y. Sun, Y. Wu, B. Mayers, B. Gates, Y. Yin, F. Kim and H. Yan, Adv. Mater., 2003, 15, 353–389 CrossRef CAS.
- X. Y. Kong and Z. L. Wang, Nano Lett., 2003, 3, 1625–1631 CrossRef CAS.
- P. X. Gao, C. S. Lao, Y. Ding and Z. L. Wang, Adv. Funct. Mater., 2006, 16, 53–62 CrossRef CAS.
- J. Y. Lao, J. Y. Huang, D. Z. Wang and Z. F. Ren, Nano Lett., 2002, 3, 235–238 CrossRef.
- Y. W. Zhu, H. Z. Zhang, X. C. Sun, S. Q. Feng, J. Xu, Q. Zhao, B. Xiang, R. M. Wang and D. P. Yu, Appl. Phys. Lett., 2003, 83, 144–146 CrossRef CAS.
- P. X. Gao, Y. Ding, W. Mai, W. L. Hughes, C. Lao and Z. L. Wang, Science, 2005, 309, 1700–1704 CrossRef CAS PubMed.
- X. Huang, G. Li, B. Cao, M. Wang and C. Hao, J. Phys. Chem. C, 2009, 113, 4381–4385 CAS.
- J. H. He, C. S. Lao, L. J. Chen, D. Davidovic and Z. L. Wang, J. Am. Chem. Soc., 2005, 127, 16376–16377 CrossRef PubMed.
- H. Wang, Y. Chen, H. B. Wang, C. Zhang, F. J. Yang, J. X. Duan, C. P. Yang, Y. M. Xu, M. J. Zhou and Q. Li, Appl. Phys. Lett., 2007, 90, 052505 CrossRef.
- Y. C. Chang and L. J. Chen, J. Phys. Chem. C, 2007, 111, 1268–1272 CAS.
- L. E. Greene, M. Law, D. H. Tan, M. Montano, J. Goldberger, G. Somorjai and P. Yang, Nano Lett., 2005, 5, 1231–1236 CrossRef CAS PubMed.
- T.-H. Chang, Y.-C. Chang, F.-K. Liu and T.-C. Chu, Appl. Surf. Sci., 2010, 256, 7339–7343 CrossRef CAS.
- J. Zhang, L. Sun, J. Yin, H. Su, C. Liao and C. Yan, Chem. Mater., 2002, 14, 4172–4177 CrossRef CAS.
- T. Song, J. W. Choung, J.-G. Park, W. I. Park, J. A. Rogers and U. Paik, Adv. Mater., 2008, 20, 4464–4469 CrossRef CAS.
- L. Hu and G. Chen, Nano Lett., 2007, 7, 3249–3252 CrossRef CAS PubMed.
- S. Xu, N. Adiga, S. Ba, T. Dasgupta, C. F. J. Wu and Z. L. Wang, ACS Nano, 2009, 3, 1803–1812 CrossRef CAS PubMed.
- C. Ye, Y. Bando, X. Fang, G. Shen and D. Golberg, J. Phys. Chem. C, 2007, 111, 12673–12676 CAS.
- X. Bai, E. G. Wang, P. Gao and Z. L. Wang, Nano Lett., 2003, 3, 1147–1150 CrossRef CAS.
- K. B. K. Teo, M. Chhowalla, G. A. J. Amaratunga, W. I. Milne, G. Pirio, P. Legagneux, F. Wyczisk, D. Pribat and D. G. Hasko, Appl. Phys. Lett., 2002, 80, 2011–2013 CrossRef CAS.
| This journal is © The Royal Society of Chemistry 2014 |

