Effect of acrylonitrile content on compatibility and damping properties of hindered phenol AO-60/nitrile-butadiene rubber composites: molecular dynamics simulation
Meng Songa,
Xiuying Zhaoab,
Yi Lia,
Tung W. Chanc,
Liqun Zhangab and
Sizhu Wu*a
aBeijing Engineering Research Center of Advanced Elastomers, Beijing University of Chemical Technology, Beijing 100029, P.R. China. E-mail: wusz@mail.buct.edu.cn; Fax: +86-10-64433964
bEngineering Research Center of Elastomer Materials Energy Conservation and Resources, Ministry of Education, Beijing University of Chemical Technology, Beijing 100029, P.R. China
cDepartment of Materials Science and Engineering, Virginia Polytechnic Institute and State University, Blacksburg, VA 24061, USA
First published on 24th September 2014
Abstract
The effect of the acrylonitrile content in nitrile-butadiene rubber (NBR) on the compatibility and damping properties of AO-60/NBR was investigated by molecular dynamics (MD) simulation and experimental methods. The hindered phenol AO-60 had poor compatibility with NBR with an acrylonitrile content of 41% (denoted by N220S), but had good compatibility with NBR with an acrylonitrile content of 34% (denoted by N230S). The AO-60/N230S composite had larger H-bonds and higher binding energy than the AO-60/N220S composite at the same AO-60 content, both indicating stronger interactions between N230S and AO-60 and better damping performance of AO-60/N230S. Moreover, SEM, DSC, and DMA were used to evaluate the compatibility and damping of AO-60/NBR composites. Phase separation occurred between N220S and AO-60, but a fine dispersion of AO-60 in N230S was obtained. The present study hopes to provide theoretical guidance to the design of damping rubber materials.
1. Introduction
Rubber damping materials, the fastest growing polymer systems, have found increasing applications in all kinds of motor vehicles, instruments, automatic office facilities, household appliances, and aerospace engineering.1,2 Rubber damping materials offer a variety of advantages over conventional damping materials in minimizing mechanical noises, reducing mechanical vibrations, enhancing work efficiency, and improving product quality.3,4 In recent years, the invention of rubber damping materials has led to further interest in organic hybrids with high damping properties.5–7 Organic hybrids are based on the hydrogen bonds (H-bonds) formed between small organic molecules and rubber matrixes.8–10Previous studies showed that the introduction of the hindered phenol tetrakis [methylene-3-(3-5-di-tert-butyl-4-hydroxy phenyl)propionyloxy]methane (AO-60) into nitrile-butadiene rubber (NBR) matrixes can form a composite with better damping properties than those of the rubber matrix.11–13 Compatibility is the key factor in choosing organic hybrid components and determining structure and performance.14,15 Because of the –CN side groups, NBR has strong polarity and high loss factor.16,17 The acrylonitrile content in NBR will affect the compatibility of small organic molecules and NBR, and the damping properties of the composite.18,19
A number of experiments, including optical microscopy,20 neutron scattering,21 differential scanning calorimetry (DSC),22 inverse gas chromatography,23 and dynamic mechanical analysis (DMA)24 were conducted in the past to investigate the compatibility. However, the compatibility can also be characterized by molecular dynamics (MD) simulation.25 With the development of powerful computer hardware and software, MD simulation proves to be a promising tool for material development and design because it can reveal molecular mechanisms that are hard to obtain by experimental methods.26,27
To the best of our knowledge, there has not been a study that critically examines the compatibility, structure, and damping properties of AO-60/NBR composites with different acrylonitrile contents by a combined experimental and MD simulation method. It was consequently our goal to carry out such a study.
2. Simulation and results
2.1. MD simulation strategies
The MD simulations were carried out by using the Discover and Amorphous Cell modules from Accelrys (San Diego, CA) with the Condensed-phase Optimized Molecular Potentials for Atomistic Simulation Studies (COMPASS) force field.28 In this force field, the total potential energy (Epot) is expressed as| Epot = Eb + Eθ + EΦ + Eχ + Ecross + ECou + EvdW | (1) |
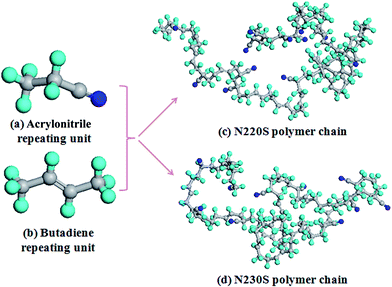
Fig. 2 shows the process of construction of the amorphous cell. First, the NBR polymer chains (Fig. 2(a)) and AO-60 small molecules (Fig. 2(b)) are built in a periodic boundary cell (Fig. 2(c)). Amorphous cells containing composites of N220S polymer chains and AO-60 small molecules (or N230S polymer chains with AO-60 small molecules) are constructed, and periodic boundary conditions are applied. There are four N220S (or N230S) polymer chains and some AO-60 small molecules in each cell with mass ratios of AO-60 to NBR of 0/100, 36/100, and 73/100. Then the energy of each generated cell is minimized to a convergence value of 1.0 × 10⁻⁵ kcal mol−1 Å−1 by using the Smart Minimizer method to relax the state of minimal potential energy. The cell is then annealed at 0.1 MPa from the lower temperature of 200 K to the upper temperature of 400 K for 50 ps to prevent the system to form being trapped at a local high energy minimum.30 Subsequently, 150 ps of NVT (constant number of particles, volume, and temperature) simulation is performed at 298 K and 200 ps of NPT (constant number of particles, pressure, and temperature) simulation is performed at 0.1 MPa to further relax the polymer structure by using the Andersen Thermostat31 for temperature control and the Berendsen Barostat for pressure control32 (Fig. 2(d)). At last, the cell can be used to analyze the properties of the system.
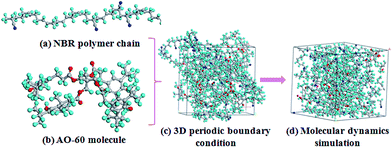 | ||
| Fig. 2 Models for MD simulation of AO-60/NBR composite (blue sphere is N, red sphere is O, cyan sphere is H, and grey sphere is C). | ||
2.2. Analysis of AO-60/NBR composites by MD simulation
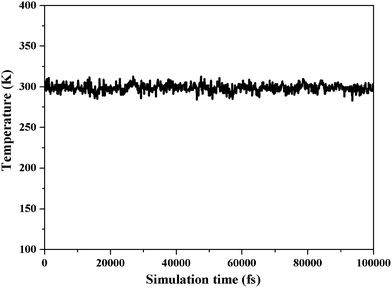
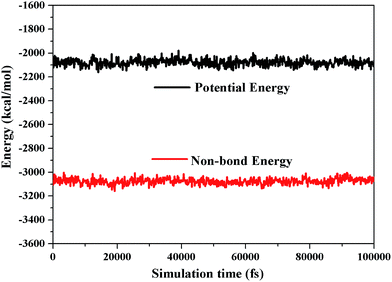
In MD simulation, there are two equilibrium criteria: one is the equilibrium of temperature, and the other is the equilibrium of energy. The equilibration time depends on the number of atoms in a specific system.33,34 When the fluctuations of temperature and energy are in the range of 5% to 10%, the equilibrium of the system is reached. Our MD systems have reached equilibrium, as shown in Fig. 3 and 4.The packing modes and structures of polymers are very sensitive to small variations on cell densities.35 The MD simulation density values are summarized in Table 1 and are in reasonably good agreement with the experimental results (|ρMD − ρExp| < 0.1), although the presence of a few additives in the experimental samples are not account for in the MD simulation.36
| Compounds | Experimental density (g cm−3) | Simulated density (g cm−3) |
|---|---|---|
| AO-60/N220S (0/100) | 1.059 | 1.030 |
| AO-60/N220S (36/100) | 1.068 | 1.041 |
| AO-60/N220S (73/100) | 1.028 | 0.9407 |
| AO-60/N230S (0/100) | 1.032 | 0.9545 |
| AO-60/N230S (36/100) | 1.044 | 1.018 |
| AO-60/N230S (73/100) | 1.050 | 1.024 |
The solubility parameter (δ) characterizes the strength of the cohesion between polymer molecules; thus, it is an important parameter to evaluate the compatibility of polymer blends.37 The solubility parameter δ is defined as the square root of the cohesive energy density (CED):
 | (2) |
| Components | Solubility parameters (δMD) (cal cm−3)1/2 | δNBR − δAO-60 (cal cm−3)1/2 | Interpretation |
|---|---|---|---|
| N220S | 9.45 | 1.24 | Likely to compatible |
| N230S | 9.07 | 0.86 | Compatible |
| AO-60 | 8.21 | — | — |
As seen in Table 2, it is evident from the data that AO-60/N230S has good compatibility owing to the small Δδ (δN230S − δAO-60 < 1.0) between the two components. However, the greater Δδ between N220S and AO-60 indicatives that N220S and AO-60 are likely to be compatible. These predictions were confirmed by DSC and DMA experiments, as described in the next section.
The compatibility between NBR and AO-60 is attributed to H-bonds formation. MD simulation can obtain quantitative information on the H-bonds in AO-60/NBR composites. Fig. 5 shows the simulated hydrogen bonds in an amorphous cell for the AO-60/N230S (73/100) composite. There are two kinds of H-bonds in the AO-60/NBR composite. The first H-bond(a) O–H⋯O is between the phenolic hydroxyl groups –OH of AO-60 and the carbonyl groups –C![[double bond, length as m-dash]](https://www.rsc.org/images/entities/char_e001.gif) O of AO-60. The second, H-bond(b) O–H⋯N, is between the phenolic hydroxyl groups –OH of AO-60 and the nitrile groups –CN of NBR.
O of AO-60. The second, H-bond(b) O–H⋯N, is between the phenolic hydroxyl groups –OH of AO-60 and the nitrile groups –CN of NBR.
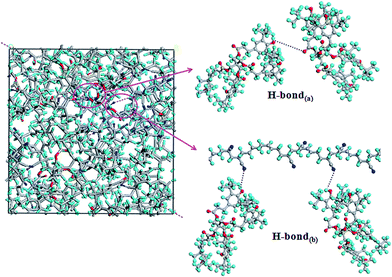 | ||
| Fig. 5 H-bonds in amorphous cell of AO-60/N230S (73/100) (the purple dotted lines represent H-bonds). | ||
Through repeated simulations, the number of H-bonds in AO-60/NBR composites with different mass ratios were obtained and listed in Table 3.
| Composites | AO-60/N220S (36/100) | AO-60/N220S (73/100) | AO-60/N230S (36/100) | AO-60/N230S (73/100) |
|---|---|---|---|---|
| No. of H-bonds(a) | 2 | 1 | 4 | 3 |
| No. of H-bonds(b) | 5 | 3 | 6 | 6 |
There is no H-bond in the N220S or N230S matrix. The addition of AO-60 molecules leads to the formation of H-bonds in the AO-60/N220S (or AO-60/N230S) composite. The number of H-bonds in AO-60/N230S is larger than that in AO-60/N220S at the same AO-60 content, indicating the stronger interaction between AO-60 and N230S and the better damping property of AO-60/N230S.
The binding energy (Ebinding) which is defined as the negative value of the interaction energy (Einter), can well reflect the intermolecular interactions and the mixing capacity of two components.33,36 The binding energy is calculated by the follow equation:
| Ebinding = −Einter = −(Etotal − EAO-60 − ENBR) | (3) |
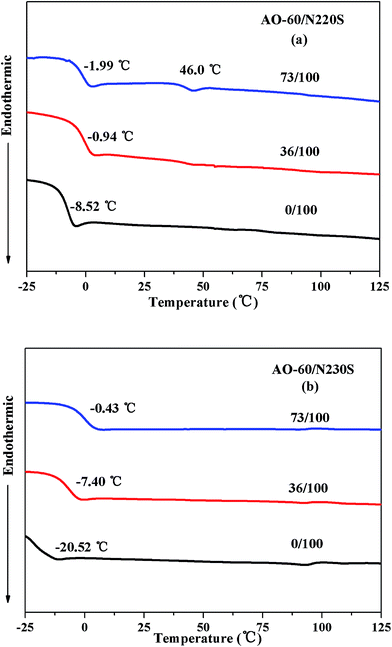
Table 4 presents the binding energy of N220S, N230S, the AO-60/N220S composite, and the AO-60/N230S composite. N230S has a stronger capability to blend with AO-60 molecules than N220S due to the larger number of H-bonds formed, indicating the stronger interaction and better compatibility between N230S and AO-60. The binding energy of the AO-60/N220S composite is negative when the AO-60 content exceeds 36 phr, indicating the incompatibility of the N220S matrix and AO-60 molecules, and phase separation will occur in the AO-60/N220S composite. These results are consistent with the above predictions based on the solubility parameter δ.
| Composites | Mass ratios | Etotal (kcal mol−1) | EAO-60 (kcal mol−1) | Ebinding (kcal mol−1) |
|---|---|---|---|---|
| AO-60/N220S | 36/100 | −1753.360 | −430.989 | 116.496 |
| 73/100 | −2114.470 | −972.170 | −63.575 | |
| AO-60/N230S | 36/100 | −1606.29 | −447.336 | 124.142 |
| 73/100 | −2072.783 | −1014.724 | 23.243 |
Thus, by MD simulation, the solubility parameter, H-bonds, and binding energy of the AO-60/NBR composites are calculated. AO-60/N230S has smaller solubility parameter difference between the components than AO-60/N220S, indicating a good compatibility between N230S and AO-60. Moreover, AO-60/N230S has larger H-bonds and higher binding energy than AO-60/N220S, indicating good damping performance of AO-60/N230S and these theoretical predictions will be confirmed by experiments below.
3. Experiments and comparison with theoretical results
3.1. Materials
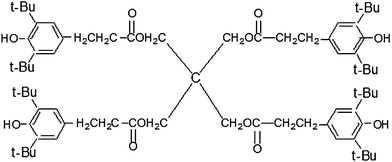
NBR (N220S) with an acrylonitrile mass fraction of 41% and NBR (N230S) with an acrylonitrile mass fraction of 34% were provided by Japan Synthetic Rubber Co., Ltd. (Tokyo, Japan). AO-60 in the form of powder was purchased from Beijing Additives Institute (Beijing, China). The chemical structure of AO-60 is shown in Fig. 6. Other chemicals and ingredients were all purchased in China. All materials were used without further purification.3.2. Sample preparation
AO-60/NBR rubber composites were prepared according to the following procedures: (1) after the as-received NBR was kneaded on a Φ 152.4 mm two-roll mill at room temperature for 3 min, AO-60 was blended in the AO-60/NBR mass ratios of 0/100, 36/100, and 73/100 into equal amounts of the kneaded NBR by kneading at room temperature for 5 min to form the first-stage AO-60/NBRa composites. (2) Each AO-60/NBRa composite was kneaded on the two-roll mill at 130 °C for 5 min to fully fuse the AO-60 small molecules before the composite was gradually cooled to room temperature to form a second-stage AO-60/NBRb composite. (3) The AO-60/NBRb composite was then blended with compounding and crosslinking additives, including 5.0 phr of zinc oxide, 2.0 phr of stearic acid, 0.5 phr of dibenzothiazole disulfide, 0.5 phr of diphenyl guanidine, 0.2 phr of tetramethylthiuram disulfide, and 2.0 phr of sulfur by kneading on the two-roll mill at room temperature for 10 min. (4) Finally, the composite was vulcanized on a hot press at 160 °C under the pressure of 15 MPa for the optimum vulcanization time to form an AO-60/NBR sample. The optimum vulcanization time was pre-determined for each composite by using a disc rheometer (P355C2) manufactured by Huanfeng Chemical Technology and Experimental Machine Co. (Beijing, China).3.3. Characterization
SEM images were taken of representative fracture surfaces of the AO-60/NBR composites by using a Hitachi S-4800 high resolution SEM (Japan). The SEM specimens were prepared by fracturing the composites in liquid nitrogen. FTIR measurements were made with a Nicolet 8700 FTIR spectrometer made by Thermo Fisher Scientific Inc. (USA). The FTIR spectra were obtained by scanning the specimens for 32 times in the wavenumber range of 400 cm−1 to 4000 cm−1. The FTIR spectra of AO-60/NBR composites were acquired from sheet specimens with a thickness of approximately 1 mm by using the attenuated total reflection (ATR) technique. DSC measurements were performed on a TGA/DSC calorimeter made by Mettler-Toledo Co. (Switzerland). Samples weighing about 10 mg and sealed in aluminum were heated from −60 °C to 150 °C at a heating rate of 10 °C min−1 under a nitrogen atmosphere. The glass transition temperature (Tg) was identified by the midpoint of the transition region. Dynamic mechanical measurements were carried out in the tension mode by using a VA 3000 dynamic mechanical analyzer (DMA) made by Rheometric Scientific Inc. (USA). The rectangular samples were 12 mm long, 6 mm wide, and about 2 mm thick. The temperature dependence of the loss factor (tan![[thin space (1/6-em)]](https://www.rsc.org/images/entities/char_2009.gif) δ) for various samples was measured between −50 °C and 100 °C at a constant frequency of 1 Hz and a heating rate of 5 °C min−1.
δ) for various samples was measured between −50 °C and 100 °C at a constant frequency of 1 Hz and a heating rate of 5 °C min−1.
3.4. Microscopic morphology analysis
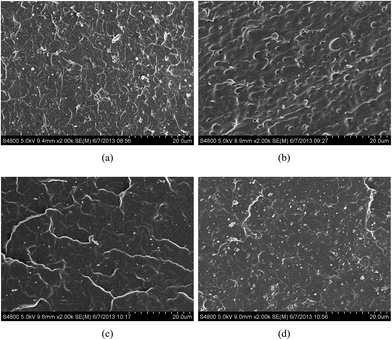
Fig. 7 shows the microscopic images of the representative fracture surfaces of AO-60/NBR composites at the same magnification. The fracture surfaces of AO-60/NBR composites are homogeneous in pure NBR and at an AO-60 content of 36 phr, because most AO-60 molecules are dissolved to form a fine dispersion in the matrix. As the AO-60 content exceeds 36 phr, AO-60 has a poor dispersion and phase separates in the N220S matrix, as indicated by the numerous holes resulting from the removal of AO-60 molecules from the fracture surface in Fig. 7(b). However, Fig. 7(d) shows that the fracture surface of the AO-60/N230S composite is very smooth and without any holes, probably because of the good compatibility and strong interactions between AO-60 and the N230S matrix.40 These results are consistent with the MD simulation results above and are further supported by the DSC and DMA results below.3.5. FTIR analysis of hydrogen bonds in AO-60/NBR composites
To examine the intermolecular interaction between N220S (or N230S) and AO-60, we obtained FTIR measurements of pure N220S, pure N230S, AO-60/N220S composite, and AO-60/N230S composite were obtained. In Fig. 8(a) for AO-60, there are the significant absorptions in 3550–3675 cm−1 and 3350–3550 cm−1, which are assigned to the –OH vibrations caused by free –OH and the OH–OH interactions (O–H⋯O hydrogen bonds) between AO-60 molecules, respectively.35 The spectra of the pure N220S and N230S hardly reveal any absorbance band in the wavenumber range 3200–4000 cm−1 in Fig. 8(b) and (c), whereas the spectra of the AO-60/N220S and AO-60/N230S composites indicate significant peaks at 3638 cm−1 and 3599 cm−1, corresponding to the free –OH of AO-60. Moreover, a broad peak appears in the range 3350–3550 cm−1, which can be attributed to the hydrogen bonding between the –OH groups of AO-60 and the –CN groups of NBR.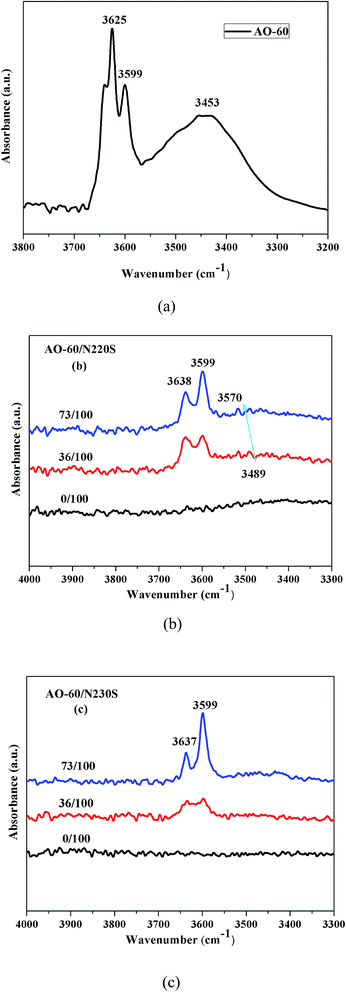 | ||
| Fig. 8 FTIR/TR spectrum of (a) AO-60, (b) FTIR/ATR spectra of AO-60/N220S composites, and (c) FTIR/ATR spectra of AO-60/N230S composites. | ||
3.6. Verification of compatibility by DSC analysis
The occurrence of glass transition can be used as a rule of thumb to determine the compatibility of blend. If a binary blend is compatibility, only a single glass transition appears.41 Otherwise, two glass transitions could be detected and each glass transition indicates the freezing temperature of one component.42 Fig. 9 shows the DSC thermograms of the AO-60/N220S composite and the AO-60/N230S composite. As can be seen from Fig. 9(a) and (b), the Tg of NBR increases with the increase of acrylonitrile content because the side chains and polarity of NBR increase with the increase of acrylonitrile content, making macromolecular chain movements difficult.The Tg of an AO-60/NBR composite is significantly higher than that of the pure NBR because the small AO-60 molecules have strong molecular interaction with the NBR matrix. Moreover, the AO-60/N230S composite shows only one Tg, indicating the good compatibility between AO-60 and the N230S matrix. However, there are two Tgs in the AO-60/N220S composite when the content of AO-60 is above 36 phr, indicating poor compatibility and a two-phase structure. The temperature of 46 °C indicated in the DSC curve is the glass transition temperature of the amorphous AO-60 that has aggregated in the matrix.43
3.7. Dynamic mechanical properties
Fig. 10 shows the temperature dependence of the loss tangent (tan![[thin space (1/6-em)]](https://www.rsc.org/images/entities/char_2009.gif) δ) for the AO-60/N220S composite and the AO-60/N230S composite. It can be seen that pure N220S and N230S show only one tan
δ) for the AO-60/N220S composite and the AO-60/N230S composite. It can be seen that pure N220S and N230S show only one tan![[thin space (1/6-em)]](https://www.rsc.org/images/entities/char_2009.gif) δ peak. In addition, the tan
δ peak. In addition, the tan![[thin space (1/6-em)]](https://www.rsc.org/images/entities/char_2009.gif) δ peak increases and gradually shifts to higher temperatures with increasing acrylonitrile content. The shift was mainly due to the increase in polarity with increasing acrylonitrile content, resulting in the increase in friction between molecular chains and high energy consumption. As the AO-60 content exceeds 36 phr, two tan
δ peak increases and gradually shifts to higher temperatures with increasing acrylonitrile content. The shift was mainly due to the increase in polarity with increasing acrylonitrile content, resulting in the increase in friction between molecular chains and high energy consumption. As the AO-60 content exceeds 36 phr, two tan![[thin space (1/6-em)]](https://www.rsc.org/images/entities/char_2009.gif) δ peaks appear in the AO-60/N220S composite, an indication of phase separation. The DSC results presented above indicated that the excessive AO-60 small molecules aggregated, leading to the appearance of two phases in the composite. However, there is only one tan
δ peaks appear in the AO-60/N220S composite, an indication of phase separation. The DSC results presented above indicated that the excessive AO-60 small molecules aggregated, leading to the appearance of two phases in the composite. However, there is only one tan![[thin space (1/6-em)]](https://www.rsc.org/images/entities/char_2009.gif) δ peak in the AO-60/N230S composite, indicating the good compatibility between N230S and AO-60.
δ peak in the AO-60/N230S composite, indicating the good compatibility between N230S and AO-60.
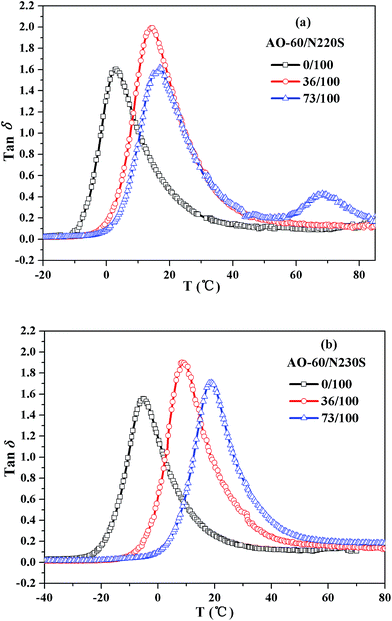 | ||
Fig. 10 Temperature dependence of loss tangent (tan![[thin space (1/6-em)]](https://www.rsc.org/images/entities/char_2009.gif) δ): (a) AO-60/N220S composite and (c) AO-60/N230S composite. δ): (a) AO-60/N220S composite and (c) AO-60/N230S composite. | ||
Table 5 shows the damping properties of N220S, N230S, the AO-60/N220S composite, and the AO-60/N230S composite. The area under the tan![[thin space (1/6-em)]](https://www.rsc.org/images/entities/char_2009.gif) δ versus temperature curve (TA) is commonly used for characterizing the damping property of rubber.44 The larger the TA value, the better the damping properties of material. Table 5 shows that AO-60/N230S has the larger TA value and wider temperature range over which the damping is efficient (tan
δ versus temperature curve (TA) is commonly used for characterizing the damping property of rubber.44 The larger the TA value, the better the damping properties of material. Table 5 shows that AO-60/N230S has the larger TA value and wider temperature range over which the damping is efficient (tan![[thin space (1/6-em)]](https://www.rsc.org/images/entities/char_2009.gif) δ > 0.3) at the same AO-60 content, indicating better damping properties, confirming the MD simulation results.
δ > 0.3) at the same AO-60 content, indicating better damping properties, confirming the MD simulation results.
| Materials | Mass ratios | tan![[thin space (1/6-em)]](https://www.rsc.org/images/entities/char_2009.gif) δmax δmax |
tan![[thin space (1/6-em)]](https://www.rsc.org/images/entities/char_2009.gif) δ > 0.3 δ > 0.3 |
||
|---|---|---|---|---|---|
| Value | T (°C) | ΔT | TA (°C) | ||
| AO-60/N220S | 0/100 | 1.60 | 3.10 | 31.3 | 40.7 |
| 36/100 | 2.00 | 14.6 | 39.0 | 55.9 | |
| 73/100 | 1.62 | 16.9 | 36.4 | 49.1 | |
| AO-60/N230S | 0/100 | 1.55 | −5.25 | 33.8 | 39.4 |
| 36/100 | 1.95 | 8.5 | 39.2 | 56.5 | |
| 73/100 | 1.71 | 18.8 | 37.8 | 53.7 | |
4. Conclusions
MD simulation and experiments have been adopted to analyze the compatibility, microstructure, and damping properties of AO-60/NBR composites with different acrylonitrile contents. The solubility parameter δ, number of H-bonds, and binding energy of the AO-60/NBR composites are calculated by MD simulation. N230S with an acrylonitrile content of 34% has a good compatibility with AO-60, but N220S with an acrylonitrile content of 41% has a poor compatibility with AO-60, as predicated by MD simulation. AO-60/N230S has larger H-bonds and higher binding energy than AO-60/N220S both indicating the stronger interactions between AO-60 and N230S and better damping performance of AO-60/N230S. Both predictions are confirmed by SEM, DSC, and DMA analyses. The combined simulation and experimental study provides a theoretical understanding of the effect of acrylonitrile content in NBR on the compatibility and damping properties of AO-60/NBR composites on a molecular level.Acknowledgements
The financial supports of the National Natural Science Foundation of China under Grant no. 51473012 are gratefully acknowledged.Notes and references
- A. A. Gusev, K. Feldman and O. Guseva, Macromolecules, 2010, 43, 2638–2641 CrossRef CAS.
- Y. Q. Wang, Y. Wang, H. F. Zhang and L. Q. Zhang, Macromol. Rapid Commun., 2006, 27, 1162–1167 CrossRef CAS.
- S. Joseph, P. A. Sreekumar, J. M. Kenny, D. Puglia, S. Thomas and K. Joseph, Polym. Compos., 2010, 31, 236–244 CAS.
- X. Y. Zhao, Y. L. Lu, D. L. Xiao, S. Z. Wu and L. Q. Zhang, Macromol. Mater. Eng., 2009, 294, 345–351 CrossRef CAS.
- C. Wu, T. A. Yamagishi, Y. Nakamoto, S. I. Ishida, K. H. Nitta and S. Kubota, J. Polym. Sci., Part B: Polym. Phys., 2000, 38, 1341–1347 CrossRef CAS.
- C. Wu, T. A. Yamagishi, Y. Nakamoto, S. Ishida, K. H. Nitta and S. Kubota, J. Polym. Sci., Part B: Polym. Phys., 2000, 38, 2285–2295 CrossRef CAS.
- Q. Liu, H. Zhang and X. Yan, Iran. Polym. J., 2009, 18, 401–413 CAS.
- T. Sajjayanukul, P. Saeoui and C. Sirisinha, J. Appl. Polym. Sci., 2005, 97, 2197–2203 CrossRef CAS.
- A. Omayu, T. Ueno and A. Matsumoto, Macromol. Chem. Phys., 2008, 209, 1503–1514 CrossRef CAS.
- C. Wu, Y. Otani, N. Namiki, H. Emi, K. H. Nitta and S. Kubota, J. Appl. Polym. Sci., 2001, 82, 1788–1793 CrossRef CAS.
- X. Y. Zhao, P. Xiang, M. Tian, H. Fong, R. Jin and L. Q. Zhang, Polymer, 2007, 48, 6056–6063 CrossRef CAS PubMed.
- P. Xiang, X. Y. Zhao, D. L. Xiao, Y. L. Lu and L. Q. Zhang, J. Appl. Polym. Sci., 2008, 109, 106–114 CrossRef CAS.
- M. Song, X. Y. Zhao, Y. Li, S. K. Hu, L. Q. Zhang and S. Z. Wu, RSC Adv., 2014, 4, 6719–6729 RSC.
- J. H. Zhang, L. F. Wang and Y. F. Zhao, Mater. Des., 2013, 51, 648–657 CrossRef CAS PubMed.
- X. Y. Zhao, Y. J. Cao, H. Zou, J. Li and L. Q. Zhang, J. Appl. Polym. Sci., 2011, 123, 3696–3702 CrossRef.
- J. E. Mark, Rubberlike Elasticity, Wiley-Intersecience, New York, 2nd edn, 2007 Search PubMed.
- X. Y. Zhao, Y. L. Lu, D. L. Xiao, S. Z. Wu and L. Q. Zhang, Macromol. Mater. Eng., 2009, 294, 345–351 CrossRef CAS.
- B. Likozar and Z. Major, Appl. Surf. Sci., 2010, 257, 565–573 CrossRef CAS PubMed.
- T. Yasin, S. Ahmed, F. Yoshii and K. Makuuchi, React. Funct. Polym., 2003, 57, 113–118 CrossRef CAS PubMed.
- M. E. Lauer, O. Grassmann, M. Siam, J. Tardio, L. Jacob, S. Page, J. H. Kindt, A. Engel and J. Alsenz, Pharm. Res., 2011, 28, 572–584 CrossRef CAS PubMed.
- C. Dyer, Z. Jiang, J. Bozell, T. Rials, W. T. Heller and M. Dadmun, Soft Matter, 2013, 9, 3402–3411 RSC.
- X. J. Li, S. L. Zhang, H. Wang, C. F. Zhang, J. H. Pang, J. X. Mu, G. Ma, G. B. Wang and Z. H. Jiang, Polym. Int., 2011, 60, 607–612 CrossRef CAS.
- S. Ramanaiah, P. R. Rani, T. V. M. Sreekanth and K. S. Reddy, J. Macromol. Sci., Part B: Phys., 2011, 50, 551–562 CrossRef CAS.
- K. Lewandowska, Thermochim. Acta, 2011, 517, 90–97 CrossRef CAS PubMed.
- Z. L. Luo and J. W. Jiang, Polymer, 2010, 51, 291–299 CrossRef CAS PubMed.
- Y. Y. Gao, J. Liu, D. P. Cao and L. Q. Zhang, RSC Adv., 2013, 3, 21655–21665 RSC.
- Q. Yang, X. P. Yang, X. D. Li, L. Shi and G. Sui, RSC Adv., 2013, 3, 7452–7459 RSC.
- S. W. Bunte and H. Sun, J. Phys. Chem. B, 2000, 104, 2477–2489 CrossRef CAS.
- S. Zhu, L. Yan, D. Zhang and Q. Feng, Polymer, 2011, 52, 881–892 CrossRef CAS PubMed.
- J. Colmenero, F. Alvarez and A. Arbe, Phys. Rev. E: Stat., Nonlinear, Soft Matter Phys., 2002, 65, 1804–1815 CrossRef.
- J. E. Basconi and M. R. Shirts, J. Chem. Theory Comput., 2013, 9, 2887–2899 CrossRef CAS.
- J. Davoodi and M. Ahmadi, Composites, Part B, 2012, 43, 10–14 CrossRef PubMed.
- X. F. Ma, W. H. Zhu, J. J. Xiao and H. M. Xiao, J. Hazard. Mater., 2008, 156, 201–207 CrossRef CAS PubMed.
- L. Qiu and H. M. Xiao, J. Hazard. Mater., 2009, 164, 329–336 CrossRef CAS PubMed.
- B. Qiao, X. Y. Zhao, D. M. Yue, L. Q. Zhang and S. Z. Wu, J. Mater. Chem., 2012, 22, 12339–12348 RSC.
- X. J. Wang, J. J. Xiao, W. H. Zhu, H. Sun and H. M. Xiao, J. Hazard. Mater., 2009, 167, 810–816 CrossRef PubMed.
- J. Gupta, C. Nunes, S. Vyas and S. Jonnalagadda, J. Phys. Chem. B, 2011, 115, 2014–2023 CrossRef CAS PubMed.
- A. Forster, J. Hempenstall, I. Tucker and T. Rades, Int. J. Pharm. Sci., 2001, 226, 147–161 CrossRef CAS.
- D. J. Greenhalgh, A. C. Williams, P. Timmins and P. York, J. Pharm. Sci., 1999, 88, 1182–1190 CrossRef CAS PubMed.
- H. Li, J. Q. Zhao, S. M. Liu and Y. C. Yuan, RSC Adv., 2014, 4, 10395–10401 RSC.
- H. Yang, Z. S. Li, Z. Y. Lu and C. C. Sun, Eur. Polym. J., 2005, 41, 2956–2962 CrossRef CAS PubMed.
- H. Yang, L. Z. Sheng, H. J. Qian, Y. B. Yang, X. B. Zhang and C. C. Sun, Polymer, 2004, 45, 453–457 CrossRef CAS PubMed.
- X. Y. Zhao, P. Xiang and L. Q. Zhang, Acta Mater. Compositae Sin., 2007, 24, 44–49 CAS.
- Z. Gu, X. Zhang, C. Bao, F. Fang, X. Ding, S. Y. Li, L. Chen, M. Xue, H. Wang and X. Y. Tian, J. Non-Cryst. Solids, 2014, 388, 17–22 CrossRef CAS PubMed.
| This journal is © The Royal Society of Chemistry 2014 |

