DOI:
10.1039/C4RA10138C
(Paper)
RSC Adv., 2014,
4, 58412-58416
Determination of total, free, and reduced homocysteine and related aminothiols in uremic patients undergoing hemodialysis by precolumn derivatization HPLC with fluorescence detection
Received
10th September 2014
, Accepted 20th October 2014
First published on 21st October 2014
Abstract
Homocysteine (Hcy) and its metabolically related aminothiols cysteine (Cys), cysteinylglycine (CysGly), and glutathione (GSH) play important roles in the pathogenesis of uremia. Most of these aminothiols exist in plasma as disulphide and mixed disulphide forms. A new, simple, sensitive and reliable precolumn derivatization HPLC method, with fluorescence detection, for the determination of four kinds of aminothiols, including total, free and reduced fractions, in plasma simultaneously was established and validated. After a simple derivatization using N-(1-pyrenyl) maleimide (NPM), the assay was performed using a C-18 column with gradient elution. The method used for the total aminothiol determinations was linear in the range of 2.00–80.0, 10.0–1500, 1.00–120, and 3.00–240 μmol L−1 for GSH, Cys, Hcy, and CysGly, respectively. The method used for the reduced aminothiols was linear in the range of 0.10–8.00, 1.25–50.0, 1.25–50.0, and 0.01–4.00 μmol L−1 for GSH, Cys, Hcy, and CysGly, respectively. The method was successfully applied to the analysis of plasma from uremic patients (n = 29) and healthy subjects (n = 28). The results showed that the concentrations of the total, free and reduced forms of Hcy, Cys and CysGly were higher, while the concentrations of the three forms of GSH were lower (p < 0.05) in uremic patients than in the healthy controls. The concentrations of the three forms of Hcy and Cys were significantly decreased, but the concentrations of the three fractions of GSH and CysGly had no significant change, during hemodialysis. In conclusion, the developed method is simple, fast, accurate, and suitable for clinical measurements.
1. Introduction
Homocysteine (Hcy) and its metabolically related aminothiols cysteine (Cys), cysteinylglycine (CysGly), and glutathione (GSH), contribute to the plasma redox thiol status,1 and play important roles in the pathogenesis of uremia. These aminothiols exist in plasma as protein-bound and unbound forms (free forms). The free fraction of the aminothiols include Hcy–Hcy disulfides or other mixed disulfides and thiols with a free sulfhydryl group (reduced forms). Because aminothiol fractions bounded with proteins are probably not biologically active,2 the free forms of aminothiol may be more likely to play a role in the pathogenesis of diseases than other forms of aminothiol. Many literature examples showed that the presence of reduced Hcy (rHcy) was significantly increased in the pathological state. The rHcy concentrations in plasma were two to four times higher than normal in patients with end-stage renal disease (ESRD).3 Bodil Sjöberg et al.4 concluded that rHcy was the deleterious form of homocysteine for vascular function in vivo.5 Tsai-Hsiu Yang et al.6 found that rHcy and free Hcy (fHcy), rather than total Hcy (tHcy), were significantly elevated in patients with acute/subacute ischemic stroke. Approximately only 2% of the circulating tHcy is in the reduced form and exists at low concentrations (0.1–10 nmol mL−1) in plasma.7 Therefore, a fully validated, simple, precise, and sensitive analytical method which is capable of simultaneously determining aminothiols in human plasma is urgently needed. Because most aminothiols are unstable and present in low concentrations, especially the reduced forms in isolated plasma, few methods have been reported for accurate measurement of aminothiols in their total, free, and reduced forms simultaneously. HPLC is one of the most popular procedures for simultaneously determining the concentrations of aminothiols. Bald et al.8 measured total, free and reduced aminothiol concentrations by reversed-phase HPLC with detection at 355 nm, using sodium borohydride as the reducing agent and 2-chloro-1-methylquinolinium tetrafluoroborate for derivatization. Sjöberg, et al.4 determined the concentrations of total, free and reduced GSH, Cys, Hcy, and CysGly by HPLC, with fluorescence detection, using 7-fluorobenzofurazan-4-sulfonic acid ammonium salt (SBD-F) for derivatization. However, a long time and an elevated temperature for the derivatization were needed.
N-(1-Pyrenyl) maleimide has been used as a derivatization reagent for the sulfhydryl group to determine the total thiol concentration in cells.9 In this paper, we developed a new, fast, simple, sensitive, and precise HPLC method with fluorescence detection to quantify not only the total concentrations of Hcy, Cys, CysGly, and GSH, but also the concentration of their reduced and free forms in plasma, using N-(1-pyrenyl) maleimide (NPM) for derivatization. We applied this method to determine the concentration of Hcy and its related aminothiols in human plasma with uremia for investigation of the change in the aminothiol metabolism.
2. Materials and methods
2.1 Chemical and materials
Hcy, Cys, CysGly, GSH, NPM and tris-(2-carboxylethyl)-phosphine (TCEP) were purchased from Sigma (St. Louis, Mo, USA). Acetonitrile was of chromatographic grade and purchased from Tedia (Fairfield, OH, USA). All other chemicals and solvents were analytical grade and purchased in China. Water was purified using a Millipore Synergy water device (Millipore, Milford, MA, USA). Microcon Centrifugal Filter Devices with a molecular weight cutoff of 3000 Da were purchased from Millipore Corporation (Millipore, Milford, MA, USA). The mobile phase was prepared daily and filtered through a 0.22 μm Millipore filter (Millipore, Milford, MA, USA).
2.2 Instrumentation
The HPLC system was an Agilent (Palo Alto, CA, USA) LC system equipped with a vacuum degasser (G1322A), quat pump (G1311A), manual-injector (G1328), and fluorescence detector (G1321A). The detector was set at excitation and emission wavelengths of 330 nm and 380 nm, respectively. The data were acquired and processed using Agilent Chemstation software. Separation of the analytes was achieved with an Agilent Hypersil C-18 column (250 mm × 4.0 mm; 5 μm) equipped with an Agilent Hypersil ODS guard column (4 × 4 mm, 5 μm) at 25 °C with gradient elution. The mobile phase for HPLC analysis was as follows: solvent A, 15 mmol L−1 sodium acetate aqueous solution; solvent B, 300 mL water containing 1 mL acetic acid and 1 mL phosphoric acid; solvent C, acetonitrile. The gradient elution procedure was B
:
C (40/60, v/v) from 0 to 1 min and A
:
B
:
C (20/20/60, v/v/v) from 1 to 12.5 min at a flow rate of 0.5 mL min−1.
2.3 Subjects
Twenty-nine uremic patients from the First Affiliated Hospital of Chongqing Medical University were enrolled in this study. All the patients were on standard bicarbonate hemodialysis therapy twice a week for more than half a year. Twenty-eight healthy controls from a medical examination center in the hospital were sex and age matched with the patient group. Informed consent was obtained from all participants. The research was approved by the First Affiliated Hospital of Chongqing Medical University Ethics Committee.
2.4 Preparation of samples
Blood was collected into 5 mL EDTA-treated anticoagulant tubes after a fasting state of at least 8 hours and immediately placed on crushed ice. Blood from patients with uremia undergoing hemodialysis was collected before and after hemodialysis sessions. The blood sample was centrifuged at 3000g for 10 min within one hour of collection and then divided into two aliquots. The first aliquot was stored at −80 °C until being analyzed for the total concentrations of aminothiols. The second aliquot was added to a Microcon Centrifugal Filter Device followed by centrifugation at 2000g for 20 min at 4 °C to obtain the ultrafiltrate. The ultrafiltrate was used for measurement of the free and reduced forms of the aminothiols. The sample reduction and derivatization are described as follows:
2.4.1 Total thiols. For the total thiols measurement, 10 μL of 10 g L−1 TCEP was added to 100 μL of plasma, which was then vortexed and incubated at 37 °C for 10 min to reduce the sulfhydryl group. Following this, 400 μL of 1 mmol L−1 NPM in acetonitrile was slowly added, mixed and the mixture was kept for 15 min at room temperature to derivatize and precipitate the protein. Next, the mixture was centrifuged at 15
000g for 10 min at 4 °C, after acidification with 10 μL of 50% (v/v) acetic acid. Thereafter, 20 μL of the supernatant was injected into the HPLC system.
2.4.2 Free thiols. There are some differences in the reduction and derivatization procedures between the free and total thiols measurements. The ultrafiltrate was used instead of plasma for the reduction procedure and the concentration of the derivative (NPM) was reduced to 500 μmol L−1 for the derivatization. The other procedures were conducted as for 2.4.1.
2.4.3 Reduced thiols. For the reduced thiols measurement, only derivatization is needed. So 400 μL of NPM (50 μmol L−1 in acetonitrile) was added to 100 μL of the ultrafiltrate and the following procedures were conducted as for 2.4.1.
2.5 Preparation of calibrators
2.5.1 Preparation of calibrators for the total and free thiols. The stock solutions of aminothiols were prepared separately at a concentration of 100 mmol L−1 with water and acetonitrile (40/60, v/v) and stored at −80 °C until needed. The working solutions were prepared by diluting the stock solution to an appropriate concentration with water and acetonitrile (40/60, v/v) and a pooled plasma sample was used as a biological matrix. Plasma calibrators for the total and free thiol measurements were prepared individually by mixing 90 μL of pooled plasma with 10 μL of the working solution. Then the mixture was reduced using TCEP and derivatized with NPM as described in Section 2.4.1. Calibration curves for the total and free thiol concentrations were constructed by plotting the peak areas of the plasma with added standards, after subtracting the peak areas of the matrix plasma (y), against the concentration of thiol (x). The limit of detection (LOD) can be reliably detected with an S/N ratio of 3.
2.5.2 Preparation of calibrators for the reduced thiol. Calibration curves for reduced thiol measurements were prepared by measuring the standard solution at five concentrations after derivatization: 0.1, 0.5, 2, 4, 8, and 10 μmol L−1 for rGSH; 1.25, 2.5, 10, 25, and 50 μmol L−1 for rCys; 0.001, 0.05, 0.1, 1, 2, and 4 μmol L−1 for rHcy; 0.15, 0.3, 1.5, 3, 6, 12, and 30 μmol L−1 for rCysGly. Each 100 μL standard solution was derivatized with NPM as described in Section 2.4.1. The external calibration curves obtained by plotting of the peak-areas versus the concentrations of the thiol standards were used for the quantitative analysis of reduced thiols. The limit of detection (LOD) can be reliably detected with an S/N ratio of 3.
2.6 Method validation
2.6.1 Precision. The intra-day precision was assessed by calculation of the variance of the concentrations of the aminothiols for their total, free and reduced fractions in the same pooled plasma sample five times in one day. And inter-day precision was assessed by calculation of the variance of the concentrations of aminothiols in the same pooled plasma sample on five consecutive days.
2.6.2 Relative recovery. The relative recovery was determined by measuring thiol concentrations in 90 μL of pooled plasma before and after 10 μL of a mixture of standard solutions of high, middle and low concentration were added (all samples were prepared as for total thiols, described in Section 2.4.1). The recovery was expressed as [(measured value − endogenous value)/added value] × 100%.
2.7 Statistical analysis
The data were shown as mean ± SD and statistical significance was accepted when P < 0.05. The analysis of variance (ANOVA) was performed using SPSS 14.0. The data were analyzed by principal component analysis (PCA) using software of SIMCA 12.0. Potential biomarkers were selected according to the loading plot.
3. Results and discussion
3.1 The condition of sample preparation
About 70–80% of Hcy, 65% of Cys, and 60% of CysGly in plasma combine with albumin or other thiols as disulfides. These thiols should be converted to the free form for measurement of the total concentrations in plasma. Some reducing agents have been used in previous studies, including sodium borohydride,10 tributylphosphine (TBP),11,12 dithilthreitol (DTT)13 and TCEP.14,15 In this study, TCEP was chosen as the reducer for its stability and solubility in water, moreover it is less sensitive to temperature and the calibrator matrix.14 TCEP would react with the derivatization NPM (shown in Fig. 1), so the required concentration was further investigated. 10 g L−1 of TCEP was ultimately chosen for the total aminothiol analysis and 1 g L−1 for the free aminothiol analysis.
 |
| Fig. 1 Chromatogram of TCEP reaction with the derivatization NPM. | |
GSH, Cys, Hcy and CysGly lack a chromophore and are not sensitive enough to be detected by UV due to their weak absorption, so the thiols should be detected by fluorescence after derivatization. NPM is a specific derivatizing agent for sulfhydryl groups.9 It is an ideal derivatizing agent for thiol due to its fast reaction, stability and clear background in chromatograms, and has not been used for the measurment of the free and reduced forms of Hcy, Cys, GSH and CysGly before. The total, free and reduced aminothiol reaction conditions using NPM were fully investigated and optimized. Finally, 400 μL aliquots of acetonitrile containing 1 mmol L−1, 500 μmol L−1 and 50 μmol L−1 of NPM were added into 100 μL samples of prepared plasma to derivatize the total, free and reduced aminothiols, respectively. The derivatization reaction could complete at room temperature in 15 min, then 10 μL of 50% (v/v) acetic acid was added. The derivatives in an acidified solution are stable for 24 hours at 0 °C.
As reduced thiols would be oxidized even when stored at −80 °C (ref. 4), blood samples should immediately be placed on ice and centrifuged to separate the plasma within one hour of sample collection to avoid rapid oxidation of the aminothiols. The free and reduced aminothiols in the plasma were immediately derivatized and the measurements were finished within 24 hours.
3.2 Chromatograms and calibration curves
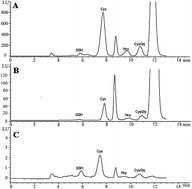
Calibration curves were plotted using the integrated peak areas vs. the standard thiol concentrations. Regression equations, correlation coefficients, linear ranges and LOD are shown in Table 1. All correlation coefficients were greater than 0.999. The chromatograms of the samples showed a good separation for the thiols and endogenous compounds (shown in Fig. 2).
Table 1 Standard curves and detection limits for the thiols
Thiols |
Standard curves |
r |
Linearity (μmol L−1) |
Detection limit (μmol L−1) |
tGSH |
Y = 52.1X + 37.3 |
0.9990 |
2.0–80.0 |
1.0 |
tCys |
Y = 62.58X + 1356 |
0.9998 |
10.0–1500 |
3.0 |
tHcy |
Y = 121.9X − 73.7 |
0.9999 |
1.0–120 |
0.50 |
tCysGly |
Y = 87.21X + 179.0 |
0.9995 |
3.0–240 |
1.50 |
rGSH |
Y = 22.95X + 1.46 |
0.9993 |
0.10–8.00 |
0.05 |
rCys |
Y = 37.70X + 11.02 |
0.9996 |
1.2–50.0 |
1.0 |
rHcy |
Y = 152.1X − 0.5 |
0.9992 |
0.010–4.00 |
0.005 |
rCysGly |
Y = 144.7X − 0.8 |
0.9993 |
0.050–6.00 |
0.020 |
 |
| Fig. 2 Chromatograms for the plasma aminothiols. (A) Total aminothiols in the plasma. (B) Free aminothiols in the plasma. (C) Reduced aminothiols in the plasma. | |
3.3 Validation of the assay
The developed method was accurate for the assay of aminothiols, with recoveries ranging from 80.1% to 114.9% (shown in Table 2), and precise with CVs values below 9.0% (shown in Table 3).
Table 2 Recoveries of Hcy, Cys, CysGly, and GSH in plasma
Thiol |
Added (μmol L−1) |
Recovery (%) |
GSH |
4.00 |
95.5 ± 2.2 |
10.0 |
87.6 ± 1.0 |
20.0 |
109.0 ± 3.6 |
Cys |
100 |
80.1 ± 4.1 |
250 |
104.1 ± 2.9 |
500 |
109.1 ± 3.2 |
Hcy |
1.50 |
87.6 ± 5.0 |
15.0 |
98.9 ± 2.4 |
60.0 |
114.5 ± 3.5 |
CysGly |
6.00 |
95.4 ± 4.4 |
30.0 |
99.0 ± 4.1 |
60.0 |
114.9 ± 4.5 |
Table 3 Within- and between-day precision for the measurement of Hcy, Cys, CysGly, and GSH in plasma
Thiols |
Within-day ( ± SD, μmol L−1) |
CV (%) |
Between-day ( ± SD, μmol L−1) |
CV (%) |
GSH |
0.332 ± 0.013 |
4.0 |
0.313 ± 0.025 |
8.0 |
9.55 ± 0.14 |
1.5 |
9.52 ± 0.49 |
5.2 |
22.5 ± 0.5 |
2.3 |
21.9 ±1.7 |
7.8 |
Cys |
1.99 ± 0.03 |
1.3 |
2.01 ± 0.09 |
4.4 |
290 ± 1 |
0.4 |
296.0 ± 7.6 |
2.6 |
1208 ± 21 |
1.7 |
1204 ± 57 |
4.8 |
Hcy |
0.0641 ± 0.0031 |
4.9 |
0.0660 ± 0.0055 |
8.3 |
10.2 ± 0.4 |
3.8 |
10.3 ± 0.4 |
4.1 |
118.1 ± 5.3 |
4.5 |
112.2 ± 5.6 |
5.0 |
CysGly |
0.0550 ± 0.0023 |
4.2 |
0.0568 ± 0.0033 |
5.8 |
27.0 ± 1.1 |
4.2 |
27.09 ± 1.21 |
4.5 |
61.9 ± 2.8 |
4.5 |
61.9 ± 2.7 |
4.4 |
3.4 Application
The assay was applied to the determination of the four plasma thiols in the total, free and reduced forms in 28 control subjects and 29 uremic patients before and after dialysis. The data are listed in Table 4. Compared with the controls, the concentrations of total, free and reduced forms of Hcy, Cys, and CysGly were increased, while the three forms of GSH were decreased, in the plasma of uremic patients before hemodialysis. The free forms of Hcy and Cys were increased markedly by 2.96 times and 2.60 times, respectively. There were significant decreases in the concentrations of the three fractions of Hcy and Cys in uremic patients after undergoing hemodialysis. The total, free and reduced fractions of Hcy were decreased by 53.6%, 48.1% and 51.9%, respectively. The total, free and reduced fractions of Cys were decreased by 56.5%, 81.5% and 23.8%, respectively. But there were no significant changes in the concentrations of the three fractions of GSH and CysGly in the plasma between the before hemodialysis (B HD) group and the after hemodialysis (A HD) group.
Table 4 Data for the total concentrations of Hcy, Cys, CysGly, and GSH, as well as for their reduced and free forms, in 28 control subjects and 29 uremic patients’ plasma before and after dialysisa
Components (μmol L−1) |
Before HD (n = 29) |
After HD (n = 29) |
Controls (n = 28) |
Before HD vs. controls |
After HD vs. controls |
Before HD vs. after HD |
NS, not significant. |
tGSH |
6.53 ± 2.63 |
6.55 ± 2.48 |
8.94 ± 1.49 |
<0.05 |
<0.05 |
NS |
fGSH |
2.81 ± 1.08 |
2.76 ± 1.09 |
5.29 ± 1.16 |
<0.05 |
<0.05 |
NS |
rGSH |
0.390 ± 0.215 |
0.391 ± 0.360 |
0.488 ± 0.296 |
<0.05 |
<0.05 |
NS |
tCys |
658 ± 148 |
286 ± 74 |
320 ± 44 |
<0.05 |
NS |
<0.05 |
fCys |
168.0 ± 67.8 |
31.0 ± 27.5 |
46.7 ± 13.1 |
<0.05 |
NS |
<0.05 |
rCys |
4.63 ± 2.06 |
3.53 ± 1.63 |
2.60 ± 0.96 |
<0.05 |
<0.05 |
<0.05 |
tHcy |
34.7 ± 16.4 |
16.1 ± 9.6 |
14.4 ± 5.1 |
<0.05 |
NS |
<0.05 |
fHcy |
9.78 ± 7.08 |
5.08 ± 2.99 |
2.47 ± 1.01 |
<0.05 |
<0.05 |
<0.05 |
rHcy |
0.074 ± 0.050 |
0.046 ± 0.030 |
0.047 ± 0.021 |
<0.05 |
NS |
<0.05 |
tCysGly |
31.3 ± 10.5 |
26.5 ± 10.9 |
20.9 ± 6.0 |
<0.05 |
<0.05 |
NS |
fCysGly |
8.89 ± 5.22 |
6.71 ± 4.08 |
10.5 ± 3.4 |
<0.05 |
<0.05 |
NS |
rCysGly |
0.115 ± 0.060 |
0.127 ± 0.082 |
0.074 ± 0.038 |
<0.05 |
<0.05 |
NS |
In this study, PCA was used to reveal the metabolic state of serum thiols in the B HD, A HD and control groups. The PCA scores plot of the first two components (PC1 vs. PC2), based on the three forms of GSH, Cys, Hcy and CysGly, is shown in Fig. 3. This plot illustrates that the B HD group could be distinguished from the A HD group, as well as the control, but that the A HD group and the healthy control group partially overlapped.
 |
| Fig. 3 The PCA scatter plot based on 12 forms of thiols in the plasma of 28 controls (+), 29 B HD patients (□) and 29 A HD patients (▲). | |
The metabolism of plasma thiols in uremic patients was found to be abnormal in this research. The total, free and reduced forms of Hcy, Cys and CysGly were increased markedly, especially the free forms of Hcy and Cys in uremic patients before hemodialysis compared to the controls, while the three forms of GSH were decreased, which was in agreement with earlier findings for patients undergoing hemodialysis.16 However, some previous studies demonstrated normal or elevated plasma glutathione levels in hemodialysis patients compared to healthy subjects.17 These discrepancies are likely due to the fact that plasma glutathione levels will elevate at even very small degrees of hemolysis since it is potentially primarily an intracellular antioxidant. The concentration of thiols in the uremic patients’ plasma changed dramatically after hemodialysis, but could not return to normal.
4. Conclusion
In conclusion, a novel HPLC assay method with fluorescence detection was developed to quantify not only the total concentrations of Hcy, Cys, CysGly, and GSH, but also the concentrations of their reduced and free forms in plasma. The method, using NPM for derivatization, is simple and sensitive enough for clinical determination of free and reduced GSH, Cys, Hcy, and CysGly. In addition, this method has been successfully applied to the analysis of plasma from uremic patients. The PCA scores plot of the first two components based on three forms of GSH, Cys, Hcy and CysGly illustrated that the group of uremic patients before hemodialysis could be distinguished from the control group.
Acknowledgements
The study has been supported by Shenzhen Nanshan District Science and Technology Bureau (no. 207030). We would like to thank Drs Zhengrong Li and Biao Xiu from the First Affiliated Hospital of Chongqing Medical University for the collection of samples.
Notes and references
- M. A. Mansoor, P. M. Ueland, A. Aarsland and A. M. Svardal, Metabolism, 1993, 42, 1481–1485 CrossRef CAS.
- R. H. Williams, J. A. Maggiore, R. D. Reynolds and C. M. Helgason, Clin. Chem., 2001, 47, 1031–1039 CAS.
- L. J. Hoffer, L. Robitaille, K. M. Elian, I. Bank, P. Hongsprabhas and O. A. Mamer, Kidney Int., 2001, 59, 372–377 CrossRef CAS PubMed.
- B. Sjöberg, B. Anderstam, M. Suliman and A. Alvestrand, Am. J. Kidney Dis., 2006, 47, 60–71 CrossRef PubMed.
- J. C. Chambers, P. M. Ueland, M. Wright, C. J. Dore, H. Refsum and J. S. Kooner, Circ. Res., 2001, 89, 187–192 CrossRef CAS.
- T. H. Yang, C. Y. Chang and M. L. Hu, Clin. Biochem., 2004, 37, 494–499 CrossRef CAS PubMed.
- J. C. Chambers, A. McGregor, J. Jean-Marie, O. A. Obeid and J. S. Kooner, Circulation, 1999, 99, 1156–1160 CrossRef CAS.
- E. Bald, G. Chwatko, R. Glowacki and K. Kusmierek, J. Chromatogr. A, 2004, 1032, 109–115 CrossRef CAS PubMed.
- R. A. Winters, J. Zukowski, N. Ercal, R. H. Matthews and D. R. Spitz, Anal. Biochem., 1995, 227, 14–21 CrossRef CAS PubMed.
- D. W. Jacobsen, V. J. Gatautis, R. Green, K. Robinson, S. R. Savon, M. Secic, J. Ji, J. M. Otto and L. M. Taylor Jr, Clin. Chem., 1994, 40, 873–881 CAS.
- P. Durand, L. J. Fortin, S. Lussier-Cacan, J. Davignon and D. Blache, Clin. Chim. Acta, 1996, 252, 83–93 CrossRef CAS.
- B. Vester and K. Rasmussen, Eur. J. Clin. Chem. Clin. Biochem., 1991, 29, 549–554 CAS.
- V. Rizzo, L. Montalbetti, M. Valli, T. Bosoni, E. Scoglio and R. Moratti, J. Chromatogr. B: Biomed. Sci. Appl., 1998, 706, 209–215 CrossRef CAS.
- J. Krijt, M. Vackova and V. Kozich, Clin. Chem., 2001, 47, 1821–1828 CAS.
- M. T. Anderson, J. R. Trudell, D. W. Voehringer, I. M. Tjioe and L. A. Herzenberg, Anal. Biochem., 1999, 272, 107–109 CrossRef CAS PubMed.
- B. Hultberg, A. Andersson and M. Arnadottir, Nephron, 1995, 70, 62–67 CrossRef CAS PubMed.
- J. Himmelfarb, E. McMenamin and E. McMonagle, Kidney Int., 2002, 61, 705–716 CrossRef CAS PubMed.
|
This journal is © The Royal Society of Chemistry 2014 |
Click here to see how this site uses Cookies. View our privacy policy here.