Green synthesis of biomimetic CePO4:Tb nanostructures using the simplest morphology control

P. Pusztaia, Á. Kukoveczab and Z. Kónya*ac
aDepartment of Applied and Environmental Chemistry, University of Szeged, Rerrich Béla tér 1, H-6720 Szeged, Hungary. E-mail: konya@chem.u-szeged.hu
bMTA-SZTE “Lendület” Porous Nanocomposites Research Group, Rerrich Béla tér 1, H-6720 Szeged, Hungary
cMTA-SZTE Reaction Kinetics and Surface Chemistry Research Group, Rerrich Béla tér 1, H-6720 Szeged, Hungary

Received 9th September 2014 , Accepted 30th September 2014

First published on 30th September 2014


Abstract

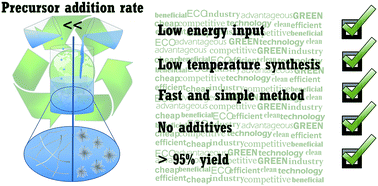
A simple, environmentally and economically benign, scalable synthesis was developed for the production of micrometer long hexagonal cerium phosphate nanowires, complex urchin-like nanostructures and their terbium-doped counterparts. It was proven that neither sophisticated equipment nor structure directing agents or pH adjustment or tedious procedures are necessary, because the precise regulation of precursor addition rate is sufficient to control the morphology of the product nanostructures. Nanowires and nanourchins can be obtained by the instantaneous vs. drop-wise addition of phosphoric acid to an aqueous cerium nitrate solution, respectively. Terbium doping is readily achieved by dissolving a calculated amount of terbium nitrate in the precursor solution. Spherulitic lanthanide phosphate nanostructure formation mechanisms offered in the literature were critically reviewed and assessed against our experimental findings obtained by studying the sonochemical disintegration of nanourchins. Terbium doping introduced green luminescence and slowed down the temperature induced hexagonal to monoclinic phase transition of cerium phosphate.

1. Introduction

Rapid technological evolution in the past decades could not have been realized without the development of new advanced materials. The controlled preparation and design of functional nanomaterials opened new frontiers for our technological, industrial and medical evolution. Complex 3D nanoarchitectures (nanowire bundles, urchins, flowers etc.) have attracted great attention due to their superior properties for instance in the field of toxic cation removal,1–3 gas sensing,4 high performance energy storage devices,5 pseudocapacitors or photoluminescent devices.6 Many advanced technologies are available for the preparation of precisely designed nanomaterials, however, most of these are rather time- and energy-intensive. The development of simple, fast and cheap synthetic methods is essential for facilitating the industrial and medical application of the novel materials.7

The industrial relevance of lanthanide phosphates is well known since the end of the nineteenth century when they were mined as monazite sand for their extractable lanthanide content. Green and efficient methods were developed later for the extraction of lanthanides for use in e.g. samarium–cobalt permanent magnets or nickel metal hydride (NiMH) batteries.8 In the past decades a revived attention has been focused on their preparation, characterization and application. Lanthanide phosphates are considered to be a versatile family of rare-earth compounds possessing potential applications in the fields of luminescent materials,9–11 sensors,12,13 catalysis,14–18 nuclear waste treatment,19 heat-resistant materials,20 biological labeling,21 proton conductors in solid oxide fuel cells (SOFCs)22 and photon up-conversion materials.23

Various synthetic procedures were developed for the preparation of one-dimensional lanthanide phosphates in general and cerium phosphate nanomaterials in particular, such as microemulsion,24 sol–gel,25 sonochemical,26–29 biological30 and microwave assisted methods.31 Anisotropic growth is achieved by taking advantage of the natural crystallographic features of the material. Hydrothermal synthesis appears to be the most widespread technique in the literature.20,32–48 A wet chemical synthesis was applied by Wang and Gao to prepare short rhabdophane rare-earth phosphate nanorods at 100 °C,49 while Yang and co-workers investigated the effect of reaction temperature on nanowire length in water–ethanol medium.50 A simple room temperature synthesis was developed by Di and co-workers for Tb-doped CePO4 nanorods. By this method only 50–100 nm long nanorods could be obtained and additional pH adjustment was also required.13 An innovative technique was suggested by Fang and co-workers who prepared doped LaPO4 nanorods by using two different microfluidic platforms.51 However, most of the available methods are rather complicated52 or involve relatively high temperatures,53 structure directing agents54 or long synthesis times up to 40 days.55

Several studies were published on the preparation of cerium phosphate nanowires but only few can be found on the controlled synthesis of complex 3D nanoarchitectures. After Bu and co-workers demonstrated that LnPO4 microarchitectures could exhibit enhanced photoluminescent properties56 a new line in LnPO4 nanostructure research was opened. For instance Liu and co-workers developed a layer-by-layer deposition method for the synthesis of urchin-like nanostructures.57 This process was unfeasible without the application of a properly surface modified substrate and 30 cycles of a five-step synthesis routine had to be performed to obtain the desired nanostructures. Li and co-workers used β-cyclodextrin as a structure directing agent in their synthesis to promote the anisotropic growth of nanowires.58 Their experiments on the role of β-cyclodextrin revealed that the addition of a structure directing agent is essential for the formation of nanowires, as only irregularly shaped, short rods were formed in the absence of β-cyclodextrin. Recently, a template-mediated room temperature procedure was developed by Zhang and Wong. An U-shaped tube divided by a porous polycarbonate membrane was applied to fabricate sheaf-like complex nanostructures and nanowires with high aspect ratio.21 A soft-template assisted microemulsion system was also developed by Chall and co-workers.59 In the above-mentioned methods structure directing agents, templates or tedious procedures were necessary to yield the proper structure and this could limit their utility in large scale nanostructure production.

We suggest that it is possible to achieve adequate morphology control over cerium phosphate nanostructures simply by controlling the fundamental synthesis conditions. To prove this concept, in this contribution we present a simple, fast, scalable, environmentally and economically benign synthesis route for terbium-doped cerium phosphate nanowires and urchin-like nanoarchitectures. Our goal was to keep the synthesis as simple as possible and to prove that the application of capping agents, surfactants, templates, pH pre-adjustment or complicated synthesis routines is not essential for the preparation of complex nanostructures. Rather, the careful adjustment of precursor concentration and a properly chosen admixture rate of solutions are sufficient to determine the morphology of the product. To the best of our knowledge only little information can be found in the literature on the formation mechanism and stability of urchin-like cerium phosphate nanostructures. Therefore, additional experiments were carried out to understand their evolution process better under mild and structural behavior under high temperature conditions, respectively.

2. Experimental

2.1. Materials

All reagents were of analytical grade and used without further purification. Cerium(III) nitrate hexahydrate and terbium(III) nitrate pentahydrate were purchased from Sigma-Aldrich. Phosphoric acid and absolute ethanol were purchased from Molar Chemicals Ltd.

2.2. Preparation of CePO4 nanowires/nanourchins

For the preparation of long CePO4 nanowires and urchin-like structures at room temperature 1.1 ml H3PO4 (85%) and 3.472 g Ce(NO3)3 × 6H2O (≥99.0%) were dissolved in 80 and 240 ml of distilled water, respectively. Diluted phosphoric acid (abbreviated as PO4 in the text) was added to the cerium nitrate solution (abbreviated as Ce in the text) in two different manners depending on the desired nanostructures to be prepared. Urchin-like structures were formed by the instantaneous addition of phosphoric acid, whereas long nanowires could be obtained only when dropwise addition was carried out for 3 hours. After the complete addition of phosphoric acid the suspension was further stirred for 20 minutes. The obtained product was separated by centrifugation and purified by washing with distilled water and ethanol thoroughly. The metal content of the combined washing phases was 9 × 10⁻² mmol × dm−3 for cerium and 10−2 mmol × dm−3 for terbium ions (analyzed by ICP-MS). The CePO4 yield was calculated independently from the dry product mass and from the residual cerium contents of the washing fluids. Both methods confirmed a yield above 95% for all synthesized CePO4 nanomaterials.

2.3. Preparation of Ce0.9Tb0.1PO4 nanostructures

Terbium-doped CePO4 nanowires and nanourchins were prepared in a way similar to the pristine ones. The amount of cerium nitrate was reduced to 3.126 g and 0.348 g of Tb(NO3)3 × 5H2O (99.9%) was added to the cerium–nitrate solution to ensure a 9[thin space (1/6-em)]:[thin space (1/6-em)]1 Ce[thin space (1/6-em)]:[thin space (1/6-em)]Tb ratio. The samples were purified in the same way as their undoped counterparts. The yield calculated from the lanthanide content of the washing fluids (analyzed by ICP-MS) was more than 90% for all terbium-containing nanostructures.

2.4. Characterization

The morphology of nanostructures was investigated by using a FEI TECNAI G2 20 X-Twin transmission electron microscope (TEM) working at an accelerating voltage of 200 kV. The samples were drop-casted onto carbon coated copper grids from ethanol suspension. The crystal structure of the samples was examined at ambient temperature using a Rigaku Miniflex II diffractometer equipped with a Cu Kα radiation source. The purity and elemental composition content of the samples were verified by energy dispersive X-ray spectroscopy in a HITACHI S-4700 Type II cold field emission scanning electron microscope (SEM) instrument operated at 10 or 20 kV accelerating voltage with an integrated Röntec QX2 EDS detector. Samples were mounted on double-sided adhesive carbon tape. Nitrogen adsorption analysis was carried out in a Quantachrome NOVA 3000e surface area and pore size analyzer instrument. The samples were vacuum degassed at 200 °C for 2 h prior to the measurement. The pH was measured during the synthesis by a JENWAY 3540 pH and conductivity meter. Thermogravimetric measurements were carried out on a Setaram Labsys thermoanalytical instrument in synthetic air. For sonochemical treatments a Hielscher UIP1000hd ultrasonic homogenizer was employed operating at 20 kHz on 30% amplitude, equipped with B2-1.8 type booster in booster position and a BS2d22 type sonotrode. Photoluminescence properties of terbium-doped nanostructures suspended in methanol (0.01 wt%) were determined by a Hitachi F-4500 fluorometer using an excitation wavelength of 286 nm and 5 nm excitation and emission slits. The fluorescence quantum yield of Ce0.9Tb0.1PO4 nanostructures was estimated by using Rhodamine B as a fluorescent standard possessing a luminescent quantum yield of 70% in ethanol.60

3. Results and discussion

3.1. General characterization of the nanostructures

TEM examination of the as-prepared CePO4 nanostructures indicated that even a simple parameter like precursor addition rate could significantly alter the morphological features of the developing nanostructures (Fig. 1). The instantaneous addition of phosphoric acid to the cerium nitrate solution promoted the spontaneous formation of urchin-like structures made up of 4–8 nm thick nanorods radiating from the center and possessing an average length of 100–200 nm. Reducing the addition rate of phosphoric acid while other parameters were kept unchanged induced the formation of micrometer long nanowires and nanowire bundles instead of nanourchins. An XRD study confirmed that both terbium-doped and pristine nanostructures were of a pure hexagonal phase with a lattice constant of a = 7.055 Å and c = 6.439 Å (JCPDS File no. 74-1889) (Fig. 2A). The Lorentz fit of the most intensive peaks of (200) and (102) of the Tb-doped samples revealed a ∼0.1° shift in peak positions indicating the incorporation of terbium atoms into the cerium phosphate crystal structure (Fig. 2B). The terbium content of the samples was confirmed by EDS; the desired dopant ratio was achieved in both terbium-doped samples. For terbium doped nanowires the Ce[thin space (1/6-em)]:[thin space (1/6-em)]Tb atomic percent was 91[thin space (1/6-em)]:[thin space (1/6-em)]9, while for nanourchins this ratio proved to be 89[thin space (1/6-em)]:[thin space (1/6-em)]11 (Fig. 2C and D), which correlate well with the desired 9[thin space (1/6-em)]:[thin space (1/6-em)]1 ratio. The exact elemental composition of the samples was determined by examining the cerium, terbium and phosphorous (Ce[thin space (1/6-em)]:[thin space (1/6-em)]Tb[thin space (1/6-em)]:[thin space (1/6-em)]P) content of the samples. The obtained atomic percentages of 44.7[thin space (1/6-em)]:[thin space (1/6-em)]4.2[thin space (1/6-em)]:[thin space (1/6-em)]51.1 for nanowires and 43.1[thin space (1/6-em)]:[thin space (1/6-em)]4.9[thin space (1/6-em)]:[thin space (1/6-em)]52.1 for nanourchins correlated well with the expected theoretical composition of Ce0.9Tb0.1PO4.
image file: c4ra10089a-f1.tif
Fig. 1 TEM images of pristine (A and C) and terbium-doped (B and D) cerium phosphate nanostructures prepared under ambient reaction conditions.

image file: c4ra10089a-f2.tif
Fig. 2 X-ray diffraction patterns of pristine (Ø) and terbium-doped (Tb) cerium phosphate nanowires (NW) and nanourchins (NU) of hexagonal crystal structure. Lorentz fit of (200) and (102) peaks indicated a slight shift towards higher 2θ values demonstrating the incorporation of terbium ions into the crystal lattice (A). EDS spectra showed an elemental composition of Ce, P and O for all samples. In the case of terbium-doped samples additional Tb peaks could be clearly detected. The Ce[thin space (1/6-em)]:[thin space (1/6-em)]Tb atomic percent was 91[thin space (1/6-em)]:[thin space (1/6-em)]9 for nanowires and 89[thin space (1/6-em)]:[thin space (1/6-em)]11 for nanourchins (B).

Nitrogen adsorption measurements revealed a specific surface area of 144 and 125 m2 g−1 for pristine and terbium-doped nanowires, respectively, and 168 m2 g−1 for both pristine and terbium-doped nanourchins. It is noteworthy that only a few studies have been published so far on the preparation of CePO4 nanostructures with similarly high specific surface area (SSA) values. Furthermore, those nanostructures were prepared by more complicated methods with the aid of chemical additives and/or they were more rod-like instead of featuring a nanowire morphology.16,25

3.2. Factors influencing the nanowire/nanourchin formation

Potentially influential parameters of the synthesis like precursor addition rate, Ce[thin space (1/6-em)]:[thin space (1/6-em)]PO4 ratio and reversed addition were tested to examine their contribution to the development of nanowire or nanourchin structure. The effect of varying Ce[thin space (1/6-em)]:[thin space (1/6-em)]PO4 molar ratios was investigated by applying three different PO4 and Ce concentrations in two series by fixing first Ce and then PO4 concentrations. In the case of nanowires, a varying PO4 molar ratio combined with fixed cerium nitrate concentration caused conspicuous change only at 1[thin space (1/6-em)]:[thin space (1/6-em)]1 molar ratio where only short nanorods were formed (Fig. S1A), while in the case of 1[thin space (1/6-em)]:[thin space (1/6-em)]4 Ce[thin space (1/6-em)]:[thin space (1/6-em)]PO4 molar ratio (Fig. S1E) no significant changes were observed. The variation of cerium amount at fixed phosphoric acid concentration caused only slight changes in the nanowire samples. At 1[thin space (1/6-em)]:[thin space (1/6-em)]4 Ce[thin space (1/6-em)]:[thin space (1/6-em)]PO4 molar ratio (Fig. S2E) no significant changes could be observed in the product, while in the case of 1[thin space (1/6-em)]:[thin space (1/6-em)]1 molar ratio (Fig. S2A) nanourchin aggregates remained in the sample. These aggregates are residues from the initial stage of nanowire formation process.

Neither low nor high phosphate concentration was favorable for the development of nanourchins. At 1[thin space (1/6-em)]:[thin space (1/6-em)]1 Ce[thin space (1/6-em)]:[thin space (1/6-em)]PO4 molar ratio and fixed cerium concentration (Fig. S1B) mainly nanorod aggregates were formed in the absence of fully developed nanourchins. The increase in the Ce[thin space (1/6-em)]:[thin space (1/6-em)]PO4 ratio (Fig. S1F) caused a slight reduction in their diameter while their integrity deteriorated significantly compared to the sample prepared at 1[thin space (1/6-em)]:[thin space (1/6-em)]2 Ce[thin space (1/6-em)]:[thin space (1/6-em)]PO4 ratio. An interesting observation was made when the ratio of cerium was varied at a fixed phosphoric acid concentration: when using a large amount of Ce (1[thin space (1/6-em)]:[thin space (1/6-em)]1 Ce[thin space (1/6-em)]:[thin space (1/6-em)]PO4) only short nanorods were observed in the product, that is, no nanourchins were formed (Fig. S2B). However, when using a smaller amount of Ce (1[thin space (1/6-em)]:[thin space (1/6-em)]4 Ce[thin space (1/6-em)]:[thin space (1/6-em)]PO4) nanourchins were readily obtained (Fig. S2F).

The effect of phosphoric acid addition rate was also studied by testing three different dropping velocities (Fig. S3). When phosphoric acid was added most rapidly (within 1 h) only short nanorods were formed. Slowing the dropping rate down (3 h) resulted in longer nanowires. A further decrease in the dropping rate (6 h) did not have any additional effect on nanowire length or structure.

To get more detailed information about the potential key factors of nanostructure formation the reversed addition of precursors was also tested (Fig. S4). In the case of nanowires highly bundled and aggregated structures were developed, while nanourchins exhibited a nearly ideal morphology. However, their integrity was unsatisfactory as many incomplete and fragmented nanourchins were found in the product.

Summarizing, a 1[thin space (1/6-em)]:[thin space (1/6-em)]2 Ce[thin space (1/6-em)]:[thin space (1/6-em)]PO4 ratio (with an addition rate of 3 h in the case of nanowires) and the addition sequence of phosphoric acid to cerium nitrate were the most favorable for both nanowire and nanourchin formation. The fundamental product morphology is determined by the way how the precursor are mixed (instantly vs. slowly), and the other parameters investigated above can be utilized for fine tuning the synthesis.

3.3. Formation mechanism of nanourchins

Literature studies about urchin-like structures generally identify them as spherulites. The exact growth mechanism of these exotic nanostructures has not been elucidated yet.61–63 The first attempts to explain the evolution of natural spherulitic crystals were published in the early 20th century. Maleev summarized these theories in his study on the crystal splitting mechanism of chalcedony.64 As a summary, three models were hypothesized for the formation of spherulites: (1) metacolloids, based on the surface tension at the interface between the gel (deposited from solution) and the solution itself, (2) the simultaneous growth of several nuclei towards all directions from one center, and (3) the continuous splitting and deflection of the spilt branches of a crystal at both ends. Based on recent publications on nanosized inorganic spherulites the seeding then radiating (2) and the crystal splitting models (3) seemed to be the most feasible to explain the formation of our nanourchins. Both mechanisms occur only when appropriate chemical and physical circumstances are insured during crystal growth. Crystal splitting is preferential when fast crystal growth occurs, initiating the development of defects along the growth direction. Kelly and co-workers suggested that crystal splitting might commence due to the formation of defects in their iron phosphide system.65 According to their observations the introduction of even a few microliters of alkanes into the reaction solution containing an appropriate amount of surfactants can drastically enhance the splitting of crystals, leading to the formation of dumbbell, haystack and spherulite nanostructures. Another important observation was made by Tang and Alivisatos in their Bi2S3 system, where the injection temperature of the precursor was varied in the absence of organic additives or surfactants to enhance crystal splitting.66 Intensified splitting could be achieved at a lower injection temperature due to the smaller amount of seeds formed and the higher rate of crystal growth compared to higher temperatures.

The seeding and radiating theory is an alternative spherulite formation mechanism. Wang and Gao suggested this mechanism to explain the formation of their LaPO4 nanorod system.49 Radiating aggregates were also observed at the initial stage of their synthesis, though these structures were stable only for 1 minute at 100 °C. Pursuant to this theory a considerable amount of seeds appeared and aggregated at the very early stage of the synthesis. Fast anisotropic crystal growth then commenced from these aggregates due to auspicious chemical environment eventuated in the development of urchin-like structures. An interesting observation was made by Zhong and Chu: the growth of CaCO3 spherulites aided by maleic chitosan eventuated from an amorphous core.67 Tao and co-workers investigated the formation of hydroxyapatite spherulites. They suggested a complex mechanism including the initial aggregation of amorphous calcium phosphate particles and the radial extension of hydroxyapatite nanoneedles from its surface by Kirkendall effect. As the reaction was terminated hollow hydroxyapatite spherulites were formed.68

Each aforementioned mechanism could provide a feasible explanation for the formation of a spherulite structure. Considering the growth habit of crystals during these mechanisms, fairly different core structures can be assumed. Spherulites evolved by seeding and radiating process may exhibit a loose structured core consisting of aggregated seed residues. Nonetheless, it is also possible that a hollow core is formed as a result of a more complex process. For spherulites developed by crystal splitting a much more robust core could be hypothesized consisting of a multi-split crystal in the center.69–71

Since the fast crystal growth of nanourchins rendered the continuous monitoring of their growth process very difficult, the following approach was taken to decide about the most likely formation mechanism of cerium phosphate nanourchins under our experimental conditions. The urchin-like architectures were disintegrated ultrasonically to gain insight into the morphology of their core structure. Introducing ultrasound into a liquid medium induces the emergence and collapse of bubbles accompanied by enormous local temperature (>5000 K) and pressure (>20 MPa) variations in the distinct volume surrounding the collapsing bubbles.28,72,73 The energy released during this cavitation process can be exploited for the demolition of fully developed nanostructures. In our study ultrasound irradiation was applied for 20 minutes and the mixture was sampled in every minute for TEM. Disintegration of nanourchins started right after 1 minute of ultrasound irradiation and was completed in 20 minutes (Fig. 4). Characteristic TEM images showing an intermediate stage of nanourchin disintegration were captured after 10 minutes of sonication. Fig. 4D and E represent the inner structure of an opened-up nanourchin. A closer look at the central region by HRTEM revealed some residues that remained from the initially formed randomly oriented seed aggregates. The FESEM image of an opened up nanourchin demonstrated that our spherulites had a closely packed core structure (Fig. 4F). According to this observation neither the crystal splitting nor the multi-step development mechanism suggested by Tao and co-workers could be confirmed for our system, because neither of these mechanisms is able explain the core morphology visible in Fig. 4F. Consequently, the seeding and radiating mechanism proposed by Wang and Gao appears to be the most likely formation mechanism of cerium phosphate nanourchins grown under our experimental conditions.

It is worth noting that no crystal growth occurred during the sonochemical treatment of the nanourchins. In fact, only nanorods shorter than the initial constituent quills of the nanourchins and their aggregates could be identified after sonication. This observation contradicts the generally accepted theory that regards sonochemistry as a useful method for the preparation of one-dimensional nanocrystals in general and lanthanide phosphate nanorods in particular.27–29

3.4. Formation mechanism of nanowires

In order to gain more insight into the growth mechanism of nanowires a time dependent synthesis was performed. During the dropwise addition of phosphoric acid to the cerium nitrate solution continuous pH monitoring supplemented by periodic sampling for TEM was performed (Fig. 3). The initial pH of the cerium nitrate solution was 5.2. Ten drops of H3PO4 initiated the instantaneous formation of nanourchin precipitate while the pH dropped to 3.3 (Fig. 3A). Further phosphoric acid addition (20 drops) reduced the pH to 2.8, resulted in the disintegration of the urchin-like nanostructures and promoted the elongation of the nanowires (Fig. 3B). Samples taken between 40 and 180 minutes showed that the detached nanorods grew longer as the reaction proceeded, while the pH decreased to 1.1 by the end of the synthesis (Fig. 3C and D). It is worth noting that previous studies reported that only the narrow pH range of 0.5–1.6 was adequate for nanowire growth.37 Since initial pH adjustment was not applied in our case, the obtained pH profile clearly demonstrates that the pH drops rapidly to the favorable range at the very beginning of the synthesis, thus providing an appropriate chemical environment for nanowire growth.
image file: c4ra10089a-f3.tif
Fig. 3 TEM images on the successive growth of hexagonal cerium phosphate nanowires obtained by periodic sampling. “Quills” of initially formed nanourchins (A) are continuously elongated then detached (B). The longitudinal growth of nanorods commenced with prolonged synthesis time (C and D).

image file: c4ra10089a-f4.tif
Fig. 4 Indirect examination of spherulite structure development by time-resolved TEM investigation of sonochemically treated nanourchins. Nanourchins started to break up already after 1 minute of ultrasound irradiation (A) and the process was completed after 20 minutes (C). An intermediate stage appeared after 10 minutes of ultrasonic irradiation (B) when an opened-up structure was captured (D) demonstrating the viability of the seeding and radiating theory based on the observable randomly oriented seed aggregates (E). FESEM image of a semi-opened nanourchin represented a closely packed core structure (F).

Similar observations were made by Qian and co-workers in their extremely slow room temperature precipitation synthesis.55 In the first three days aggregated nanoparticles were formed which had later grown into long nanowires with extending ripening time. Urchin-like structures appeared after 7 days. The pH and precursor concentration were kept constant during their synthesis providing an appropriate chemical environment for the so-called dissolution/recrystallization process. Compared to Qian and co-workers' method, our procedure was able to speed the synthesis up remarkably (from 40 days to 3 hours) by dynamically changing the pH and the precursor concentration.

Most of the studies published on the preparation of CePO4 nanowires refer to the dissolution/recrystallization process25,37,49,55 as the most feasible growth mechanism. In our room temperature synthesis the dissolution of nanocrystals is not essential for the growth of nanowires because of the continuous supply of the phosphate precursor, hence the progressive growth of nanowires is possible during the entire synthesis.

The anisotropic growth of hexagonal cerium phosphate nanowires can be explained on structural grounds following the work of Murphy et al.74 CePO4 nanowires consist of alternating cerium and phosphate ions arranged into infinite linear chains along the c-axis. The bonding between these chains is weaker than the bonding within the chains themselves. Consequently, the activation energy required for growth along the c-axis is lower than that required for growth perpendicular to the c-axis. As a result, the elongation of nanoparticles is thermodynamically favorable compared to isotropic growth.

3.5. Phase transition and thermal stability test

To date only hydrothermal methods were published for the preparation of various types of micrometer sized monoclinic lanthanide phosphate 3D nanostructures.36,75 To the best of our knowledge there is a lack of information in the literature on the thermal stability and phase transition of hexagonal nanourchins to a monoclinic structure. It was demonstrated in our previous study that hexagonal cerium phosphate nanowires can transform into monoclinic phase at 600 °C in 1 hour.76 The same behavior was observed in the case of hexagonal nanourchins under these conditions (Fig. 5). Interestingly, doping these nanostructures with terbium ions slowed the phase transition process down as the heat treated nanowire sample still exhibited some characteristic hexagonal peaks even after 5 hours (Fig. 6B) of annealing at 600 °C. For the proper recrystallization of both types of terbium-doped nanostructures the heat treatment had to be extended to 8 hours. To intensify the effects of heat treatment, the nanostructures were subjected to repetitive heat shock by taking them out from the 600 °C furnace to 25 °C every second hour. On each occasion when the samples were removed from the furnace, the ambient thermal equilibrium was allowed to be achieved, then annealing at 600 °C was resumed. TEM images proved that both nanowires and nanourchins could preserve their morphology even under these harsh conditions (Fig. 7). After 8 hours the phase transition of nanostructures was complete as confirmed by X-ray diffractometry (Fig. 6) indicating a pure monoclinic crystal structure with a lattice constant of a = 6.777 Å, b = 6.993 Å and c = 6.445 Å (JCPDS File no. 84-0247).
image file: c4ra10089a-f5.tif
Fig. 5 X-ray diffraction patterns of pristine (Ø) and heat treated (HT) pristine cerium phosphate nanowires (NW) and nanourchins (NU). After 1 hour at 600 °C the samples completely recrystallized from hexagonal to monoclinic crystal structure.

image file: c4ra10089a-f6.tif
Fig. 6 X-ray diffraction patterns of as-prepared and heat-treated (HT) terbium-doped (Tb) cerium phosphate nanowires (NW) and nanourchins (NU). After 8 hours at 600 °C the samples completely recrystallized from hexagonal to monoclinic crystal structure (A). Part B depicts a characteristic intermediate stage of the annealing process. After 5 hours the (100) reflection characteristic of the hexagonal phase was still observable in the terbium-doped samples indicating an incomplete recrystallization.

image file: c4ra10089a-f7.tif
Fig. 7 TEM images of thermally treated samples at 600 °C for 8 hours represented a good structural stability for both nanourchins (A) and nanowires (B) even under repeated thermal shock conditions.

3.6. Photoluminescence test

The photoluminescence spectra of as-prepared and heat treated terbium-doped samples were recorded at room temperature. Fig. 8 demonstrates that green luminescent nanostructures could be also prepared by our simple preparation method. The characteristic 5D47FJ transitions of Tb3+ can be clearly observed in the spectra at 490 (7F6), 544 (7F5), 587 (7F4) and 621 nm (7F3).77 The 7F4 transition was largely masked by the second-order scattered radiation of the excitation light. Luminescence intensity was much higher for as-prepared samples than for the heat-treated ones (by approx. a factor of ×9 and ×6 for nanowires and nanourchins, respectively), and as-prepared nanowires exhibited 13–22% higher intensity (depending on wavelength) emissions than their nanourchin counterparts. Interestingly, heat-treated samples showed an opposite trend since nanourchins had higher (approx. 19–25% depending on wavelength) luminescence intensity than nanowires in this case. The estimated fluorescence quantum yields for as-prepared nanourchins and nanowires were 37% and 40%, respectively.
image file: c4ra10089a-f8.tif
Fig. 8 Photoluminescent spectra of as-prepared and heat-treated (HT) terbium-doped (Tb) nanourchins (NU) and nanowires (NW). After heat treatment for 8 hours the luminescent intensity decreased but remained observable. The inset depicts the appearance of 5D37FJ (J = 6, 5, 4) transitions in the monoclinic phase.

The difference in the emission intensities of as-prepared samples can be explained by the different amount of structural water present in hexagonal samples that could effectively quench Tb3+ emission.78,79 The structural water content obtained by thermogravimetric measurements was approximately 1.8 wt% for nanowires and 2.6 wt% for nanourchins. The marked decrease in luminescent intensity after heat treatment at 600 °C for 8 h can be explained by the partial oxidation of Ce3+ to Ce4+. Previous reports proved that even a small amount of Ce4+ could quench Tb3+ emission through the prohibition of energy transfer between Ce3+ and Tb3+, as energy transfer between Ce3+ and Ce4+ becomes more favorable in the presence of Ce4+.58,77,80 It is interesting that after heat treatment the weak blue emission bands related to 5D37FJ transitions at 384 (7F6), 416 (7F5), 438 nm (7F4) appeared in accordance with previous studies on heat treated Tb-doped materials.81 Several options exist to improve the photoluminescence properties such as the preparation of a core–shell structure or heat treatment under inert atmosphere to prevent the oxidation of Ce3+. These investigations are a part of our forthcoming experiments.

4. Conclusion

In this study a simple, cost-effective, scalable synthesis route for luminescent terbium-doped hexagonal cerium phosphate nanowires and nanourchins was established. It was proved that the application of tedious procedures, structure directing agents, substrates or organic additives is not necessary for the preparation of these nanostructures, since a properly chosen admixture rate can effectively determine their morphology. The formation mechanism of nanourchins had not been entirely elucidated yet; hence the unconventional approach of ultrasound-induced disintegration was taken to support one of the available theories. The closely packed structure observed in the opened nanourchin core renders the seeding and radiation formation mechanism the most likely under our experimental conditions. Terbium-doped nanowires and nanourchins were subjected to heat treatment at 600 °C to examine their structural stability and hexagonal to monoclinic phase transition. Both morphologies were conserved well, but terbium-doped samples exhibited better stability against phase transition than pristine samples. While pristine nanostructures recrystallized in only 1 hour, it took 8 hours to complete the phase transition of terbium-doped samples under the same conditions. Both hexagonal and monoclinic terbium-doped cerium phosphate nanostructures exhibited green luminescence from which hexagonal nanourchins and nanowires possessed 37% and 40% quantum yields, respectively. These results indicate that cerium phosphate nanowires and nanourchins of tunable luminescence intensity can be synthesized by a simple, fast, scalable method which is significantly less material- and energy-intensive than competitive methods published in the literature before.

Acknowledgements

The financial support of the TÁMOP-4.2.2.A-11/1/KONV-2012-0047, TÁMOP 4.2.4.A/2-11-1-2012-0001 and OTKA NN 110676 projects is acknowledged.

References

  1. B. Wang, H. Wu, L. Yu, R. Xu, T.-T. Lim and X. W. Lou, Adv. Mater., 2012, 24, 1111–1116 CrossRef CAS PubMed.
  2. X. Wang, H. Huang, B. Liu, B. Liang, C. Zhang, Q. Ji, D. Chen and G. Shen, J. Mater. Chem., 2012, 22, 5330–5335 RSC.
  3. J. Qu, C.-Y. Cao, Y.-L. Hong, C.-Q. Chen, P.-P. Zhu, W.-G. Song and Z.-Y. Wu, J. Mater. Chem., 2012, 22, 3562–3567 RSC.
  4. J. Chao, X. Xu, H. Huang, Z. Liu, B. Liang, X. Wang, S. Ran, D. Chen and G. Shen, CrystEngComm, 2012, 14, 6654–6658 RSC.
  5. B. Liu, X. Wang, B. Liu, Q. Wang, D. Tan, W. Song, X. Hou, D. Chen and G. Shen, Nano Res., 2013, 6, 525–534 CrossRef CAS PubMed.
  6. Q. Wang, B. Liu, X. Wang, S. Ran, L. Wang, D. Chen and G. Shen, J. Mater. Chem., 2012, 22, 21647–21653 RSC.
  7. J. M. Patete, X. Peng, C. Koenigsmann, Y. Xu, B. Karn and S. S. Wong, Green Chem., 2011, 13, 482–519 RSC.
  8. T. Vander Hoogerstraete and K. Binnemans, Green Chem., 2014, 16, 1594–1606 RSC.
  9. K. Riwotzki, H. Meyssamy, H. Schnablegger, A. Kornowski and M. Haase, Angew. Chem., Int. Ed., 2001, 40, 573–576 CrossRef CAS.
  10. K. Kömpe, H. Borchert, J. Storz, A. Lobo, S. Adam, T. Möller and M. Haase, Angew. Chem., Int. Ed., 2003, 42, 5513–5516 CrossRef PubMed.
  11. F. Meiser, C. Cortez and F. Caruso, Angew. Chem., Int. Ed., 2004, 43, 5954–5957 CrossRef CAS PubMed.
  12. D. Weihua, W. Xiaojun and R. Xinguang, Nanotechnology, 2010, 21, 075709 CrossRef PubMed.
  13. D. Weihua, S. Naoto, Z. Haibo and S. Yoshio, Nanotechnology, 2010, 21, 365501 CrossRef PubMed.
  14. Y. Takita, K.-I. Sano, T. Muraya, H. Nishiguchi, N. Kawata, M. Ito, T. Akbay and T. Ishihara, Appl. Catal., AAppl. Catal., A, 1998, 170, 23–31 CrossRef CAS.
  15. Y. Takita, X. Qing, A. Takami, H. Nishiguchi and K. Nagaoka, Appl. Catal., A, 2005, 296, 63–69 CrossRef CAS PubMed.
  16. Y. Zhang, J. Wang and T. Zhang, Chem. Commun., 2011, 47, 5307–5309 RSC.
  17. H. Onoda, H. Nariai, A. Moriwaki, H. Maki and I. Motooka, J. Mater. Chem., 2002, 12, 1754–1760 RSC.
  18. F. Romero-Sarria, M. I. Domínguez, M. A. Centeno and J. A. Odriozola, Appl. Catal., B, 2011, 107, 268–273 CrossRef CAS PubMed.
  19. M. Rappaz, M. M. Abraham, J. O. Ramey and L. A. Boatner, Phys. Rev. B: Condens. Matter Mater. Phys., 1981, 23, 1012–1030 CrossRef CAS.
  20. H. Meyssamy, K. Riwotzki, A. Kornowski, S. Naused and M. Haase, Adv. Mater., 1999, 11, 840–844 CrossRef CAS.
  21. F. Zhang and S. S. Wong, ACS Nano, 2009, 4, 99–112 CrossRef PubMed.
  22. M.-V. Le, D.-S. Tsai, C.-Y. Yang, W.-H. Chung and H.-Y. Lee, Electrochim. Acta, 2011, 56, 6654–6660 CrossRef CAS PubMed.
  23. S. Heer, O. Lehmann, M. Haase and H.-U. Güdel, Angew. Chem., Int. Ed., 2003, 42, 3179–3182 CrossRef CAS PubMed.
  24. Y. Xing, M. Li, S. A. Davis and S. Mann, J. Phys. Chem. B, 2005, 110, 1111–1113 CrossRef PubMed.
  25. K. Rajesh, P. Mukundan, P. K. Pillai, V. R. Nair and K. G. K. Warrier, Chem. Mater., 2004, 16, 2700–2705 CrossRef CAS.
  26. S. S. Brown, H.-J. Im, A. J. Rondinone and S. Dai, J. Colloid Interface Sci., 2005, 292, 127–132 CrossRef CAS PubMed.
  27. C. Yu, M. Yu, C. Li, X. Liu, J. Yang, P. Yang and J. Lin, J. Solid State Chem., 2009, 182, 339–347 CrossRef CAS PubMed.
  28. Z. Ling, L. Xiaoming, L. Xiangdong, L. Qin, L. Jiayan, Z. Siyuan, M. Jian and C. Xueqiang, Nanotechnology, 2006, 17, 4217 CrossRef PubMed.
  29. W. Yu, G. Li and L. Zhou, J. Rare Earths, 2010, 28, 171–175 CrossRef CAS.
  30. M. Jiang, T. Ohnuki, N. Kozai, K. Tanaka, Y. Suzuki, F. Sakamoto, E. Kamiishi and S. Utsunomiya, Chem. Geol., 2010, 277, 61–69 CrossRef CAS PubMed.
  31. L. Ma, L.-M. Xu, W.-X. Chen and Z.-D. Xu, Mater. Lett., 2009, 63, 1635–1637 CrossRef CAS PubMed.
  32. G. Li, L. Li, M. Li, Y. Song, H. Zou, L. Zou, X. Xu and S. Gan, Mater. Chem. Phys., 2012, 133, 263–268 CrossRef CAS PubMed.
  33. H. Dong, Y. Liu, P. Yang, W. Wang and J. Lin, Solid State Sci., 2010, 12, 1652–1660 CrossRef CAS PubMed.
  34. R. Yan, X. Sun, X. Wang, Q. Peng and Y. Li, Chem.–Eur. J., 2005, 11, 2183–2195 CrossRef CAS PubMed.
  35. W.-B. Bu, Z.-L. Hua, H.-R. Chen, L.-X. Zhang and J.-L. Shi, Chem. Lett., 2004, 33, 612–613 CrossRef CAS.
  36. J. Bao, R. Yu, J. Zhang, X. Yang, D. Wang, J. Deng, J. Chen and X. Xing, CrystEngComm, 2009, 11, 1630–1634 RSC.
  37. Y.-W. Zhang, Z.-G. Yan, L.-P. You, R. Si and C.-H. Yan, Eur. J. Inorg. Chem., 2003, 2003, 4099–4104 CrossRef.
  38. S. Lin, Y. Yuan, H. Wang, R. Jia, X. Yang and S. Liu, J. Mater. Sci.: Mater. Electron., 2009, 20, 899–904 CrossRef CAS.
  39. Y.-P. Fang, A.-W. Xu, R.-Q. Song, H.-X. Zhang, L.-P. You, J. C. Yu and H.-Q. Liu, J. Am. Chem. Soc., 2003, 125, 16025–16034 CrossRef CAS PubMed.
  40. M. Guan, J. Sun, T. Shang, Q. Zhou, J. Han and A. Ji, J. Mater. Sci. Technol., 2010, 26, 45–48 CAS.
  41. W. Bu, Z. Hua, H. Chen and J. Shi, J. Phys. Chem. B, 2005, 109, 14461–14464 CrossRef CAS PubMed.
  42. M. Haase, K. Riwotzki, H. Meyssamy and A. Kornowski, J. Alloys Compd., 2000, 303–304, 191–197 CrossRef CAS.
  43. Y. Zhang and H. Guan, J. Cryst. Growth, 2003, 256, 156–161 CrossRef CAS.
  44. Z.-G. Yan, Y.-W. Zhang, L.-P. You, R. Si and C.-H. Yan, J. Cryst. Growth, 2004, 262, 408–414 CrossRef CAS PubMed.
  45. C. Minhua, H. Changwen, W. Qingyin, G. Caixin, Q. Yanjuan and W. Enbo, Nanotechnology, 2005, 16, 282 CrossRef PubMed.
  46. J. Bao, R. Yu, J. Zhang, D. Wang, J. Deng, J. Chen and X. Xing, Scr. Mater., 2010, 62, 133–136 CrossRef CAS PubMed.
  47. Y.-P. Fang, A.-W. Xu and W.-F. Dong, Small, 2005, 1, 967–971 CrossRef CAS PubMed.
  48. Z.-G. Yan, Y.-W. Zhang, L.-P. You, R. Si and C.-H. Yan, Solid State Commun., 2004, 130, 125–129 CrossRef CAS PubMed.
  49. X. Wang and M. Gao, J. Mater. Chem., 2006, 16, 1360–1365 RSC.
  50. M. Yang, H. You, K. Liu, Y. Zheng, N. Guo and H. Zhang, Inorg. Chem., 2010, 49, 4996–5002 CrossRef CAS PubMed.
  51. J. Fang, Y. Guo, G. Lu, C. L. Raston and K. S. Iyer, Green Chem., 2011, 13, 817–819 RSC.
  52. S. Lucas, E. Champion, D. Bregiroux, D. Bernache-Assollant and F. Audubert, J. Solid State Chem., 2004, 177, 1302–1311 CrossRef CAS PubMed.
  53. W. Di, X. Wang and H. Zhao, J. Nanosci. Nanotechnol., 2007, 7, 3624–3628 CrossRef CAS PubMed.
  54. L. Yuebin, S. Zhong, M. Lun, Z. Xing, Y. Mingzhen, G. J. Alan, L. Zuli and C. Wei, Nanotechnology, 2010, 21, 125604 CrossRef PubMed.
  55. L. Qian, W. Du, Q. Gong and X. Qian, Mater. Chem. Phys., 2009, 114, 479–484 CrossRef CAS PubMed.
  56. W. Bu, L. Zhang, Z. Hua, H. Chen and J. Shi, Cryst. Growth Des., 2007, 7, 2305–2309 CAS.
  57. X. Liu, Q. Wang, Z. Gao, J. Sun and J. Shen, Cryst. Growth Des., 2009, 9, 3707–3713 CAS.
  58. Q. Li and V. W.-W. Yam, Angew. Chem., Int. Ed., 2007, 46, 3486–3489 CrossRef CAS PubMed.
  59. S. Chall, S. S. Mati, S. Rakshit and S. C. Bhattacharya, J. Phys. Chem. C, 2013, 117, 25146–25159 CAS.
  60. F. L. Arbeloa, P. R. Ojeda and I. L. Arbeloa, J. Lumin., 1989, 44, 105–112 CrossRef.
  61. L. Gránásy, T. Pusztai, G. Tegze, J. A. Warren and J. F. Douglas, Phys. Rev. E: Stat., Nonlinear, Soft Matter Phys., 2005, 72, 011605 CrossRef.
  62. H. D. Keith and F. J. Padden, J. Appl. Phys., 1963, 34, 2409–2421 CrossRef CAS PubMed.
  63. L. Granasy, T. Pusztai, T. Borzsonyi, J. A. Warren and J. F. Douglas, Nat. Mater., 2004, 3, 645–650 CrossRef CAS PubMed.
  64. M. N. Maleev, Mineral. Petrol., 1972, 18, 1–16 CAS.
  65. A. T. Kelly, I. Rusakova, T. Ould-Ely, C. Hofmann, A. Lüttge and K. H. Whitmire, Nano Lett., 2007, 7, 2920–2925 CrossRef CAS PubMed.
  66. J. Tang and A. P. Alivisatos, Nano Lett., 2006, 6, 2701–2706 CrossRef CAS PubMed.
  67. C. Zhong and C. C. Chu, Cryst. Growth Des., 2010, 10, 5043–5049 CAS.
  68. J. Tao, H. Pan, J. Wang, J. Wu, B. Wang, X. Xu and R. Tang, J. Phys. Chem. C, 2008, 112, 14929–14933 CAS.
  69. Y. Hu and K. Chen, J. Cryst. Growth, 2007, 308, 185–188 CrossRef CAS PubMed.
  70. S. Busch, H. Dolhaine, A. DuChesne, S. Heinz, O. Hochrein, F. Laeri, O. Podebrad, U. Vietze, T. Weiland and R. Kniep, Eur. J. Inorg. Chem., 1999, 1999, 1643–1653 CrossRef.
  71. J. M. García-Ruiz, E. Melero-García and S. T. Hyde, Science, 2009, 323, 362–365 CrossRef PubMed.
  72. S. Doktycz and K. Suslick, Science, 1990, 247, 1067–1069 CAS.
  73. E. B. Flint and K. S. Suslick, Science, 1991, 253, 1397–1399 CrossRef CAS PubMed.
  74. K. E. Murphy, M. B. Altman and B. Wunderlich, J. Appl. Phys., 1977, 48, 4122–4131 CrossRef CAS PubMed.
  75. X. Zhang, M. Zhang, Y. Zhu, P. Wang, F. Xue, J. Gu, H. Bi and Y. Qian, Mater. Res. Bull., 2010, 45, 1324–1329 CrossRef CAS PubMed.
  76. P. Pusztai, T. Simon, Á. Kukovecz and Z. Kónya, J. Mol. Struct., 2013, 1044, 94–98 CrossRef CAS PubMed.
  77. M. Kitsuda and S. Fujihara, J. Phys. Chem. C, 2011, 115, 8808–8815 CAS.
  78. A. I. Becerro, S. Rodríguez-Liviano, A. J. Fernández-Carrión and M. Ocaña, Cryst. Growth Des., 2012, 13, 526–535 Search PubMed.
  79. W. Di, X. Wang, P. Zhu and B. Chen, J. Solid State Chem., 2007, 180, 467–473 CrossRef CAS PubMed.
  80. G. Chen, H. Zhao, F. Rosei and D. Ma, J. Phys. Chem. C, 2013, 117, 10031–10038 CAS.
  81. Q. Wang and Y. Li, J. Non-Cryst. Solids, 2011, 357, 1008–1012 CrossRef CAS PubMed.

Footnote

Electronic supplementary information (ESI) available. See DOI: 10.1039/c4ra10089a

This journal is © The Royal Society of Chemistry 2014
Click here to see how this site uses Cookies. View our privacy policy here.