A facile and efficient preparation of anatase titania nanoparticles in micelle nanoreactors: morphology, structure, and their high photocatalytic activity under UV light illumination

Reza Abazaria, Ali Reza Mahjoub*a and Soheila Sanatib
aDepartment of Chemistry, Tarbiat Modares University, Tehran, Iran. E-mail: mahjouba@modares.ac.ir; r.abazari@sina.kntu.ac.ir; Fax: +98 21 82883455; Tel: +98 21 82883442
bDepartment of Chemistry, Faculty of Basic Sciences, Azarbaijan Shahid Madani University, Tabriz, Iran. E-mail: soheila.sanati@gmail.com

Received 8th September 2014 , Accepted 1st October 2014

First published on 31st October 2014


Abstract

In the present study, synthesis of titania (titanium dioxide, TiO2) nanoparticles, which show light absorption characteristics in the ultraviolet region, was successfully achieved in the CTAB micelle nanoreactors at room temperature. The shape (or surface morphology), size, elemental composition, crystal structure, and optical properties of these particles were characterized by scanning electron microscope (SEM), transmission electron microscopy (TEM), X-ray diffraction (XRD), Fourier transform infrared spectroscopy (FT-IR), and ultraviolet-visible absorption (UV-Vis) spectroscopy. Besides, our proposed method allowed for the successful preparation of highly crystalline and well-dispersed anatase titania nanoparticles with a phase-pure. Evaluation of titania nanoparticles' photocatalytic activity was performed through degrading the methylene blue (MB) dye under ultraviolet light irradiation. Compared to the commercial P25 TiO2 powder, this result is indicative of a high photocatalytic MB dye degradation activity. Also, the effect of the amount of TiO2 nanoparticles in the MB dye degradation has been investigated in detail. Finally, the stability of photocatalytic activity of those nanoparticles has been evaluated.

Introduction

Synthesis of transition metal oxide nanostructures has recently attracted growing attention among the researchers in chemical science. Great importance has been placed on the nanoparticles due to their peculiar quantum-size properties and high specific surface areas.1 A wide variety of potential applications can also be considered for transition metal oxides with diverse morphological structures. In this context, there has been considerable interest in the synthesis of semiconductor nanostructures and the investigation of their properties in the past decade due to their potential application in electronic, optical, superconductor devices, etc.2–4 Among the transition metal oxide semiconductors, titania as an attractive semiconductor material is one of the most prominent oxide materials for performing various kinds of industrial applications such as photocatalytic, photovoltaic, photonic crystals, and photochromic.5–9 Titanium dioxide is recognized as the most efficient, nontoxic, insolubility, and stable photocatalyst.10–13 Titania nanoparticles can be also used in various applications such as optical filters, lithium ion batteries, ceramic membranes, fuel cells, hydrogen generation, biology, environmental purification, dye sensitized solar cells, and gas sensing systems.14–21 Besides, due to their potential application in the decomposition of pollutants in water and air, these materials show a highly promising photocatalytic activity.22,23

This material has three crystalline phases: anatase (tetragonal), rutile (tetragonal), and brookite (orthorhombic). The anatase phase exhibits a photocatalytic activity significantly higher than that of other polymorphs of titania.24–27 Formation of a particular phase depends on the nature of the precursor, its composition, preparation method, and annealing temperatures. Furthermore, properties of these materials depend greatly upon their size and morphology, and hence much importance is attached to the synthesis of nanostructures with different size and morphology.28,29 Several methods have been previously proposed for obtaining nanocrystalline titania including sol–gel,30 electrospinning technique,31 hydrothermal,32 microwave,33 electrospinning,34 diffusion induced phase separation,35 sol–gel processing in reverse micelles,36 etc. However, it should be noted that some of the used methods do not allow for a large-scale production and some others seem to be insufficient for controlling the shape and size distribution of titania nanoparticles. Therefore, the design of a straightforward and efficient procedure for preparation of the nanostructures is of practical interest. Due to the preparation of the nanostructures in micelle nanoreactors, an appropriate control of size and composition by making use of the low formation temperature can be achieved.37–40 In addition, it is appropriate to make use of such micelle nanoreactors for the preparation of very fine catalytic particles, which can efficiently be used in photocatalytic procedures.41–44 Therefore, this procedure can be viewed as one viable alternative.

In this study, a straightforward, cost- and time-effective, and economic approach to the production of single-crystal titania nanoparticles with uniform shape and excellent monodispersity using the micelle nanoreactors has been developed. Furthermore, for the investigation of the photocatalytic activity of these nanoparticles under UV light irradiation, MB dye degradation was taken into account. This study has also investigated the recycling features of the TiO2 photocatalysts while taking the practical application of these nanoparticles into account.

Experimental

Materials

Cetyltrimethyl ammonium bromide (CTAB, purity 98%) as surfactant, and titanium tetrachloride (TiCl4) as precursor salt were purchased from Sigma-Aldrich. Commercial P25 TiO2 powder (P25, ca. 80% anatase, 20% rutile) from Degussa was used for the comparison of the photocatalytic activity. 1-Hexanol (purity ∼99.9%) as the co-surfactant was supplied from Merck. Deionized and double distilled water was used for micelle and solution preparation. Other chemicals were purchased from Aldrich and used as received without further purification.

Characterization

The morphology, size and structure of the titania nanoparticles were evaluated SEM, TEM, XRD, FT-IR, and UV-Vis spectroscopy. SEM image was obtained on a KYKY-EM3200 scanning electron microscope using accelerating voltage of 25 kV. To obtain SEM image, the sample was dispersed in ethanol and a drop of this suspension was deposited on a stainless SEM stub. The stub was dried in air at room temperature and coated with gold before characterization. Then, the SEM micrograph was obtained. TEM measurement for the TiO2 nanoparticles was performed on a Philips model EM-208S instrument operated at an accelerating voltage of 100 kV. The sample for TEM study was prepared by dispersing the TiO2 nanoparticles in ethanol solution followed by sonication for 10 min until complete dispersion is achieved. Then, a drop of the nanoparticles–ethanol solution was taken on a carbon coated copper grid and then evaporated in air at room temperature for TEM observations. XRD analysis of the titania nanoparticles was carried out using a Philips diffractometer (model TM-1800). Nickel filtered Cu-Kα radiation source was used to produce X-ray (λ = 0.154 nm), and scattered radiation was measured with a proportional counter detector at a scan rate of 4° min−1. The scanning angle was from 20° to 80°, operating at a voltage of 40 kV applying potential current of 30 mA. FT-IR spectra (in the wavenumber range from 400 to 4000 cm−1) were recorded using KBr disks on a Shimadzu FT-IR model Prestige 21 spectrometer. The UV-Vis absorption spectrum of the micelle solution containing the titania nanoparticles was measured using a Perkin-Elmer UV-Vis spectrometer equipped with a 1.0 cm quartz cell (300–600 nm).

Preparation of the TiO2 nanoparticles

As said before, one effective method for preparing nanostructures with controllable size, morphology, and crystallinity is to use the micelle technique. First, two micelles of dissimilar aqueous phases having 0.38 mmol TiCl4 (micelle A) and 0.72 mmol NH4OH (micelle B) were synthesized (it should be noted that each micelle was prepared with a concentration of 0.12 M CTAB and a given amount of 1-hexanol as the co-surfactant). After that, micelle B was added to micelle A. The reaction time was maintained for 24 h with rapid stirring at room temperature in order to TiO2 precursor. Then, methanol was added to the beaker to make phase separation and to wash the solution for 10 min three times. The final mixture was centrifuged to get TiO2 precursor and it was dried at 60 °C. Crystallization of the product was performed by calcination at 500 °C for 4 h in air. The heating rate was 10 °C min−1 and natural cooling was used. Titania nanoparticles were completely crystallized into anatase phase at a temperature of 500 °C, without formation of any intermediate phases. Finally, the obtained orthorhombic titania nanoparticles were characterized by SEM, TEM, XRD, FT-IR, and UV-Vis analyses.

Photocatalytic activity measurement

By considering the degradation of MB dye (used as a probe) in an aqueous solution under ultraviolet light irradiation, a comparison between the photocatalysis activity of the prepared spherical TiO2 nanoparticles and that of the commercial P25 TiO2 powder – as photocatalysts – was made. Aqueous suspensions of MB dye (20 mL, with an initial concentration of 1.0 × 10⁻⁵ M) and photocatalyst powder (3.8 mg) were placed in a beaker (50 mL). Prior to irradiation, each suspension was magnetically stirred in the dark for 30 min to get the adsorption–desorption equilibrium (between catalyst and dye), followed by the ultraviolet light irradiation. After a given time interval during the ultraviolet light irradiation, the suspension was centrifuged to separate the catalyst, and the upper transparent solution was measured in the range 200–800 nm using the ultraviolet-visible absorption spectrophotometer and used to determine the remaining fraction of MB concentration (C/C0), where C0 and C denote the MB concentrations at t = 0 and t = t, respectively. The concentration of the residual MB dye was evaluated by the absorbance in the ultraviolet region. In other words, the absorbance in the ultraviolet region represents the content of MB and its decrease indicates the photodegradation of dye. Finally, the remaining fraction of MB concentration from the UV-Vis spectroscopy analysis was used as the indicators for evaluating the photocatalytic activity of the synthesized titania nanoparticles as compared to the commercial P25 TiO2 photocatalyst.

Results and discussion

Analysis of titania (titanium dioxide, TiO2) nanoparticles and commercial P25 TiO2

As it is known, the optical properties of semiconductor nanomaterials are affected by their size and morphological features.45–47 Thus, in the present study, using SEM analysis, the surface morphology of the prepared titania nanoparticles was first investigated – as shown in Fig. 1. The synthesized nanoparticles in the present study are homogeneous, somewhat agglomerated, and sphere-shaped – as shown by SEM image. Worth noting that there exists a limited number of released aggregates of larger sizes, which can, thus, be explained by the fact that during the washing stages some aggregation happens and that the calcination temperature is quite high.
image file: c4ra10018b-f1.tif
Fig. 1 SEM image of spherical TiO2 nanoparticles synthesized in micelle system.

Also, TEM analysis was used to further characterize the morphology and particle size. Fig. 2 shows a typical TEM image for the titania nanoparticles. Our synthesized nanoparticles well demonstrate a narrow size distribution (with sizes ranging from 5 to 15 nm) and are generally spherical. This result is in compliance with the result of SEM analysis. It has been clearly observed that the nanoparticles involved have no agglomeration with respect to their edges. As recorded in the literature, titania nanoparticles, due to the aggregation problems involved, often show lower efficiencies.48


image file: c4ra10018b-f2.tif
Fig. 2 TEM image of titania nanoparticles formed in micelle nanoreactors, scale bar 50 nm.

Using X-Ray diffraction, the nanostructures can be examined in terms of their solid structure and also the purity of the corresponding phase can be affirmed. Fig. 3 shows the phase composition of titania nanoparticles by the XRD analysis. All diffraction peaks can be well indexed to pure anatase structural titania (JCPDS Card no. 04-0477). Concerning the rutile or brookite phase, no peaks were detected, which indicates the satisfactory purity of our produced products. These diffraction peaks are broadened since the size of the said nanocrystals is fairly small.


image file: c4ra10018b-f3.tif
Fig. 3 X-ray diffraction (XRD) spectrum of anatase titania nanoparticles calcined at 500 °C for 4 h in air.

Broadening in the peaks of titania indicates the formation of TiO2 nanoparticles. According to literature reports, the crystalline domain size decreased with increasing line broadening. The XRD pattern (Fig. 3) for TiO2 nanoparticles shows considerable broadening of the peaks, which is due to the presence of very small crystallites. In other words, the broadening of the peaks indicated that the particles were of nanometer scale. That the diffraction pattern broadens at the peak point can be considered mainly in terms of the four following parameters: (a) micro-strains (i.e., lattice deformation), (b) faulting (i.e., extended defects), (c) domain size of the crystal, and (d) the distribution domain size.49 Under the assumption that the considered samples are unstrained and non-faulted, the broadening of the peak concerning the diffraction pattern can simply be attributed to the crystalline domain size.50,51

According to the X-ray line-broadening and using the Debye–Scherrer equation, the average particle size (D) of the TiO2 nanoparticles is calculated to be 9.25 nm as follows (eqn (1)). At the angle 2θ of 25.28, 37.80, 48.05, 53.89, and 55.06°, peak reflected intensity has considerably increased – as shown by the XRD pattern (Fig. 3). Therefore, for estimation of the average size of the particles, the (101), (004), (200), (105), and (211) peaks were applied.

 
image file: c4ra10018b-t1.tif(1)

In this context, as revealed by the estimation of diffraction peaks broadening in XRD image, the average size of crystallite is assumed to be in good agreement with the results from TEM micrograph (concerning the size of the particles). This partial difference can be illustrated by the fact that a global picture is represented by the XRD pattern, whereas TEM provides a local feature. In this equation, D is the average particle size, k is the so-called shape factor, which usually takes a value of about 0.9, λ is the wavelength of the X-ray radiation (0.15418 nm for Cu-Kα), β is the full width at half maximum (FWHM) of the diffraction peak measured at 2θ (that is broad due to the crystallite dimensions), and θ is the angle at maximum diffraction curve intensity. Table 1 shows the particle size of TiO2 nanoparticles characteristic peaks ranging from 8.26 to 10.23 nm.

Table 1 Crystal phase and particle size of TiO2 nanoparticles (TiO2 NPs) and P25 TiO2
Samples 2θ Phase FWHM (deg) Particle size (nm) Average particle size
TiO2 NPs 25.28 Anatase 0.9874 8.26 9.25
TiO2 NPs 37.80 Anatase 0.8218 10.23
TiO2 NPs 48.05 Anatase 0.9187 9.48
TiO2 NPs 53.89 Anatase 0.9543 9.35
TiO2 NPs 55.06 Anatase 1.0034 8.94
P25 TiO2 25.28 Anatase 0.2328 35.02 34.29
P25 TiO2 27.45 Rutile 0.2503 32.71
P25 TiO2 48.05 Anatase 0.2697 32.29
P25 TiO2 53.89 Anatase 0.2402 37.15


Investigating the surface chemistry of nanomaterials would help to have a better view of their properties. FT-IR spectroscopy was performed to investigate chemical bonding between Ti and O atoms in the wavenumber range from 400 to 4000 cm−1. Fig. 4 shows FT-IR spectra of the titania nanoparticles synthesized in micelle nanoreactors. The characteristic vibrations of the synthesized titania nanoparticles is observed at the broad band 630 to 850 cm−1, which be attributed the stretching vibration of the inorganic Ti–O–Ti network.52 So we can say that FT-IR spectra agree with XRD pattern. Also, no organic species have been introduced during the titania synthesis. Two peaks at 1626 and 3414 cm−1 are attributed to H–O stretching and H–O–H bending vibration modes.53


image file: c4ra10018b-f4.tif
Fig. 4 FT-IR spectra of the titania nanoparticles formed in water/CTAB/1-hexanol/isooctane micelle nanoreactors.

Prior to the photocatalytic activity examination, it is required to take the light absorption of these particles into account since the absorption edge of UV-Vis and semiconducting catalyst energy band are related. Optical properties of the titania nanoparticles were investigated by UV-Vis spectroscopy. Concerning TiO2, the anatase phase absorption edge is approximately at 387 nm wavelength (Fig. 5) – which is largely due to the transmission of electrons from the valence band of titania to its conduction band.54,55 This deduces that the synthesized titania nanoparticle is an ultraviolet light active compound. In this view, it can also be mentioned that, using the aforementioned method, the produced nanoparticles have photocatalytic properties.


image file: c4ra10018b-f5.tif
Fig. 5 UV-Vis spectra of the titania nanoparticles produced in micelle nanoreactors.

Energy band gap can be determined by the following relationship (eqn (2)). According to the literature, the relationship between energy band gap and λonset can be expressed as following:56

 
image file: c4ra10018b-t2.tif(2)
where Eg is the band gap energy (eV) and λonset is the wavelength (nm) of the absorption edge in the spectrum. The energy band gap of the obtained titania nanoparticles can be estimated to be 3.204 eV according to eqn (2). This was reasonable because this value was higher than the Eg value of bulk anatase titania (3.0–3.2 eV).57

It should be here noted that before investigation of the catalytic capability of the catalysts used in the present study (for MB dye degradation) and for a better comparison of the photocatalytic activity of P25 TiO2 (as a commercial substance) with that of the TiO2 nanoparticles, it is required that the P25 TiO2 be exactly characterized. Therefore, for identification of the structure, morphology, and particle size of P25 TiO2, characterization of the said substance was taken into account using SEM, XRD, FT-IR, as well as UV-Vis spectroscopy analyses.

In this context, in accordance with Fig. 6a, the morphology of the surface of P25 TiO2 particles was first analyzed using a scanning electron microscope (SEM, Hitachi, S-1460). The SEM observations revealed that P25 TiO2 particles were ranging in size from 30 nm to 40 nm and are asymmetrical in shape. In comparison with the TiO2 nanoparticles represented in Fig. 1, these particles demonstrate some structures with more conglutination.


image file: c4ra10018b-f6.tif
Fig. 6 SEM image (a) and X-ray diffraction pattern (b) of the commercial P25 TiO2 particles.

XRD pattern of P25 TiO2 is shown in Fig. 6b. In P25 TiO2 particles – as compared to TiO2 nanoparticles – a significant increase in the rutile peak intensity can be observed while a reduction in the intensity of anatase peak happens. It means that this pattern is properly indexable for the combined rutile and anatase phases. XRD peak at 2θ = 25.28° is usually regarded as the characteristic peak of anatase (101), while the XRD peak at 2θ = 27.45° is often considered to be characteristic of rutile (110) crystal phase.58,59 The anatase phase of titania generally demonstrates the presence of some major peaks at 2θ = 25.28°, 37.80°, 40.05°, 53.89°, 55.06°, and 62.68° whereas the major peaks at 2θ = 27.45°, 36.08°, 41.22°, 54.32°, 56.64°, and 69° are associated with its rutile phase. In Fig. 6b, these are represented by A and R. Furthermore, Table 1 shows the calculated average P25 TiO2 particle size from Scherrer's equation to be 34.29 nm, which is in good agreement with the observations from SEM picture. Moreover, the mean size of the P25 TiO2 particles is thus greater than that of TiO2 nanoparticles. Based on the (101), (110), (200), and (105) reflections, calculation of the mean cell parameter was done.

For better identification of the metal oxide properties, application of FT-IR spectroscopy (as a viable device) has been taken into account. Fig. 7a represents the FT-IR spectra of the P25 TiO2 particle. Generally speaking, due to the existence of interatomic vibrations, some absorption bands lower than 1000 cm−1 are provided by the metal oxides. As said above, the stretching and bending vibrations of the hydroxyl groups (O–H) are responsible for the peaks at ∼3414 and ∼1626 cm−1, respectively. On the other hand, the peaks at ∼2920 and ∼2840 cm−1 are associated with Ti–OH bond. In addition, the Ti–O stretching and Ti–O–Ti bridging stretching modes are responsible for the broad band of absorption in the 400–800 cm−1 region.60 As the calcination temperature increases, an increase, however, in the IR band intensity related to the vibration mode of Ti–O–Ti happens. In view of such variations, a high crystallinity for commercial P25 TiO2 is observed.


image file: c4ra10018b-f7.tif
Fig. 7 FT-IR spectra (a) and UV-Vis absorbance spectra (b) of the commercial P25 TiO2 particles.

The commercial P25 TiO2 absorption under the irradiation of the UV light has already been carried out.61 In spite of the fact that P25 TiO2 powder has approximately no absorption to visible light, it, nevertheless, shows a strong absorption in UV region – as represented by Fig. 7b. In comparison to the TiO2 nanoparticles, a marked red-shift is demonstrated by the UV-Vis of P25 TiO2, which can be associated with both rutile formation and growth of the crystallite. Worth noting that the light absorption properties of titania are clearly influenced by the calcination temperature.62,63 It should also be mentioned that the existence of the Ti species in the form of tetrahedral Ti4+ can be deduced from the fact that, in the wavelength below ∼400 nm the absorption band is strong. Besides, this is usually in connection with the fact that the valence band O 2p electron is excited to the conduction band Ti 3d level.64 Concerning the P25 TiO2 sample, the band gap energy was observed to be equal to 3.10 eV. This amount was calculated based on the spectra's value of the wavelength. In this context, the following equation can be considered, Eg = 1239.8/λonset. Also, it should be noted that as the particle size increases, the band gap value decreases.44

Photocatalyst characterization results

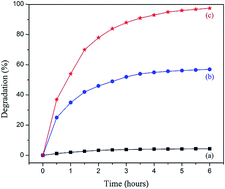
The degradation efficiencies of MB with the photocatalysts (P25 TiO2 and TiO2 nanoparticles) as well as without photocatalyst (the blank test) under ultraviolet-light illumination are displayed in Fig. 8. It should be noted that the photocatalytic degradation of MB was dependent on the synthesis conditions of the titanium dioxide particles.65,66 The photo-degradation of the MB dye cannot happen when no photocatalytic activity exists under the irradiation of the ultraviolet light (Fig. 8). However, in case the photocatalysts are involved, a dramatic increase in the concentration of MB dye occurs as the irradiation time increases. Since the samples are adsorbed, MB solution concentration decreases as exposed to the catalytic activities in the dark.
image file: c4ra10018b-f8.tif
Fig. 8 Photocatalytic efficiency of the MB dye degradation percentage curves under ultraviolet light irradiation: (a) without photocatalyst; (b) commercial P25 TiO2 powder; and (c) titania nanoparticles.

The results showed that the presence of commercial P25 TiO2 powder alone did not significantly enhance the photocatalytic activity as compared to the system without catalyst. MB solution concentration maximally decreases when the TiO2 nanoparticles are used. The reason for such a maximum decrease can be explained by the particular morphology as well as the narrow nano-sized distribution of the said nanoparticles. Accordingly, the number of active surface sites also increases, which dramatically increases the rate of MB degradation. The MB dye degradation percentage was calculated by eqn (3) as follows:

 
image file: c4ra10018b-t3.tif(3)
where A0 and At are the absorbance value of solution at 0 and t min, respectively. After being exposed under the irradiation of the ultraviolet light for 6 h, a 4.4% degradation was obtained from irradiation in the absence of any catalytic agents – based on the calculations of photocatalysis in eqn (3). When commercial P25 TiO2 powder was used, the degradation was found to be 57% in a time of around 6 h. however, by using the TiO2 nanoparticles, it was 91% in 3.5 h. Based on the results, these titania nanoparticles efficiently show photocatalytic properties when exposed to the irradiation of the ultraviolet light. On the whole, the photocatalysts, which are smaller in terms of their particle size, provide further active surface sites and also transfer the surface charge carrier more efficiently.

The impact of photocatalytic quantity on the MB dye photocatalytic degrading

An important factor in the photocatalytic degrading of the MB dye exposed to the irradiation of the UV light is the photocatalytic quantity. In this view, as shown in Fig. 9, and by considering similar situations, the present paper has investigated the influence of various TiO2 nanoparticles amounts on photocatalysis degrading of 20 mL MB dye – of which the original concentration was equal to 1.0 × 10⁻⁵ M. Based on the observations, as the TiO2 nanoparticles quantity increases from 3.8 mg to 11.4 mg, the efficiency of the MB dye degradation also increases from 91% to 94%, which can be due to the increase in the quantity of the photogenerated electron–hole pairs at the same time as the amount of the catalyst goes up. As reported in the literature, increased photocatalytic quantity may result in the provision of the photocatalysts with more active sites,67 and hence an increase in the amount of the adsorbed photons and of the dye molecules occurs.
image file: c4ra10018b-f9.tif
Fig. 9 Effects of amount of the TiO2 nanoparticles in the MB dye photocatalytic degradation.

Nonetheless, if the TiO2 nanoparticles quantity is further increased from 11.4 mg to 22.8 mg, efficiency of degradation goes down to 73.5%, whereas the efficiency of degradation for 11.4 mg was 94%. Such decrease can be explained by the obstruction in the penetration of the light due to the additional photocatalytic presence.68 To put it differently, such decreased efficiency can also be attributed to the exertion of both steric and scattering effects through extra catalytic quantities on the use of the light by the involved catalytic particles. Furthermore, by decreasing the catalytic amount from 3.8 mg to 1.9 mg, a considerable change occurs in the MB dye degradation, which, in turn, results in a decrease in the degradation efficiency from 91% to 57%. This result is well indicative of the importance of the catalytic amount in the said reaction. Therefore, it can be stated that – concerning the MB dye degradation – in our considered case, the TiO2 quantity, which can be regarded as optimal, is equal to 11.4 mg. According to the results, both adequate light and catalytic amount are required for the MB dye to be effectively photo-degraded.

Investigation of the TiO2 nanoparticles' stability and recycling properties

One important stage in the evaluation of the photocatalytic activity in practice, which is also of great importance in the design of the heterogeneous photocatalysis technology concerning the treatment of the wastewater, is the consideration of the catalytic recycling properties. To put it differently, great importance is also attached to the photocatalytic stability – in addition to the photocatalytic efficiency – when practical applications are taken into account. Consequently, under the irradiation of the UV light, TiO2 nanoparticles have also been examined in terms of their reusability in the process of the dye decomposition. It should also be here mentioned that concerning each test the time of UV irradiation was assumed to be 3.5 h. As shown in Fig. 10, the successive recycling and reusing of the TiO2 nanoparticles was performed for four times for the MB dye degradation using the same experimental situation. Besides, in this stage, an addition of TiO2 nanoparticles (11.4 mg) into 20 mL of MB aqueous solution through the UV irradiation was done. Through decanting the liquid phase, the catalytic amount was easily separated – based on the related centrifugation – from the mixture of the reaction, the catalytic agent was washed using diethyl ether, and was ultimately dried at 60 °C so that the next reaction run could be performed. The efficiency of the MB dye photocatalytic decomposition was observed to be 86% after the run of four cycles in a time of 3.5 h.
image file: c4ra10018b-f10.tif
Fig. 10 Recycle and reuse of TiO2 nanoparticles for MB dye photocatalytic degradation.

As suggested by Fig. 10, this demonstrates that the photocatalytic degradation of TiO2 has still a very high efficiency while four runs of successive cycling reuse have been performed. This finding is indicative of the fact that these TiO2 photocatalytic nanoparticles are capable of remaining stable and efficient through the degradation period and can also be considered as a potential photocatalyst in water treatment. Moreover, this finding is representative of the high stability and incontamination of the considered nanoparticles throughout the conduction of photocatalytic reaction. However, it has been observed that by the fifth iteration of the reaction, as compared to the first one, a 31% reduction in the reaction yield takes place, which may be explained in terms of the reduced number of TiO2 nanoparticles with respect to the amount of the cycles, indicating the especial importance attached to the TiO2 nanoparticles participation in the MB dye photocatalytic decomposition procedure. Clearly, on account of their proper activity and recycling properties as well as their being easily separable from the reaction mixture, TiO2 nanoparticles are, thus, assumed to be effective photocatalysts. Consequently, in the light of the present study, it is hoped that a useful material for use in photocatalysis – particularly as a photocatalyst for industrial applications – can be obtained.

Conclusions

In the present study, through a mild, straightforward, energy efficient, and time-saving synthesis method, the pure phase and non-agglomerated titania nanoparticles with an average size of around 10 nm were obtained in micelle nanoreactors. Accordingly, an economic procedure from both energy and time standpoints is achieved. The formation of highly monodispersed TiO2 nanoparticles – which are spherical in shape and uniform – can be justified through the investigation of the surface morphology. Creation of a pure anatase titania phase was demonstrated through XRD observations. Through the UV-Vis spectroscopy, the band gap of the titania nanoparticles at the wavelength of about 387 nm was calculated and found to be 3.204 eV. Also, as observed, such photocatalysis is recyclable and simply recoverable for four times while no reduction in the amount of the photocatalytic activity occurs. Furthermore, our prepared titanium dioxide nanoparticles show a highly appropriate photocatalytic activity under ultraviolet light irradiation. This high photocatalytic activity can be accounted for by the unique morphology, narrow size distribution, bulk-to-nanostructure variation, as well as the strong ultraviolet light absorption of the considered nanoparticles.

Acknowledgements

This work was supported by the Tarbiat Modares University. The authors are grateful for the financial support.

Notes and references

  1. S. S. M. Bhat and N. G. Sundaram, RSC Adv., 2013, 3, 14371–14378 RSC.
  2. A. P. Alivisatos, Science, 1996, 271, 933–937 CAS.
  3. G. Xiao, Y. Wang, J. Ning, Y. Wei, B. Liu, W. W. Yu, G. Zou and B. Zou, RSC Adv., 2013, 3, 8104–8130 RSC.
  4. M. Bagheri, A. R. Mahjoub and B. Mehri, RSC Adv., 2014, 4, 21757–21764 RSC.
  5. M. A. Lazar and W. A. Daoud, RSC Adv., 2013, 3, 4130–4140 RSC.
  6. M. Grtzel, Nature, 2001, 414, 338–344 CrossRef PubMed.
  7. E. I. Seck, J. M. Doña-Rodríguez, C. Fernández-Rodríguez, D. Portillo-Carrizo, M. J. Hernández-Rodríguez, O. M. González-Díaz and J. Pérez-Peña, Sol. Energy, 2013, 87, 150–157 CrossRef CAS PubMed.
  8. G. S. Anjusree, A. S. Nair, S. V. Nair and S. Vadukumpully, RSC Adv., 2013, 3, 12933–12938 RSC.
  9. L. Wang, L. Xu, Z. Sun and Z. Mu, RSC Adv., 2013, 3, 21811–21816 RSC.
  10. C. Xu, Y. Yuan, R. Yuan and X. Fu, RSC Adv., 2013, 3, 18002–18008 RSC.
  11. M. Yasui, K. Katagiri, S. Yamanaka and K. Inumaru, RSC Adv., 2012, 2, 11132–11137 RSC.
  12. V. A. Ganesh, A. S. Nair, H. K. Raut, T. M. Walsh and S. Ramakrishna, RSC Adv., 2012, 2, 2067–2072 RSC.
  13. S. Deng, S. W. Verbruggen, Z. He, D. J. Cott, P. M. Vereecken, J. A. Martens, S. Bals, S. Lenaerts and C. Detavernier, RSC Adv., 2014, 4, 11648–11653 RSC.
  14. Z. Weng, H. Guo, X. Liu, S. Wu, K. W. K. Yeung and P. K. Chu, RSC Adv., 2013, 3, 24758–24775 RSC.
  15. X. B. Chen and S. S. Mao, Chem. Rev., 2007, 107, 2891–2959 CrossRef CAS PubMed.
  16. Z. W. Liu, W. B. Hou, P. Pavaskar, M. Aykol and S. B. Cronin, Nano Lett., 2011, 11, 1111–1116 CrossRef CAS PubMed.
  17. T. Bora, H. H. Kyaw and J. Dutta, Electrochim. Acta, 2012, 68, 141–145 CrossRef CAS PubMed.
  18. N. Yao and K. L. Yeung, Chem. Eng. J., 2011, 167, 13–21 CrossRef CAS PubMed.
  19. G. Qin, Y. Zhang, X. Ke, X. Tong, Z. Sun, M. Liang and S. Xue, Appl. Catal., B, 2013, 129, 599–605 CrossRef CAS PubMed.
  20. K. Huo, B. Gao, J. Fu, L. Zhao and P. K. Chu, RSC Adv., 2014, 4, 17300–17324 RSC.
  21. J.-J. Park, D.-Y. Kim, J.-G. Lee, Y.-H. Cha, M. T. Swihart and S. S. Yoon, RSC Adv., 2014, 4, 8661–8670 RSC.
  22. J. C. Colmenares, P. Lisowski and D. Łomot, RSC Adv., 2013, 3, 20186–20192 RSC.
  23. Y. Zhang, T. Xia, M. Shang, P. Wallenmeyer, D. Katelyn, A. Peterson, J. Murowchick, L. Dong and X. Chen, RSC Adv., 2014, 4, 16146–16152 RSC.
  24. Z. Tan, K. Sato, S. Takami, C. Numako, M. Umetsu, K. Soga, M. Nakayama, R. Sasaki, T. Tanaka, C. Ogino, A. Kondo, K. Yamamoto, T. Hashishin and S. Ohara, RSC Adv., 2013, 3, 19268–19271 RSC.
  25. H. J. Oh, J. H. Lee, Y. J. Kim, S. J. Suh, J. H. Lee and C. S. Chi, Appl. Catal., B, 2008, 84, 142–147 CrossRef CAS PubMed.
  26. K. Woan, G. Pyrgiotakis and W. Sigmund, Adv. Mater., 2009, 21, 2233–2239 CrossRef CAS.
  27. M. A. Lazar and W. A. Daoud, RSC Adv., 2012, 2, 447–452 RSC.
  28. T.-J. Liu, Q. Wang and P. Jiang, RSC Adv., 2013, 3, 12662–12670 RSC.
  29. G. K. Pradhan, N. Sahu and K. M. Parida, RSC Adv., 2013, 3, 7912–7920 RSC.
  30. Y. Zhao, Y. He, J. He, Y. Ren, Z. Liu, W. Guo and F. Gao, RSC Adv., 2014, 4, 20393–20397 RSC.
  31. C. Su, Y. Tong, M. Zhang, Y. Zhang and C. Shao, RSC Adv., 2013, 3, 7503–7512 RSC.
  32. C. Chen, Q. Liu, S. Gao, K. Li, H. Xu, Z. Lou, B. Huang and Y. Dai, RSC Adv., 2014, 4, 12098–12104 RSC.
  33. X. Liu, L. Pan, T. Lv, G. Zhu, T. Lu, Z. Sun and C. Sun, RSC Adv., 2011, 1, 1245–1249 RSC.
  34. J. Choi, P. Sudhagar, P. Lakshmipathiraj, J. W. Lee, A. Devadoss, S. Lee, T. Song, S. Hong, S. Eito, C. Terashima, T. H. Han, J. K. Kang, A. Fujishima, Y. S. Kang and U. Paik, RSC Adv., 2014, 4, 11750–11757 RSC.
  35. S. Rajesh, A. F. Ismail and D. R. Mohan, RSC Adv., 2012, 2, 6854–6870 RSC.
  36. X. Tang, Surf. Coat. Technol., 2013, 221, 37–43 CrossRef CAS PubMed.
  37. N. M. Correa, J. J. Silber, R. E. Riter and N. E. Levinger, Chem. Rev., 2012, 112, 4569–4602 CrossRef CAS PubMed.
  38. R. Abazari and S. Sanati, Mater. Lett., 2013, 107, 329–332 CrossRef CAS PubMed.
  39. R. Abazari and S. Sanati, Superlattices Microstruct., 2013, 64, 148–157 CrossRef CAS PubMed.
  40. R. Abazari, F. Heshmatpour and S. Balalaie, ACS Catal., 2013, 3, 139–149 CrossRef CAS.
  41. M. P. Pileni, J. Phys. Chem., 1993, 97, 6961–6973 CrossRef CAS.
  42. R. Abazari, S. Sanati and L. A. Saghatforoush, Mater. Sci. Semicond. Process., 2014, 25, 301–306 CrossRef CAS PubMed.
  43. R. Abazari, A. R. Mahjoub, L. A. Saghatforoush and S. Sanati, Mater. Lett., 2014, 133, 208–211 CrossRef CAS PubMed.
  44. R. Abazari, S. Sanati and L. A. Saghatforoush, Chem. Eng. J., 2014, 236, 82–90 CrossRef CAS PubMed.
  45. K. Anandan and V. Rajendran, Mater. Sci. Semicond. Process., 2011, 14, 43–47 CrossRef CAS PubMed.
  46. F. Ahmed, N. Arshi, M. S. Anwar, R. Danish and B. H. Koo, RSC Adv., 2014, 4, 29249–29263 RSC.
  47. S. Rakshit, S. Chall, S. S. Mati, A. Roychowdhury, S. P. Moulik and S. C. Bhattacharya, RSC Adv., 2013, 3, 6106–6116 RSC.
  48. A. Rachel, M. Subrahmnyam and P. Boule, Appl. Catal., B, 2002, 37, 301–308 CrossRef CAS.
  49. Y. S. Fu, X. W. Du, A. Sergai and J. Liu, J. Am. Chem. Soc., 2007, 129, 16029–16033 CrossRef CAS PubMed.
  50. S. Bai, J. Hu, D. Li, R. Luo, A. Chen and C. C. Liu, J. Mater. Chem., 2011, 21, 12288–12294 RSC.
  51. L. S. Birks and H. Friedman, J. Appl. Phys., 1946, 17, 687–692 CrossRef CAS PubMed.
  52. P. D. Cozzoli, A. Kornowski and H. Weller, J. Am. Chem. Soc., 2003, 125, 14539–14548 CrossRef CAS PubMed.
  53. L. J. Mao and C. Liu, Mater. Res. Bull., 2008, 43, 1384–1392 CrossRef CAS PubMed.
  54. T. Tachikawa, S. Tojo, M. Fujitsuka and T. Majima, J. Phys. Chem. B, 2004, 108, 11054–11061 CrossRef CAS.
  55. K. S. Yang, Y. Dai, B. B. Huang and M. H. Whangbo, Chem. Mater., 2008, 20, 6528–6534 CrossRef CAS.
  56. J. Senthilnathan and L. Philip, Chem. Eng. J., 2010, 161, 83–92 CrossRef CAS PubMed.
  57. P. Calandra, A. Ruggirello, A. Pistone and V. T. Liveri, J. Cluster Sci., 2010, 21, 767–778 CrossRef CAS.
  58. L. Q. Jing, B. F. Xin and F. L. Yuan, J. Phys. Chem. B, 2006, 110, 17860–17865 CrossRef CAS PubMed.
  59. Q. H. Zhang, L. Gao and J. K. Guo, Appl. Catal., B, 2000, 26, 207–215 CrossRef CAS.
  60. J. G. Yu, Y. R. Su, B. Cheng and M. Zhou, J. Mol. Catal. A: Chem., 2006, 258, 104–112 CrossRef CAS PubMed.
  61. A. Vijayabalan, K. Selvam, R. Velmurugan and M. Swaminathan, J. Hazard. Mater., 2009, 172, 914–921 CrossRef CAS PubMed.
  62. M. H. Zhou, J. G. Yu, S. W. Liu, P. C. Zhai and L. Jiang, J. Hazard. Mater., 2008, 154, 1141–1148 CrossRef CAS PubMed.
  63. J. W. Shi, S. H. Chen, S. M. Wang, Z. L. Ye, P. Wu and B. Xu, J. Mol. Catal. A: Chem., 2010, 330, 41–48 CrossRef CAS PubMed.
  64. A. Fuerte, M. D. Hernandez-Alonso, A. J. Maire, A. Martinez-Arias, M. Fernadez-Garcia, J. C. Conesa and G. Munuera, J. Catal., 2002, 212, 1–9 CrossRef CAS.
  65. S. Chin, E. Park, M. Kim and J. Jurng, Powder Technol., 2010, 201, 171–176 CrossRef CAS PubMed.
  66. H. Wang, D. Zhou, S. Shen, J. Wan, X. Zheng, L. Yu and D. L. Phillips, RSC Adv., 2014, 4, 28978–28986 RSC.
  67. J. Nishio, M. Tokumura, H. T. Znad and Y. Kawase, J. Hazard. Mater., 2006, 138, 106–115 CrossRef CAS PubMed.
  68. M. Saquib, M. A. Tariq, M. M. Haque and M. Muneer, J. Environ. Manage., 2008, 88, 300–306 CrossRef CAS PubMed.

Footnote

Electronic supplementary information (ESI) available. See DOI: 10.1039/c4ra10018b

This journal is © The Royal Society of Chemistry 2014
Click here to see how this site uses Cookies. View our privacy policy here.