
Modified hydrothermal reaction (MHT) for CoV2O6·4H2O nanowire formation and the transformation to CoV2O6·2H2O single-crystals for antiferromagnetic ordering and spin-flop†
Chanchal Mondala,
Anup Kumar Sasmala,
S. M. Yusufb,
M. D. Mukadamb,
Jaya Pala,
Mainak Gangulya and
Tarasankar Pal*a
aDepartment of Chemistry, Indian Institute of Technology, Kharagpur-721302, India. E-mail: tpal@chem.iitkgp.ernet.in
bSolid State Physics Division, Bhabha Atomic Research Centre, Mumbai 400 085, India
First published on 28th October 2014
Abstract
A modified hydrothermal protocol (MHT) has been adopted for the synthesis of a single-crystal of CoV2O6·2H2O. The crystals grew as a result of prolonged hydrothermal reaction between precursor salts of CoCl2 and ammonium vanadate. At first, the adopted reaction conditions resulted in nanowires of CoV2O6·4H2O. Then with increased reaction time, nanowires changed to single crystals of molecular formula CoV2O6·2H2O. The nanowires have lengths of several tens of micrometers and average diameter of 100 nm. The well defined structure crystallizes in the orthorhombic crystal system having space group Pnma and it displays a = 5.5647(2) Å, b = 10.6870(5) Å, c = 11.8501(5) Å, α = β = γ = 90.00°. Here, each vanadium atom is tetrahedrally connected to four oxygens where two oxygens are connected to vanadium atoms and another two connected to cobalt atoms. Magnetic moment measurement of the nanowires indicates that antiferromagnetic ordering is observed at around 14.9 K and 6.8 K and field induced antiferromagnetic to ferromagnetic (spin-flop-type) transitions have been observed at a low temperature (5–8.8 K) range while these are absent in the as-synthesized single crystals.
Introduction
From the past decade, synthesis of metal vanadates whether they are nanomaterials or single crystals has been an intense area of research among scientists due to their intriguing physical and chemical properties1 and their innumerable applications in various fields e.g., catalysts,2 implantable cardiac defibrillators (ICDs),3 lithium battery electrode materials.4–7 Vanadate groups can act as links for transition-metal polyhedral units giving rise to various frameworks which are entirely different from the inorganic main-group acid radical based compounds, such as (PO4)3−, (BO4)5−, (SO4)2−, (SiO4)4− etc. It is observed that vanadium can exhibit very rich crystal chemistry with several coordination geometries depending on the metal centre, the geometry of the ligand and the vanadium oxide subunit.Vanadium generally shows three types of coordination modes e.g., (VO4)3− tetrahedron, (VO5)5− square pyramid or trigonal bipyramid and (VO6)7− octahedron. The research of transition-metal vanadates not only provides different coordination environments having different structural chemistry, but also shows a variety of interesting magnetic behaviors. He et al. synthesized a polymorph of copper(II) vanadate, Cu2(VO4)(OH), containing layered magnetic sublattice under hydrothermal reaction.8
Synthesis of metal vanadates has fetched noteworthy attention due to their intriguing physical and chemical properties. These metal vanadates have been enormously applied in high energy density lithium batteries, sensors and photocatalysis.9 Recently, Zhang et al. synthesised calcium vanadate nanorods adopting hydrothermal reaction process.10 Yu et al. reported the synthesis of AgVO3 nanoribbons by a pyridine assisted solution approach.11 Chen et al. reported synthesis of FeVO4 nanorods taking hydrothermal protocol.12 Among the cobalt vanadates various approaches have been adopted for the synthesis of CoV2O6 nano/microstructures due to their electrochemical, catalytic, and magnetic properties.13 For instances, Tarascon et al. have synthesized CoV2O6 materials and studied its Li removal capacity.14 Kim et al. have synthesized cobalt vanadate for use in lithium secondary cell via mild combustion of V2O5, Co(NO3)2 and glycine.15
Low-dimensional inorganic magnetic materials have a wide range of attractive magnetic and electronic properties and it depends on its electron configuration and the arrangement of the magnetic ions. The magnetic networks of transition metal vanadates offer chemists to explore new functionalities e.g., magnetoresistance,16 superconductivity,17 thermoelectricity,18 magnetocapacitance19 and magnetoelectric effects.20 Maignan et al. have studied magnetodielectric coupling and magnetization plateaus in α-CoV2O6 crystals.21
In this report, we have demonstrated for the first time a facile, cost effective hydrothermal technology for the synthesis of CoV2O6·4H2O nanowire and CoV2O6·2H2O microcrystal exploiting CoCl2 and ammonium vanadate as a starting material. The structure of the single crystal has been elucidated properly. The highly crystalline nanowire exhibits diameter approximately of 70–120 nm and length of about 80–100 mm. An in-depth growth mechanism of one-dimensional nanowires is established by continuously changing the time-dependent evolution of various morphologies. In addition, the magnetic properties of the as-prepared nanowires and the microcrystal have been portrayed.
Experimental section
Materials and methods
The relative information is depicted in ESI.†Synthesis of CoV2O6·4H2O nanowire and single crystal of CoV2O6·2H2O
In a typical synthesis of nanowire and single crystal, at first, 7 mL 0.1 M aqueous solution of CoCl2 was mixed with 3 mL 0.1 M aqueous solution of NH4VO3 in a beaker under stirring condition for 5 minutes. Then the mixture was put in a screw capped test tube and heated hydrothermally at ∼170 °C for 60 h by means of a tungsten bulb (100 W) light in a closed wooden box. The experimental set up for the preparation of nanomaterial and single crystal is known as modified hydrothermolysis (MHT).22 It leads to the formation of a black colored single crystal. A grey color precipitate was obtained initially and with prolonged reaction time it forms single crystal. After the reaction the grey precipitate and crystal was collected and washed several times with water and ethanol. The precipitate was separated from impurities, dried under vacuum and kept for characterization and magnetic moment measurement.X-ray crystallography
Single crystal of the CoV2O6·2H2O was obtained from the reaction between aqueous solution of CoCl2 and ammonium vanadate under hydrothermal condition. It was mounted on a glass fiber and placed in the X-ray diffractometer equipped with a graphite monochromator Mo-Ka radiation (λ = 0.71073 Å) at T = 293(2). The structure was solved by direct methods using SHELXS-97 programme23 and refined by full matrix least squares method on F2 by SHELX-97.24 The hydrogen atoms were located at calculated positions and refined with isotropic thermal parameters whereas, the non-hydrogen atoms were refined with anisotropic thermal parameters.Magnetic moment measurement
The dc magnetization measurements were carried out on both the single crystal and nanowire using a vibrating sample magnetometer (Cryogenic, UK make), as a function of temperature and magnetic field. Magnetization as a function of applied field was measured after cooling the sample to the measurement temperature under zero field. For the temperature dependent zero-field-cooled (ZFC) magnetization measurements under constant magnetic field, the sample was first cooled from room temperature down to 5 K in zero external magnetic field. After applying the magnetic field at 5 K, the magnetization was measured in the warming cycle with the field on. Whereas, for the temperature dependent field-cooled (FC) magnetization measurements, the sample was cooled in the same field (measuring field in the ZFC case) down to 5 K and then FC magnetization was measured in the warming cycle under the same field.Results and discussion
X-ray crystallographic structure of CoV2O6·2H2O
The X-ray crystal structure of CoV2O6·2H2O, comprised of cobalt, vanadium, oxygen and hydrogen, is reported here. The structure crystallizes in the orthorhombic crystal system with space group Pnma displaying a = 5.5647(2) Å, b = 10.6870(5) Å, c = 11.8501(5) Å, α = β = γ = 90.00°, bond precision of Co–O = 0.0015 Å at the wavelength of 0.71073 Å and temperature 273 K.† The summary of crystal, refinement and intensity collection data are given in Table 1. For all other data please see the CIF file.| Formula | CoV2O6·2H2O |
| CCDC no | 995345 |
| Mr | 292.84 |
| Crystal system | Orthorhombic |
| Space group | Pnma |
| a | 5.5647(2) Å |
| b | 10.6870(5) Å |
| c | 11.8501(5) Å |
| α | 90.00° |
| β | 90.00° |
| γ | 90.00° |
| V | 704.72(5) Å3 |
| Z | 1 |
| Dcalcd | 2.153 g cm−3 |
| μ | 3.637 mm−1 |
| GOF on F2 | 1.086 |
| Final R indices [I > 2σ(I)] | R1 = 0.0166, wR2 = 0.0513 |
| R indices (all data) | R1 = 0.0174, wR2 = 0.0517 |
The ORTEP diagram of the crystal is shown in Fig. 1.
 | ||
| Fig. 1 ORTEP diagram of the crystal CoV2O6·2H2O. | ||
The three dimensional framework structure of the crystal unit is given in the Fig. 2.
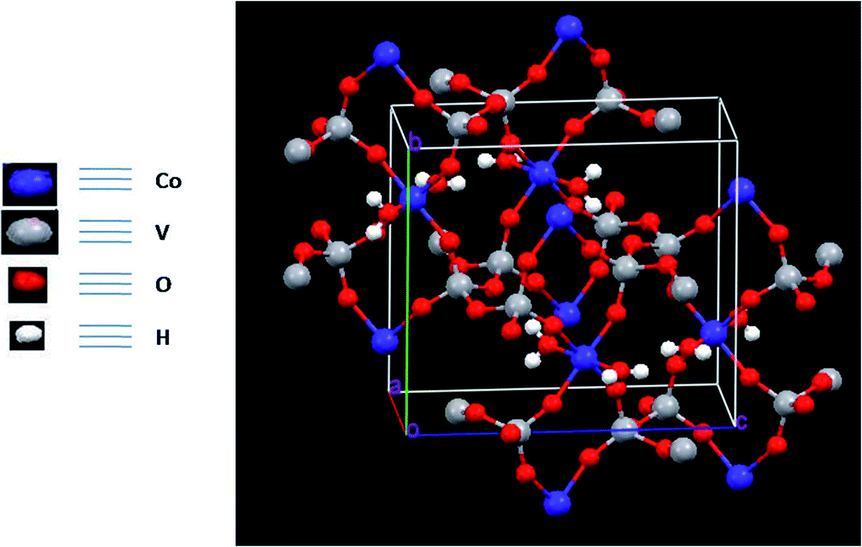 | ||
| Fig. 2 Three dimensional framework structure of the crystal unit. | ||
The 3D structure of unit crystal system is exhibiting that there are four cobalt metal atoms in one unit cell where each of cobalt atoms is coordinated by six oxygens (four from four vanadium units i.e., VO4 and two from water units i.e., H2O). And any two cobalt atoms are connected through O–V(O2)–O–V(O2)–O sequence within the unit cell. Each vanadium atom is tetrahedrally bonded by four oxygens (two oxygens are connected to vanadium atoms and other two connected to cobalt atoms). The bond lengths and bond angels are given in Tables 2 and 3 also.
| Bond | Bond lengths (in angstrom) |
|---|---|
| V1–O6 | 1.6289(12) |
| V1–O3 | 1.6501(13) |
| V1–O5 | 1.8001(12) |
| V1–O5 | 1.8008(12) |
| Co1–O3 | 2.0524(12) |
| Co1–O3 | 2.0524(12) |
| Co1–O6 | 2.0553(13) |
| Co1–O6 | 2.0553(13) |
| Co1–O7 | 2.068(2) |
| Co1–O4 | 2.1122(19) |
| O5–V1 | 1.8001(12) |
| O6–Co1 | 2.0553(13) |
| Bond angles | Bond angle (in degrees) |
|---|---|
| O6–V1–O3 | 109.80(7) |
| O6–V1–O5 | 107.63(7) |
| O3–V1–O5 | 111.64(6) |
| O6–V1–O5 | 109.27(7) |
| O3–V1–O5 | 109.18(7) |
| O5–V1–O5 | 109.28(4) |
| O3–Co1–O3 | 85.72(7) |
| O3–Co1–O6 | 177.18(6) |
| O3–Co1–O6 | 91.90(5) |
| O3–Co1–O6 | 91.90(5) |
| O3–Co1–O6 | 177.18(6) |
| O6–Co1–O6 | 90.43(8) |
| O3–Co1–O7 | 92.07(6) |
| O3–Co1–O7 | 92.07(6) |
| O6–Co1–O7 | 89.53(6) |
| O6–Co1–O7 | 89.53(6) |
| O3–Co1–O4 | 88.03(6) |
| O3–Co1–O4 | 88.03(6) |
| O6–Co1–O4 | 90.37(5) |
| O6–Co1–O4 | 90.37(6) |
| O7–Co1–O4 | 179.87(9) |
| V1–O3–Co1 | 145.69(8) |
| V1–O5–V1 | 134.05(7) |
| V1–O6–Co1 | 163.36(9) |
Additionally the layer structures are also given in Fig. 3 on ab plane which displays the layers of vanadium (white) and cobalt atoms (blue).
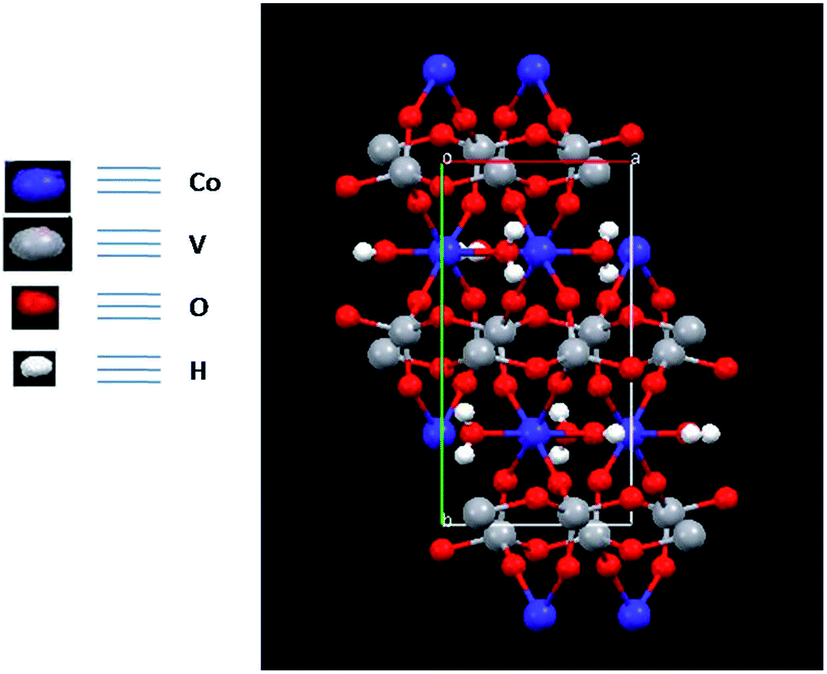 | ||
| Fig. 3 Layer structure of the crystal on ab plane. | ||
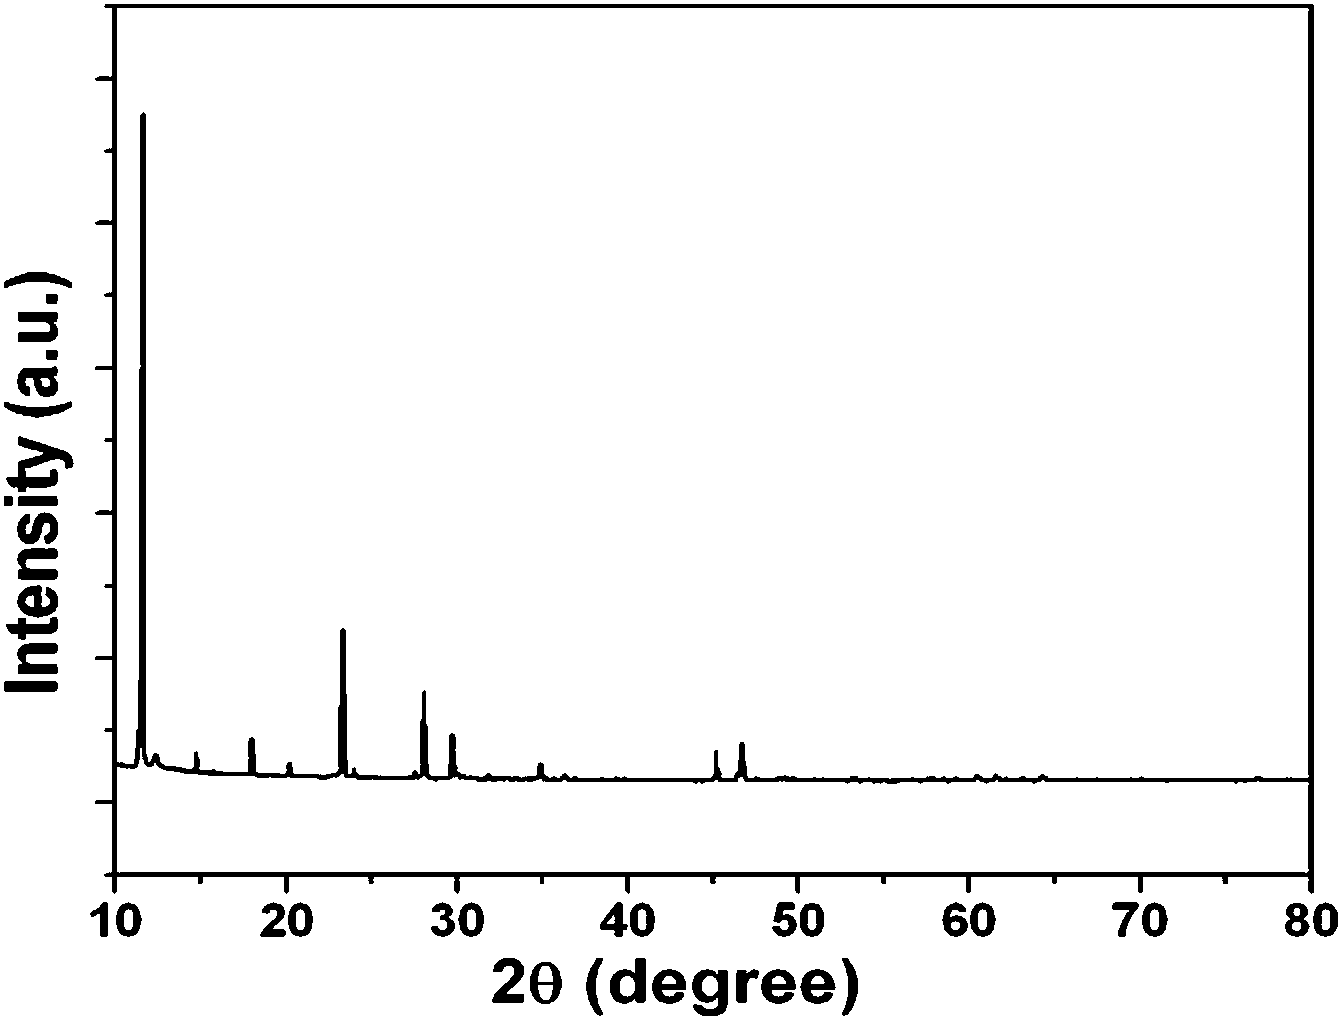 | ||
| Fig. 4 XRD pattern of CoV2O6·4H2O nanowire. | ||
Fig. 5 shows the FESEM images of cobalt vanadium oxide nanowire patterns at various magnifications. Fig. 5 displays that the shape of the nanowire pattern is clear and sharp, which exhibits a circular figuration having diameter of about 100 nm. The magnified SEM image authenticates that the surface of the nanowires is highly smooth, but the diameter is not uniform along its entire length. The variation in diameter of wires along its length is due to the structure shrinkage originated from the recrystallization of the hydrothermal precursors.
 | ||
| Fig. 5 FESEM images of CoV2O6·4H2O nanowire (a) and (b) low magnification, (c) and (d) medium magnification. | ||
Fig. 6 shows the mechanism of stepwise evolution of nanowire due to the reaction of CoCl2 and NH4VO3 under hydrothermal condition and the evolution of the nanowire of the samples was analyzed using FESEM analysis (Fig. 7). It is seen that the precipitate after 10 h consists of a large number of stacked nanoplates. The diameter of the nanoplates is about 100 nm and thickness is 40 nm as shown in Fig. 7a and b. After hydrothermal treatment for 24 h, the wire like structure starts to form and coexists with the stacked plates (Fig. 7c and d). With the reaction going on to 48 h, the proportion of the nanowires is increased and the stacked plates are completely transformed into bundles of nanowires. The nanowires morphology exists with its single crystal formed with the increased reaction time.
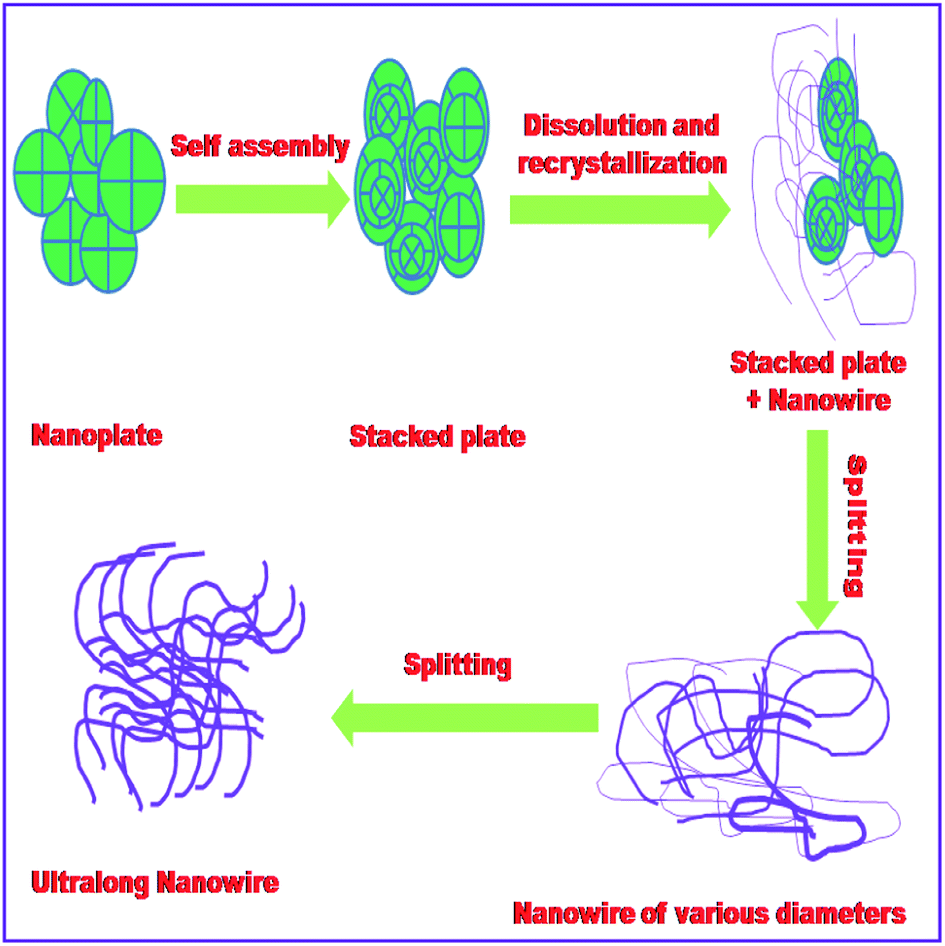 | ||
| Fig. 6 Schematic illustration for the formation of nanowire. | ||
 | ||
| Fig. 7 FESEM images of the products obtained at different hydrothermal reaction times: (a) 5 h (medium magnification), (b) 5 h (high magnification); (c) 24 h (medium magnification), (d) 24 h (high magnification). | ||
According to the observed shape transformation in the present experimental condition the growth process gains strong evidence for designing 1D material from 3D structures. A combination of ‘‘dissolution recrystallization’’ and the ‘‘Ostwald ripening–splitting’’ mechanisms is presumably responsible for the rationally controlled synthesis of cobalt vanadium oxide nanowires. The growth mechanism of nanowires has been depicted in Fig. 6. In the primary stage, nanoplates with 2D superstructure were obtained and then they assembled with each other with the increase of reaction time to generate the stacked plates. These 3D stacked plates were splitted into dispersed nanowires with nanoscale thickness. With prolonged reaction time, the formation of wire-like product was increased with the simultaneous decrease of the stacked plates.
This fascinating tuning of morphology can be enlightened by the kinetically controlled ‘‘dissolution recrystallization’’ mechanism. Secondly, the observed ultralong nanowires with uniform morphology (Fig. 5) indicates that these wires are splitted from 3d stacked plates (Fig. 6), which akin to the proposition of ‘‘Ostwald ripening–splitting’’ mechanism. Hence, it is worth revealing that the preferential growth of the 1D nanowire at a particular direction presumably depend on the dissolution of 3D superstructures i.e., stacked plates.25–29
EDX spectrum as shown in Fig. S1† depicts the presence of three elements i.e., Co, V and O in the as synthesized nanowires. Area mapping indicates that Co, V, O are homogeneously distributed all over the sample. TEM images (Fig. 8a and b) are also in good agreement with the FESEM images. It displays long nanowires having micrometer long length and diameter of ∼80 nm. Fig. 8c shows the SAED pattern of the nanomaterial which indicates as-synthesized nanowires are single crystalline in nature.
 | ||
| Fig. 8 (a) and (b) TEM images of the nanowire, (c) SAED pattern of the nanowire. | ||
Fig. S2† shows the DRS spectrum of the as-synthesized nanowire. It shows a broad absorption band ranging from 200 nm to 600 nm. It displays an absorption maximum at 380 nm. Fig. S3† exhibits the FTIR spectrums of the as-prepared nanowire. It displays two intense bands at 934 and 832 cm−1 which can be attributed to the symmetric and asymmetric stretching of VO4 units, respectively. Relatively broader band in the region of 550–700 cm−1 is due to the asymmetric or symmetric stretches of V–O–V bonds. The relatively weak signature at around 430 cm−1 corroborates with the stretching of Co–O modes. The bands around 3448 and 1639 cm−1 ascribed to free water with the stretching of O–H and flexural vibrations of the O–H, respectively.30,31
Magnetic moment analysis
Significant research interest has been paid on the synthesis and study of magnetic materials due to their great value in investigating complex magnetostructural relationships and some fundamental magnetic behaviors leading to various applications. Inspired by the previous studies we have carried out magnetic moment measurement of our as-synthesized nanowire and single crystal.Fig. 9a shows ZFC and FC dc magnetization as a function of temperature under 200 Oe magnetic field for the Co2V4O6·4H2O nanowires. The magnetization of the sample increases with decreasing temperature with a sharp peak around 14.9 K indicating an antiferromagnetic-like ordering as found in many antiferromagnetic systems.32–34 As the temperature is decreased further, another antiferromagnetic-like peak has been observed around 6.8 K. It will be interesting to find out the antiferromagnetic ground state of these transitions. It may arise due to competition between antiferromagnetic Co chains and ferromagnetic Co ions. However, this type of behavior is not well understood till now for such systems.
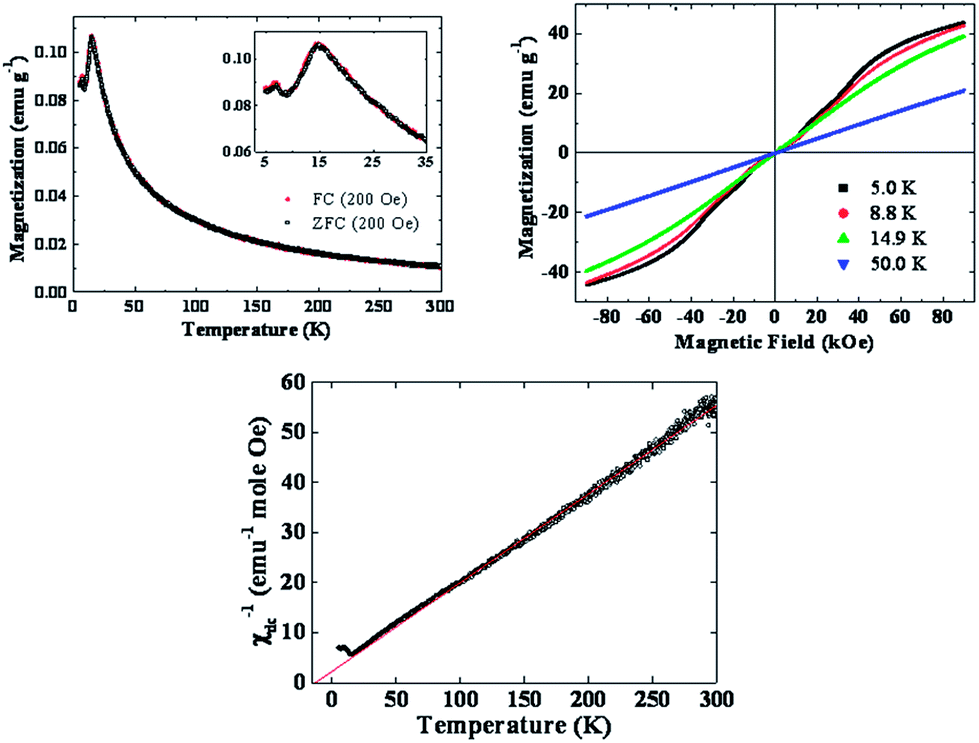 | ||
| Fig. 9 (a) Temperature dependence of magnetization M(T) under ZFC and FC conditions with H = 200 Oe for the CoV2O6·4H2O nanowire sample. Inset: enlarged view of low temperature curves, (b) magnetization as a function of magnetic field at various temperatures for the CoV2O6·4H2O nanowire sample, (c) temperature dependence of inverse dc susceptibility for CoV2O6·4H2O nanowire sample fitted with the Curie Weiss law. | ||
To explore magnetic properties of the system elaborately, we have done here magnetic field dependence of magnetization study at various temperatures which has been depicted in Fig. 9b. At 50 K, the sample shows a clear paramagnetic behavior. At lower temperatures (5 and 8.8 K), field induced (spin-flop-type) transitions have been observed as reported in many spin systems in the literature.35–37 It is known that such spin flop transition takes place for a magnetic substance where antiferromagnetic state changes to ferromagnetic state. Then the system behaves like a frustrated magnetic system (lies in ab plane) which is common in this type of sample. However, jump in magnetization is not sharp suggesting the complex nature of spin arrangement in our system. Fig. 9c shows the temperature dependence of inverse dc susceptibility fitted with the Curie Weiss law χ = C/(T − θ) for T > 100 K for the Co2V4O6·4H2O nanowire. Here the fitting yields the Curie constant C = 5.65 emu K mol−1 Oe−1, and the Weiss constant θ =−13.1 K. The derived negative value of Weiss constant is an indicative of an antiferromagnetic interaction in the sample. This is presumably due to the antiferromagnetic coupling of the Co2+ atoms present in the 1D sample. An effective paramagnetic moment μeff of 6.72μB per formula unit has been derived. The magnetic moment is much greater than the high spin Co2+ value which indicates combine effect of spin and orbital components. It is evident that the as-synthesized sample does not show any measurable remanence as well as coercivity.
The temperature dependence of magnetization for the single crystal CoV2O6·2H2O sample, measured again under 200 Oe in two different orientations of the sample, is shown in Fig. 10a. The magnetization curves are very close to each other indicating that magnetization does not depend on the orientations of the sample. Besides, the sharp antiferromagnetic type peaks as observed for the nanowires, in M vs. T curves, are absent for the single crystal sample. Fig. 10b shows the M vs. H curves at 5 K for the single crystal sample measured in two different orientations (as in the case of M vs. T study, shown in Fig. 10a). The magnetization curves are very close to each other indicating that no anisotropic magnetic behavior is present with respect to these two directions.
 | ||
| Fig. 10 (a) Temperature dependence of the magnetization M(T) under H = 200 Oe in two different orientations for the CoV2O6·2H2O single crystal sample (b) magnetization as a function of magnetic field 5 K. In two different orientations for the CoV2O6·2H2O single crystal sample. | ||
The observed magnetic behaviour corresponds to a soft ferromagnetism and not superparamagnetism. The soft ferromagnetic materials do show saturation in M vs. H curve without negligible hysteresis. In fact, the fitting of M(H) curve (at 5 K) yields the total angular momentum quantum number J to be ∼5/2, indicating that the observed behaviour is not associated to any superparamagnetism.
It is interesting to note that none of these samples show any measurable remanence or coercivity in M vs. H curves at any temperature, a common phenomena indeed.
The magnetization data for the CoV2O6·4H2O nanowire sample was recorded on a random assembly of nanowires, whereas, in the other case, the single crystal of CoV2O6·2H2O was used. The data recorded on the crystalline sample, therefore, give a directional average magnetization of the nanowires.
When the field is applied along the easy axis of moments (along the magnetocrystalline anisotropy direction), a step like behaviour is expected in the M(H) curve due to the field induced antiferromagnetic to ferromagnetic (spin-flop) transition. Whereas, when the field is applied along hard directions (perpendicular to easy direction), there is no such spin flop transition and the change in magnetization with applied magnetic field is rather gradual, leading to a field induced saturation.
For the CoV2O6·4H2O crystalline nanowires (Fig. 9b), the applied field matches with the easy direction of some of the crystals (usually 1/3rd of the crystals, on the average), and a step in M(H) curve is expected to occur for those crystallites due to a spin flop transition.
Whereas, from the data shown in Fig. 10b for the single crystal sample, it is evident that the field was not applied along the easy direction of moments resulting only a gradual increase in M(H) curve i.e. without any spin flop transition. The sample behaviour is even reflected in our M(T) data. In Fig. 9a, a shoulder like nature of M(T) curve for the nanowire is evident. Whereas, no such peak is present in the M(T) curve for the single crystal sample in Fig. 10a.
This type of spin flop transition in antiferromagnets may offer a road to realize large magnetoelectric coupling at high temperatures. These results may open a new avenue to the magnetoelectric effect in a simple collinear antiferromagnet obtained from simple MHT.
Conclusions
A new crystal structure of CoV2O6·2H2O with space group Pnma has been achieved successfully via crystallization of Co2V2O6·4H2O nanowire adopting modified hydrothermal protocol. The nanowire and single crystals are obtained from the reaction of the precursors i.e., CoCl2 and ammonium vanadate. It has been found that in the crystal system each vanadium atom is tetrahedrally connected to four oxygens where two oxygens are connected to vanadium atoms and another two connected to cobalt atoms leading to the three dimensional framework structure. The magnetic moment measurement of the nanowire has also been depicted which indicates that an antiferromagnetic-like ordering is observed at around 14.9 K and 6.8 K in the aforesaid crystal. The present study portrays the significance of crystal engineering of inorganic materials in the field of multifunctional molecular-based magnetic materials.Acknowledgements
Authors are thankful to IIT Kharagpur, BRNS, CSIR, New Delhi for financial assistance.References
- H. Shi, Z. Li, J. Kou, J. Ye and Z. Zou, J. Phys. Chem. C, 2011, 115, 145–151 CAS.
- M. Machida, Y. Miyazaki, Y. Matsunaga and K. Ikeue, Chem. Commun., 2011, 47, 9591–9593 RSC.
- A. M. Crespi, S. K. Somdahl, C. L. Schmidt and P. M. Skarstad, J. Power Sources, 2001, 96, 33–38 CrossRef CAS.
- Y. Tang, J. Zhou, J. Liu, L. Liu and S. Liang, Int. J. Electrochem. Sci., 2013, 8, 1138–1145 CAS.
- M. I. Khan, S. Deb, V. O. Golub, C. J. O'Connor and R. J. Doedens, J. Mol. Struct., 2004, 707, 217–222 CrossRef CAS PubMed.
- L. Wang, H. Zhang, J.-P. Zhang, B. Niu and S.-X. Cui, Chin. J. Chem., 2004, 22, 638–641 CrossRef CAS.
- E. V. Murashova, Y. A. Velikodnyi, M. A. Potapov and V. K. Trunov, Izv. Akad. Nauk SSSR, Neorg. Mater., 1988, 24, 519–521 CAS.
- S.-Y. Zhang, Z.-Z. He, M. Yang, W.-B. Guo and Y.-Y. Tang, Dalton Trans., 2014, 43, 3521–3527 RSC.
- E. Andrukaitis, J. P. Cooper and J. H. Smit, J. Power Sources, 1995, 54, 465–469 CrossRef CAS.
- L. Z. Pei, Y. Q. Pei, Y. K. Xie, C. Z. Yuan, D. K. Li and Q.-F. Zhang, CrystEngComm, 2012, 14, 4262–4265 RSC.
- J.-M. Song, Y.-Z. Lin, H.-B. Yao, F.-J. Fan, X.-G. Li and S.-H. Yu, ACS Nano, 2009, 3, 653–660 CrossRef CAS PubMed.
- H. Ma, X. Yang, Z. Tao, J. Liang and J. Chen, CrystEngComm, 2011, 13, 897–901 RSC.
- M. Lenertz, J. Alaria, D. Stoeffler, S. Colis and A. Dinia, J. Phys. Chem. C, 2011, 115, 17190–17196 CAS.
- S. Denis, E. Baudrin, F. Orsini, G. Ouvrard, M. Touboul and J.-M. Tarascon, J. Power Sources, 1999, 81, 79–84 CrossRef.
- Y. T. Kim, K. Gopukumar, B. Kwang and B. W. Cho, J. Power Sources, 2002, 112, 504–508 CrossRef CAS.
- A. Sadhu and S. Bhattacharyya, Chem. Mater., 2014, 26, 2210 CrossRef CAS.
- K. Takada, H. Sakurai, E. Takayama-Muromachi, F. Izumi, R. A. Dilanian and T. Sasaki, Nature, 2003, 422, 53–55 CrossRef CAS PubMed.
- A. C. Masset, C. Michel, A. Maignan, M. Hervieu, O. Toulemonde, F. Studer, B. Raveau and J. Hejtmanek, Phys. Rev. B: Condens. Matter Mater. Phys., 2000, 62, 166–175 CrossRef CAS.
- Z. Huidong, W. Jianguo, L. Mingxing, H. Lei, L. Zitong, Z. Deqing and H. Bin, J. Phys. Chem. B, 2013, 117, 14136–14140 CrossRef PubMed.
- Y. J. Choi, H. T. Yi, S. Lee, Q. Huang, V. Kiryukhin and S.-W. Cheong, Phys. Rev. Lett., 2008, 100, 047601 CrossRef CAS.
- K. Singh, A. Maignan, D. Pelloquin, O. Perez and C. Simon, J. Mater. Chem., 2012, 22, 6436–6440 RSC.
- C. Mondal, M. Ganguly, J. Pal, A. Roy, J. Jana and T. Pal, Langmuir, 2014, 30, 4157–4164 CrossRef CAS PubMed.
- G. M. Sheldrick, Acta Crystallogr., Sect. A: Found. Crystallogr., 1990, 46, 467–473 CrossRef.
- G. M. Sheldrick, SHELXL-97, Program for Crystallography Refinement, University of Gottingen, Gottingen, Germany, 1997 Search PubMed.
- S. Zhang, W. Li, C. Li and J. Chen, J. Phys. Chem. B, 2006, 110, 24855–24863 CrossRef CAS PubMed.
- C. J. Patridge, C. Jaye, H. Zhang, A. C. Marschilok, D. A. Fischer, E. S. Takeuchi and S. Banerjee, Inorg. Chem., 2009, 48, 3145–3152 CrossRef CAS PubMed.
- C. Li, S. Zhang, F. Cheng, W. Ji and J. Chen, Nano Res., 2008, 1, 242–248 CrossRef CAS.
- C. Li, F. Cheng, W. Ji, Z. Tao and J. Chen, Nano Res., 2009, 2, 713–721 CrossRef CAS.
- Z. A. Peng and X. Peng, J. Am. Chem. Soc., 2001, 123, 1389–1395 CrossRef CAS.
- X. Gao, P. Ruiz, Q. Xin, X. Guo and B. Delmon, Catal. Lett., 1994, 23, 321–337 CrossRef CAS.
- J.-M. Song, Y.-Z. Lin, H.-B. Yao, F.-J. Fan, X.-G. Li and S.-H. Yu, ACS Nano, 2009, 3, 653–660 CrossRef CAS PubMed.
- P. K. Manna, S. M. Yusuf, R. Shukla and A. K. Tyagi, Appl. Phys. Lett., 2010, 96, 242508 CrossRef PubMed.
- R. Shukla, A. K. Bera, S. M. Yusuf, S. K. Deshpande, A. K. Tyagi, W. Hermes, M. Eul and R. Pottgen, J. Phys. Chem. C, 2009, 113, 12663–12668 CAS.
- S. P. Singh, S. M. Yusuf, S. Yoon, S. Baik, N. Shin and D. Pandey, Acta Mater., 2010, 58, 5381–5392 CrossRef CAS PubMed.
- A. Jain, S. Singh and S. M. Yusuf, Phys. Rev. B: Condens. Matter Mater. Phys., 2006, 74, 174419 CrossRef.
- N. Thakur, S. M. Yusuf, P. L. Paulose and L. Keller, J. Appl. Phys., 2012, 111, 063908 CrossRef PubMed.
- S. M. Yusuf, N. Thakur, M. Medarde and L. Keller, J. Appl. Phys., 2012, 112, 093903 CrossRef PubMed.
Footnote |
| † Electronic supplementary information (ESI) available: Materials and instrument, EDX and DRS spectrum are included In ESI. CCDC 995345. For ESI and crystallographic data in CIF or other electronic format see DOI: 10.1039/c4ra09976a |
| This journal is © The Royal Society of Chemistry 2014 |