Nanoscale phase stability in Li ion battery anode materials
Xiaoyan Song*,
Yuanyuan Zhou,
Jiangtao He,
Wenwu Xu,
Haibin Wang and
Xuemei Liu
College of Materials Science and Engineering, Key Laboratory of Advanced Functional Materials, Ministry of Education of China, Beijing University of Technology, Beijing 100124, China. E-mail: xysong@bjut.edu.cn
First published on 3rd November 2014
Abstract
A thermodynamic model was developed in particular for nanocrystalline partially ionic solids, which represent a group of Li ion battery anode materials. The lithium compounds were used as examples to demonstrate the model applications in studies of phase stability and phase transformation behavior in the nanoscale anode system. The peritectic and eutectic transformations were described systematically concerning the reaction temperatures and liquid concentrations at various equilibria, in which the grain size effects on the equilibrium, stability and transformation of Li-containing phases were quantified. To verify the model predictions, a series of experiments were performed using the nanocrystalline Li–Si system as sample materials. The experimental finding confirmed the model calculations, based on which the correlation of phase stability, temperature, grain size and critical grain size was proposed.
1 Introduction
As compared with conventional polycrystalline materials, distinctly different phase transformation behavior has been discovered in a variety of nanocrystalline materials such as Ni–Ti,1 Fe–Mn,2 Ti–Al,3 Sm–Co,4 Mo–Si,5 Cd–Se6 and Li–C.7 As the most representative microstructure characteristic, the interface (e.g. grain boundary and phase boundary) plays a significant role in the thermodynamic properties hence the phase stability of the nanocrystalline materials.8 Therefore, the conventional thermodynamic models in which the effect of interface on the fundamental functions is neglected can not accurately describe the thermodynamic properties of the nanocrystalline materials.Early work was performed by Jiang et al.9 to quantify the size-dependence of solid–liquid interface energy and apply the model to describe the melting behavior of metallic nanoparticles.10,11 Since the concept “nanothermodynamics” was proposed by Hill in 2001,12 in the last decade some thermodynamic models have been developed for nanomaterials, focusing on the nanograin growth behavior of metals13–15 or solid-state phase transformations in nanoscale alloy systems.16–18 However, the “nanothermodynamic” models that describe solid–liquid or solid–gas phase transformations in nanocrystalline bulk materials, especially in nanocrystalline partially ionic solids, have been rarely reported in the literature so far. The partially ionic solids are a special group of crystalline compounds in which the ionic and covalent bonds coexist.19 They are common in the compounds formed for instance by metal and semiconductor elements20 or by lithium and non-metallic elements.21 The phase stability of the partially ionic lithium compounds is closely related to the intercalation/deintercalation behavior of Li ion, and hence the electrochemical properties of Li ion battery anodes.
Because of the greatly increased volume fraction of the interface that provides fast transport path for the Li ions22 and the excess volume at interface that allows additional storage of Li ions and generates favorable accommodation strain in the process of charging and discharging,23 particularly, the nanocrystalline structure provides a more homogeneous volume expansion for Li ion,24 the nanocrystalline anode materials have attracted increasing attention in the development of candidates for high performance Li ion batteries.25 Accordingly, the nanoscale phase stability and phase transformation characteristics of the partially ionic lithium compounds are especially important.
Based on the above background, in this paper our attention is concentrated on the development of a thermodynamic model in particular for the nanocrystalline partially ionic solids. The Li–Si compounds were used as examples to demonstrate the applications of the model in studies of phase stability and phase transformation behavior, as well as their grain size dependence, in the nanocrystalline partially ionic solids. Moreover, a series of experiments were performed to verify the model predictions. The structure of the paper is: Section 2 describes the development of the thermodynamic model, where the grain size effects on the thermodynamic properties of the nanocrystalline partially ionic solids are quantified; Section 3 demonstrates the applications of the model in calculations of the equilibrium, stability and transformation of phases, with the peritectic and eutectic reactions as examples; Section 4 shows the comparisons between the experimental results and model predictions using the nanocrystalline Li22Si5 solid as the starting material.
2 Thermodynamic model for nanocrystalline partially ionic solids
In the nanocrystalline bulk materials, with the decrease in grain size the volume fraction of grain boundaries increases. The nanograin boundary can be assumed as a “dilated crystal”26,27 having an expanded unit cell in which the nearest-neighbor separation between atoms is larger than the equilibrium interatomic distance in the grain interior. As a result, the pressure in the nanograin boundary region is generated. Apply the isothermal equation of state for partially ionic solids28 and take the temperature effect on the universal equation of state29 into consideration, the pressure in the nanograin boundary region is expressed as:| P = −E0(C′a*e−a*/l′ + Z′/X2)/(3X2V0) + α0B0(T − TR) | (1) |
| C′ = (Z′ − 1)/E*(a*0) | (2) |
Here, E*(a*) is the universal energy function that describes the partially covalent character of the bond and also the repulsion between the atomic cores at a distance r, which has the expression as:30
| E*(a*) = −(1 + a*)exp(−a*) | (3) |
a* is the scaled length:
| a* = (X − r′0/r0)/l′ | (4) |
| a*0 = l′Z′/(Z′ − 1 − Z′l′) | (5) |
r′0 is the value of r for which E*(a*) has a minimum:
| r′0 = r0(1 − a*0l′) | (6) |
The normalized scaling length l′ is:30
| l′ = [E0/(d2E(r)/dr2)r0]1/2/r0 | (7) |
From the above equations, the parameter l′ can be obtained, i.e. by second differentiating the pressure in the grain boundary region (eqn (1)) with respect to r at r0:
| 2Γ(l′)2 = (1 − Z′) + 2Z′l′ − 2Z′(l′)2 | (8) |
then combining with differentiating the bulk modulus with respect to pressure at P = 0:
| B′0 = 1 − Z′/Γ + [4(Γ + Z′)l′ − Z′]/[6Γ(l′)2] | (9) |
The Grüneisen parameter of the “dilated crystal” at the grain boundary can be derived, as suggested by Wagner:27
| γ = −1 − 0.5V (∂2P/∂V2 – 10P/9V2)/(∂P/∂V + 2P/3V) | (10) |
Thus, the thermodynamic properties in the grain boundary region, i.e. the enthalpy Hb, entropy Sb and Gibbs free energy Gb, can be calculated:26
| Hb = E + PV | (11) |
Sb = CVγ![[thin space (1/6-em)]](https://www.rsc.org/images/entities/char_2009.gif) ln(V/V0) ln(V/V0)
| (12) |
Gb = Hb + CV (T − TR) − T[Sb + CV![[thin space (1/6-em)]](https://www.rsc.org/images/entities/char_2009.gif) ln(T − TR)] ln(T − TR)]
| (13) |
The subscript b denotes the grain boundary. In eqn (11), E is the cohesive energy of atoms in the grain boundary region:30
| E = E0 (C′ E* (a*) − Z′/X) | (14) |
CV is the specific heat capacity at constant volume, and is calculated by introducing the Debye temperature Θ, as described in our previous work:14
 | (15) |
The thermodynamic properties of the whole partially ionic solid bulk are attributed to the contributions of atoms in the grain boundary regions and in the grain interiors, respectively. The atomic fraction at grain boundaries, xb, is thus introduced as a function of the grain size d:
| xb = 1/{V/V0[4d3/(3h(2d − h)2) − 1] + 1} | (16) |
The fundamental thermodynamic functions of the whole partially ionic solid bulk are thus expressed as:
| H(T,d) = xbHb + (1 − xb)Hi | (17) |
| S(T,d) = xbSb + (1 − xb)Si | (18) |
| G(T,d) = xbGb + (1 − xb)Gi | (19) |
The subscript i denotes the grain interior. The thermodynamic properties of crystals in the grain interiors are considered unaffected by the grain size and can be obtained from some database, e.g. SGTE.31
As described above, because the arrangement of grain boundary atoms and hence the interatomic distance and energy state are affected by the grain size, the thermodynamic properties in the grain boundary region are dependent on the grain size in addition to the temperature. For the conventional partially ionic solids with coarse grain sizes, e.g. larger than submicron scale, the effects of grain boundaries and grain size on the thermodynamic properties are generally ignored. In contrast, in the nanocrystalline partially ionic solids with an obviously increased volume fraction of grain boundaries with the decrease of grain size on the nanoscale, both the thermodynamic characteristics and grain boundary atomic fraction are affected by the grain size. As indicated by eqn (16), when the grain size is decreased to below a critical value, there will be a sharp increase in the atomic fraction of grain boundaries. As a result, the phase destabilization or phase transformation may occur at a critical grain size in the nanocrystalline partially ionic solids.
3 Model applications in equilibrium and transformation of phases
The thermodynamics of the nanocrystalline partially ionic solid at a given composition is quantified by the model described in Section 2. Based on the principle of Gibbs free energy minimization, the phase equilibria of solid–solid, solid–liquid and solid–gas states can be calculated using the model with the nanoscale effect introduced. Theoretically, the phase transformation behavior of solid ↔ solid, solid ↔ liquid and solid ↔ gas can be predicted quantitatively, where the effect of grain size on the phase stability of nanocrystalline solid is evaluated by the model calculations.In this section, the equilibria and phase transformations of solid and liquid phases will be calculated as examples to demonstrate the model applications. The Li–Si compounds with stoichiometric compositions, as typical partially ionic solids, are used as sample materials.
3.1 Calculation of thermodynamic properties of nanocrystalline Li–Si solids
The thermodynamic properties are calculated for the nanocrystalline Li–Si solids with stoichiometric compositions, such as Li22Si5, Li13Si4, Li7Si3 and Li12Si7, which exist in the Li–Si phase diagram. The input for the model calculations include mainly the parameters at the equilibrium state, i.e. the interatomic distance r0, bulk modulus B0, cohesive energy E0, bulk thermal expansion coefficient α0 and Debye temperature Θ0. The sources and the access to obtain these parameters are described as below.The interatomic distance r0 is calculated by r0 = (3V0/4π)1/3, where V0 is the atomic volume in a perfect crystal at the equilibrium state. The bulk modulus B0 is obtained by the first principles calculation.32 The cohesive energy E0 is obtained from literature.33 The Debye temperature Θ0 is calculated by the equation Θ0 = (48π5)1/6k(ν)(ħ/kB)(r0B0/M)1/2,34 where,
From the above accesses, the input parameters of the proposed thermodynamic model for the nanocrystalline partially ionic solids can be obtained. As an example, the input to calculate the thermodynamic properties of the nanocrystalline Li22Si5 and Li13Si4 solids are listed in the Table 1.
| r0 (nm) | B0 (GPa) | E0 (10−19 J per atom) | Θ0 (K) | α0 (10−6 K−1) | |
|---|---|---|---|---|---|
| Li22Si5 | 1.538 | 34.89 | 3.7648 | 491 | 70.43 |
| Li13Si4 | 1.558 | 38.68 | 4.0896 | 694 | 62.99 |
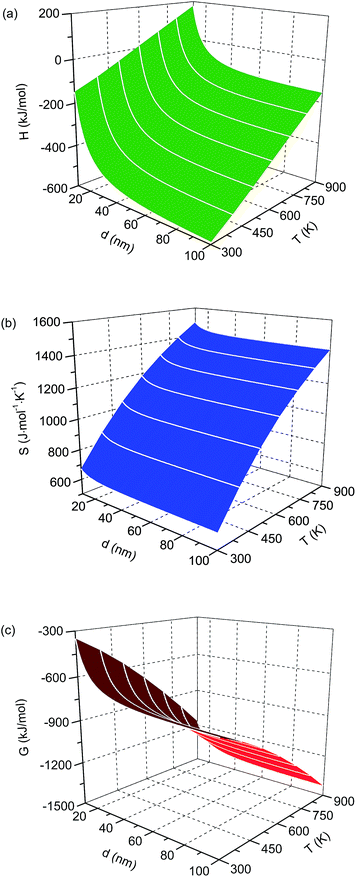
The calculated enthalpy, entropy and Gibbs free energy of the nanocrystalline Li22Si5 solid are shown in Fig. 1, as functions of temperature and grain size. The thermodynamic properties exhibit a rapid increase with the decrease of grain size when below a critical value, e.g. ∼20 nm for Li22Si5.
3.2 Prediction of peritectic reaction and solid–liquid transformation
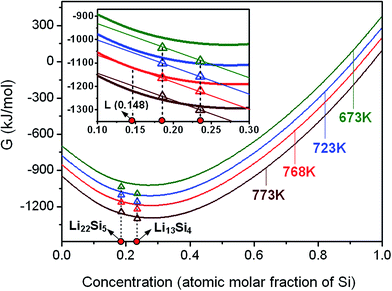
The Gibbs free energies of the nanocrystalline Li–Si solids, as a function of temperature and grain size, are used as dominant variables to evaluate the phase stabilities at equilibrium state, and also criteria for the occurrence of phase transformations.Take the nanocrystalline Li22Si5 solid as an initial material, with increasing the temperature while the liquid phase appears, the three-phase equilibrium Li22Si5 ↔ L + Li13Si4 is reached, which corresponds to the peritectic reaction balance. For the Li22Si5 solid with a certain grain size, the equilibrium of Li22Si5 solid, liquid and Li13Si4 solid, as well as the peritectic reaction temperature, is one and only, which can be obtained by the common tangent principle. The intersection between the common tangent and curve of Gibbs free energy of the liquid phase determines the liquid composition at the peritectic equilibrium. As shown in Fig. 2, the nanocrystalline Li22Si5 with a mean grain size d = 25 nm will reach peritectic equilibrium at Tp (25 nm) = 768 K, leading to the formation of Li13Si4 solid and liquid with a concentration of 0.148 at% Si. It is seen that the peritectic transformation temperature of the nanocrystalline Li22Si5 solid decreases obviously as compared with that of the conventional polycrystalline solid (Tp = 901 K).
Apply the model, the liquid concentration at peritectic equilibrium and the peritectic transformation temperature can be calculated as a function of grain size, as shown in Fig. 3. It can be seen that with grain sizes larger than 80 nm the peritectic transformation temperature is increasingly close to that of the conventional polycrystalline Li22Si5 solid. However, with decreasing the grain size, the peritectic transformation temperature decreases while the liquid concentration at the peritectic equilibrium increases. Therefore, in the nanoscale Li–Si phase diagram, the two-phase areas, i.e. “liquid + Li13Si4 solid” and “Li22Si5 solid + Li13Si4 solid”, will become smaller with the decrease in grain size.
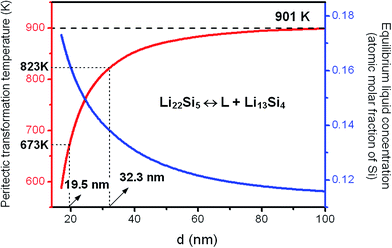 | ||
| Fig. 3 Calculated liquid concentration at peritectic equilibrium and peritectic transformation temperature as a function of grain size. | ||
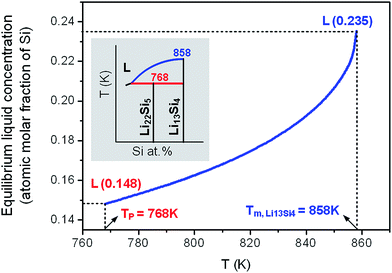
For the initial nanocrystalline Li22Si5 solid, at temperatures above the peritectic equilibrium temperature, the liquid and Li13Si4 solid will coexist instead of the Li22Si5 solid. To evaluate this phase equilibrium where the solid has a constant stoichiometric composition, the liquid concentration as a function of temperature (i.e. the liquidus) is calculated using the model, with the nanocrystalline Li22Si5 solid of a certain grain size as the starting material. As shown in Fig. 4, when the temperature is higher than the peritectic transformation temperature as TP = 768 K (d = 25 nm), the liquid concentration at the solid–liquid equilibrium Li13Si4 ↔ L increases with the temperature, till the melting point of Li13Si4 solid at Tm,Li13Si4 = 858 K (d = 25 nm). Accordingly, in the nanoscale Li–Si phase diagram, as the local area shown in the inset of Fig. 4, the liquidus moves downwards and rightwards as compared with the conventional binary diagram.
3.3 Prediction of eutectic reaction and solid–liquid transformation
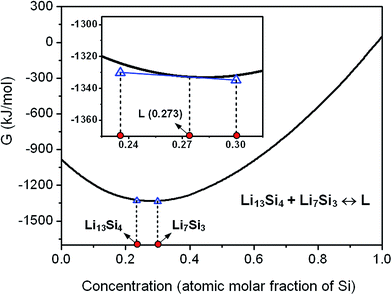
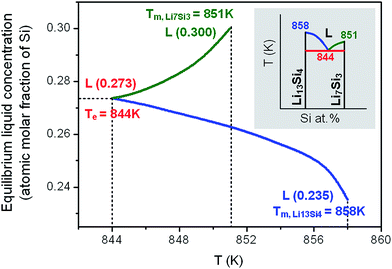
In the case that the initial solid is composed of two phases as Li13Si4 and Li7Si3, with the increase of temperature, the equilibrium Li13Si4 + Li7Si3 ↔ L will be attained and the eutectic transformation can occur. Fig. 5 shows the model prediction on the eutectic reaction based on the calculations of Gibbs free energies of Li13Si4, Li7Si3 and liquid phases. With an initial grain size d = 25 nm, the eutectic reaction temperature is predicted as Te = 844 K, and the liquid concentration at the eutectic equilibrium is calculated as 0.273 at% Si. As compared with the eutectic transformation temperature of the conventional polycrystalline solid (Te = 982 K), the eutectic reaction temperature decreases greatly in the nanocrystalline material.When the temperature is higher than the eutectic transformation temperature, the two phases of “liquid + Li13Si4 solid” or “liquid + Li7Si3 solid” may form, depending on the composition of the initial solid. The liquid concentration at the solid–liquid equilibrium is calculated for the initial solid with a given grain size (d = 25 nm), as shown in Fig. 6. In contrast to the equilibrium Li13Si4 ↔ L resulting from the peritectic reaction (see Fig. 4, where the liquid concentration increases with the temperature), the liquid concentration at the equilibrium Li13Si4 ↔ L which is generated from the eutectic reaction decreases with the temperature, till the melting point of Li13Si4 at Tm,Li13Si4 = 858 K. For the equilibrium Li7Si3 ↔ L, the liquid concentration increases with the temperature till the melting point of Li7Si3 at Tm,Li7Si3 = 851 K. From the calculation results, it is clear that in the nanoscale Li–Si system, for the phase equilibria related to the eutectic reaction Li13Si4 + Li7Si3 ↔ L, as the local phase diagram shown in the inset of Fig. 6, the liquid area expands and the two-phase areas (liquid–solid and solid–solid) shrink, as compared with the conventional binary phase diagram.
As demonstrated by the above examples of model applications, in principle any phase equilibrium or phase transformation that contains nanocrystalline partially ionic solid can be evaluated by the model. For an anode system in the Li ion battery such as Li–Si, based on the calculated results of the three-phase (peritectic and eutectic reactions) and two-phase (solid and liquid) equilibria, the phase diagram on the nanoscale can be developed. Thus the characteristics of phase transformation temperature and equilibrium liquid concentration can be obtained for any nanoscale Li–Si anode systems. However, it should be noted that the transformation from amorphous to crystalline, which may occur in Li–Si alloys under electrochemical condition, is not taken into account in the model. Therefore, the present model describes the thermodynamic phase stability rather than the electrochemical behavior.
4 Experimental verification of the model
To verify the model predictions, a series of experiments were performed using the nanocrystalline Li22Si5 bulk material as an example of the anode system. Firstly, a dense nano-grained Li22Si5 bulk sample was prepared as the starting material. Lithium slices and silicon powder both with 99.99% purity were used as raw materials, with a 2.0 wt% excess of lithium to compensate for the loss due to its high chemical activity. The raw materials were mixed and compressed in a die made of tungsten carbide. The die was put in a spark plasma sintering (SPS) system with the vacuum degree higher than 10−3 Pa, in which an alloy ingot with a single phase Li22Si5 was prepared. Then in the glove box the ingot was crushed into powder and milled with a ball-to-powder weight ratio of 60![[thin space (1/6-em)]](https://www.rsc.org/images/entities/char_2009.gif) :
:![[thin space (1/6-em)]](https://www.rsc.org/images/entities/char_2009.gif) 1 at a constant rotation rate of 500 rpm for 16 h. From this procedure, the fine amorphous powder was obtained, and was immediately fed in the die and put in the SPS system to be densified. To obtain the nanocrystalline Li22Si5 bulk material from the amorphous powder by the concurrent crystallization and densification processes, the sintering parameters were optimized as an external pressure of 300 MPa, a final sintering temperature of 200 °C, a heating rate of 50 °C min−1 and no isothermal holding before rapid cooling to the room temperature.
1 at a constant rotation rate of 500 rpm for 16 h. From this procedure, the fine amorphous powder was obtained, and was immediately fed in the die and put in the SPS system to be densified. To obtain the nanocrystalline Li22Si5 bulk material from the amorphous powder by the concurrent crystallization and densification processes, the sintering parameters were optimized as an external pressure of 300 MPa, a final sintering temperature of 200 °C, a heating rate of 50 °C min−1 and no isothermal holding before rapid cooling to the room temperature.
The as-prepared nanocrystalline Li22Si5 bulk material was measured to have a nearly full relative density (99.9%). The annealed counterparts were used as samples to examine the phase equilibria and phase transformation behavior.
4.1 Experimental results of thermodynamic properties and comparison with model calculations
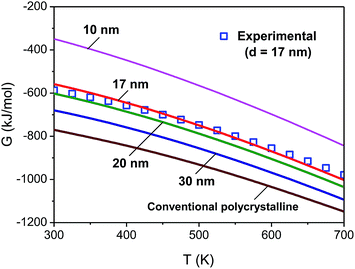
The phase constitution and mean grain size of the as-prepared nanocrystalline Li22Si5 bulk sample were detected by the X-ray diffraction (XRD). It is found that the Li22Si5 with a cubic crystal structure is clearly the dominant phase, with a little lithium oxide present. The mean grain size is estimated as about 17 nm using the modified Scherrer formula.38The measured specific heat capacity at constant pressure of the as-prepared nanocrystalline Li22Si5 solid is shown in Fig. 7, and compared with that of the conventional polycrystalline counterpart. The specific heat capacity is used to obtain the enthalpy, entropy and Gibbs free energy based on the known thermodynamic equations.39 The Gibbs free energy as a function of temperature obtained from the experimental result (for the sample with mean grain size of 17 nm) is compared with the model calculations at different grain sizes, as shown in Fig. 8. It is seen that the calculated Gibbs free energy is consistent with the function obtained from experimental result, and its changing tendency with the grain size is reasonable.
4.2 Experimental results of phase transformation and comparison with model predictions
The as-prepared nanocrystalline Li22Si5 bulk sample was divided into several parts, which were annealed separately at different temperatures in a vacuum furnace. The phase constitutions of the annealed samples were examined by XRD, and were used to reflect the phase transformation behavior in experiments. The change of phase constitution with the annealing temperature is shown in Fig. 9. It is observed that the sample annealed at 573 K has the same phase constitution as that in the as-prepared nanocrystalline Li22Si5 solid (marked as 298 K), i.e. no phase transformation occurs. The mean grain size of the 573 K-annealed sample is estimated as 19.6 nm by the modified Scherrer formula based on its XRD pattern. The representative grain size distribution is in a range of 18.1–24.9 nm, which is obtained from the typical diffraction peaks of the matrix phase in the XRD pattern (Fig. 9). As predicted by the model calculations, to have the peritectic transformation at 573 K, the critical grain size is 16.6 nm (Fig. 3). Therefore, the 573 K-annealing experiment confirms the model prediction that the phase transformation does not take place when the grain size is larger than the critical value.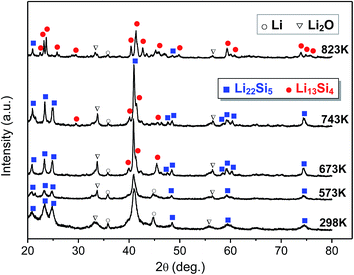 | ||
| Fig. 9 Experimental results of change in phase constitution with the annealing temperature, with the as-prepared nanocrystalline Li22Si5 sample as the starting material. | ||
In the 673 K-annealed sample, as shown in Fig. 9, with the Li22Si5 as the dominant phase, the Li13Si4 phase with a monoclinic crystal structure appears in a small amount, which indicates the occurrence of the peritectic transformation. In this sample, the mean grain size of Li22Si5 phase is about 24.4 nm, and the representative grain size distribution is 18.8–30.0 nm. As calculated by the model, the critical grain size for the peritectic transformation at 673 K is 19.5 nm (Fig. 3). It implies that grains larger than 19.5 nm will keep the Li22Si5 phase, while the peritectic transformation takes place preferentially in those grains smaller than the critical value. Consequently, the Li22Si5 and Li13Si4 phases coexist in the sample and the former predominates, as found in the experiment. The 743 K-annealed sample has a similar phase constitution as the sample annealed at 673 K, but the amount of Li13Si4 phase increases (Fig. 9).
For the sample annealed at 823 K, the Li13Si4 becomes the dominant phase with a small amount of Li22Si5 phase coexisting (Fig. 9). The mean grain size of Li13Si4 phase is about 31.2 nm, and the representative grain size distribution is 22.1–35.1 nm. The critical grain size for the peritectic transformation at 823 K is predicted as 32.3 nm by the model (Fig. 3). Since the mean grain size is smaller than the critical value, moreover, as observed from the grain size distribution, most grains are smaller than the critical size, thus instead of Li22Si5 the Li13Si4 phase predominates in the 823 K-annealed sample as product of the peritectic transformation. Therefore, the experimental result proves the model calculation on the grain-size-dependence of the phase transformation.
As a summary of the above analyses on the phase transformation and the effects of temperature and grain size, the change of phase constitution with the mean grain size and its correlation with the critical grain size (calculated by the model) are shown in Fig. 10. It can be seen clearly that in the nanocrystalline Li22Si5 solid, the peritectic transformation can occur at temperatures much lower (e.g. 673 K) than that in the conventional polycrystalline material (901 K). In the heating process, at a certain temperature the peritectic transformation Li22Si5 → L + Li13Si4 may occur firstly in the grains that are smaller than the critical size that corresponds to the minimum of the Gibbs free energy in the multiphase system. With the increase of temperature, both the mean grain size and the critical grain size increase, moreover, the absolute grain size distribution becomes broader. In the case that most of the grain sizes are smaller than the critical value, even at the relatively lower temperature, the peritectic transformation can be accomplished, leading to the formation of Li13Si4 as the dominant phase in the anode system.
5 Summary and conclusions
The nanoscale phase stability in the anode system is crucial to the functional properties and operational reliability of the Li ion battery. In the present paper, we concentrate our attention on quantitative description of the phase stability and phase transformation mechanism in the nanocrystalline Li ion battery anode materials. The following conclusions are obtained from modeling and experimental studies.Introduce both the ionic and covalent contributions to the cohesive energy of atoms and grain size effect on the structure and energy state of interface, a model was developed to describe systematic thermodynamic properties and hence the multiphase equilibrium and phase stability of nanocrystalline partially ionic solids. Applied to Li–Si compounds, the model calculations appealed that with the decrease of grain size on the nanoscale, both the peritectic and eutectic reaction temperatures decrease, while the liquid concentration at equilibrium may increase or decrease depending on the initial composition. The changes in transformation temperature and equilibrium concentration result in expansion of liquid area and shrinkage of liquid–solid and solid–solid areas in the nanoscale phase diagram. Experimental results with the nanograined Li22Si5 bulk sample as the starting material confirmed the model predictions on the phase transformation characteristics of the nanocrystalline partially ionic solids, and supported the effect of grain size on the phase stability in the nanoscale anode system. It was proposed that the equilibrium, stability and transformation of phases in the nanocrystalline Li alloy system are determined by the correlation of temperature, grain size and critical grain size. When the grain size is smaller than the critical value, phase transformations may occur at clearly lower temperatures as compared to those in the conventional polycrystalline anode materials.
Acknowledgements
This work was supported by the National Natural Science Foundation of China (51174009, 51371012), German Research Foundation (DFG, SO 1075/1-2) and the Beijing “Great Wall Scholars” program (CIT&TCD20130314).References
- T. Waitz and H. P. Karnthaler, Acta Mater., 2004, 52, 5461 CrossRef CAS PubMed.
- B. Efros, V. Pilyugin, A. Patselov, S. Gladkovskii, N. Efros, L. Loladze and V. Varyukhin, Mater. Sci. Eng., A, 2009, 503, 114 CrossRef PubMed.
- N. Forouzanmehr, F. Karimzadeh and M. H. Enayati, J. Alloys Compd., 2009, 471, 93 CrossRef CAS PubMed.
- Z. X. Zhang, X. Y. Song and W. W. Xu, Acta Mater., 2011, 59, 1808 CrossRef CAS PubMed.
- P. C. Kang and Z. D. Yin, Nanotechnology, 2004, 15, 851 CrossRef CAS.
- M. Grunwald and C. Dellago, Nano Lett., 2009, 9, 2099 CrossRef PubMed.
- J. T. He, X. Y. Song, W. W. Xu, Y. Y. Zhou, M. Seyring and M. Rettenmayr, Mater. Lett., 2013, 94, 176 CrossRef CAS PubMed.
- K. Thornton, J. Agren and P. W. Voorhees, Acta Mater., 2003, 51, 5675 CrossRef CAS PubMed.
- Q. Jiang, H. X. Shi and M. Zhao, Acta Mater., 1999, 47, 2109 CrossRef CAS.
- Q. Jiang, Z. Zhang and J. C. Li, Acta Mater., 2000, 48, 4791 CrossRef CAS.
- Q. Jiang, D. S. Zhao and M. Zhao, Acta Mater., 2001, 49, 3143 CrossRef CAS.
- T. L. Hill, Nano Lett., 2001, 1, 111 CrossRef CAS.
- R. Kirchheim, Acta Mater., 2002, 50, 413 CrossRef CAS.
- X. Y. Song, J. X. Zhang, L. M. Li, K. Y. Yang and G. Q. Liu, Acta Mater., 2006, 54, 5541 CrossRef CAS PubMed.
- Z. Chen, F. Liu, H. F. Wang, W. Yang, G. C. Yang and Y. H. Zhou, Acta Mater., 2009, 57, 1466 CrossRef CAS PubMed.
- Y. Zheng and C. H. Woo, Appl. Phys. A, 2009, 97, 617 CrossRef CAS.
- W. W. Xu, X. Y. Song, N. D. Lu and C. Huang, Acta Mater., 2010, 58, 396 CrossRef CAS PubMed.
- D. Amram, L. Klinger and E. Rabkin, Acta Mater., 2013, 61, 5130 CrossRef CAS PubMed.
- H. Schlosser, J. Ferrante and J. R. Smith, Phys. Rev. B: Condens. Matter Mater. Phys., 1991, 44, 9696 CrossRef CAS.
- Y. Imai, Y. Mori, S. Nakamura and K. I. Takarabe, J. Alloys Compd., 2013, 558, 179 CrossRef CAS PubMed.
- H. Miyaoka, W. Ishida, T. Ichikawa and Y. Kojima, J. Alloys Compd., 2011, 509, 719 CrossRef CAS PubMed.
- L. Ji, Z. Lin, M. Alcoutlabi and X. Zhang, Energy Environ. Sci., 2011, 4, 2682 CAS.
- S. M. Mukhopadhyay, Nanoscale Multifunctional Materials: Science & Applications, John Wiley & Sons, Hoboken, 2011 Search PubMed.
- M. Wagemaker, F. M. Mulder and A. Van der Ven, Adv. Mater., 2009, 21, 2703 CrossRef CAS.
- A. Shukla and T. Kumar, Curr. Sci., 2008, 94, 314 CAS.
- H. J. Fecht, Phys. Rev. Lett., 1990, 65, 610 CrossRef CAS.
- M. Wagner, Phys. Rev. B: Condens. Matter Mater. Phys., 1992, 45, 635 CrossRef.
- H. Schlosser and J. Ferrante, Phys. Rev. B: Condens. Matter Mater. Phys., 1993, 48, 6646 CrossRef CAS.
- P. Vinet, J. R. Smith, J. Ferrante and J. H. Rose, Phys. Rev. B: Condens. Matter Mater. Phys., 1987, 35, 1945 CrossRef CAS.
- H. Schlosser and J. Ferrante, Phys. Rev. B: Condens. Matter Mater. Phys., 1993, 47, 1073 CrossRef CAS.
- A. T. Dinsdale, Calphad, 1991, 15, 317 CrossRef CAS.
- V. L. Chevrier, J. W. Zwanziger and J. R. Dahn, Can. J. Phys., 2009, 87, 625 CrossRef CAS.
- Z. W. Cui, F. Gao, Z. H. Cui and J. M. Qu, J. Power Sources, 2012, 207, 150 CrossRef CAS PubMed.
- X. M. Tao, Y. F. Ouyang, H. S. Liu, F. J. Zeng, Y. P. Feng and Z. P. Jin, Phys. B, 2007, 399, 27 CrossRef CAS PubMed.
- J. Moon, K. Cho and M. Cho, Int. J. Precis. Eng. Manuf., 2012, 13, 1191 CrossRef PubMed.
- A. R. Ruffa, J. Mater. Sci., 1980, 15, 2258 CrossRef CAS.
- A. R. Ruffa, J. Mater. Sci., 1980, 15, 2268 CrossRef CAS.
- A. W. Burton, K. Ong, T. Rea and I. Y. Chan, Microporous Mesoporous Mater., 2009, 117, 75 CrossRef CAS PubMed.
- R. T. Dehoff, Thermodynamics in Materials Science, Taylor & Francis, Boca Ratom, 2nd edn, 2006 Search PubMed.
| This journal is © The Royal Society of Chemistry 2014 |


