DOI:
10.1039/C4RA09940K
(Paper)
RSC Adv., 2014,
4, 63875-63881
Tungstate adsorption onto oxisols in the vicinity of the world's largest and longest-operating tungsten mine in China
Received
6th September 2014
, Accepted 19th November 2014
First published on 20th November 2014
Abstract
Tungstate adsorption in soils is critical to understand tungstate mobility and bioavailability, but study of this is lacking. The objectives of this study are to investigate the kinetics and isotherms of tungstate adsorption onto oxisol samples in the vicinity of the world's largest and longest-operating tungsten mine in China. In addition, the effects of pH, ionic strength, and phosphate anion on tungstate adsorption onto the soil were studied. Results show that the tungstate adsorption kinetics is fitted best by a pseudo-second order model. Micropore (intraparticle) diffusion and ultramicropore (within clays) diffusion are generally the adsorption-limiting mechanisms. Tungstate adsorption isotherms are fitted well by both Langmuir and Freundlich models. The maximal adsorption capacity of the oxisol sample is 10.67 mmol kg−1, while the distribution coefficient is 12.60 (mmol kg−1) (mol L−1)−1/n. Tungstate adsorption decreased from 96.1% to 90.2% with the pH increase from 4.93 to 5.23, while it increased from 90.1% to 95.5% with the increase of ionic strength from 0.01 M to 0.1 M NaCl. With the increase of phosphate concentration from 0.008 mM to 0.215 mM, tungstate adsorption slightly decreased from 2.32 mmol kg−1 to 1.97 mmol kg−1. These results demonstrate that tungstate might be adsorbed onto the tungstate-specific adsorption sites of the soil minerals mainly via inner-sphere complexation. Despite the soil containing a high tungsten content (e.g. 21.9 mg kg−1), it still has a high tungstate adsorption capacity.
1. Introduction
Tungsten (W) is a transition metal and has become a matter of increasing concern due to the scrutiny of a cluster of childhood leukemia cases in Nevada, its toxicity to organisms, and ubiquitous presence of this element in the environment as a result of geogenic and anthropogenic processes.1–6 Anthropogenic activities that may lead to W release include W mining and smelting, military combat/training operations using W-containing hardware, agrochemical practices such as the application of W-containing fertilizers, and non-sustainable disposal of W-containing substances (e.g. disposal of light bulbs in landfills and land application of wastewater residuals).3 In general, W exists as the tungstate anion and is thermodynamically stable in the environment.3,7,8
Whereas the geochemical behaviors of tungstate in environments are probably dependent, to a large extent, on its adsorption/desorption to/from colloidal particle surfaces, only a few studies have investigated tungstate adsorption/desorption. In addition, these studies mainly focused on metal oxides and silicate clay minerals.7,9–14 Gustafsson investigated tungstate adsorption to ferrihydrite, showing that tungstate adsorption was strongly pH dependent and could be described with use of two monodentate complex. Tungstate adsorption on goethite has a broad adsorption envelop across a wide pH range with maximal adsorption below pH 5.1, more than 50% of tungstate adsorption at neutral pH, and only 10% above pH 10.12 In addition, tungstate adsorption on goethite is irreversible and the maximal adsorption capacity to goethite was estimated to be 225.7 μmol g−1 by Langmuir model.10 Vissenberg et al.11 studied tungstate adsorption on γ-Al2O3, TiO2, and amorphous silica alumina, demonstrating that most of the tungstate reacts irreversibly with acidic and neutral OH groups and the other part adsorbs reversibly by electrostatic interactions with protonated OH groups. Tungstate adsorption to peat and silicate clays were also investigated.9,13,15 The extent of the tungstate uptake is in the following order: peat > kaolinite > montmorillonite > illite.9 The high uptake by peat may be related to the formation of complexs of tungstate with humic substances. The maximal tungstate adsorption capacity of 8.28 μmol g−1 for kaolinite is much lower than that for goethite (225.7 μmol g−1).9,10 One study investigated the retention of tungstate by three Finnish soils, showing the highest retention from the most acidic samples.16 In addition, retention of tungstate by these soils was strong and only small amount of the retained tungstate was desorbed.
China is the world's largest W producer and consumer.17 Ganzhou in the south of Jiangxi province, being the birth place of Chinese W industry, is extremely rich in W source. So Ganzhou is called as “Tungsten capital of the world”. There are three major tungsten mines: Xihuashan, Dangping, and Piaotang, among which Xihuashan is the first tungsten mine operated in China. The soil around tungsten mines has been contaminated by tungsten.17 The tungstate mining and smelting there may still release tungstate to soils via atmospheric deposition, runoff, and irrigation with river water in the future. Therefore, it is critical to understand tungstate adsorption/desorption to/from the tungsten-contaminated soil in Ganzhou and quantify the maximal tungstate adsorption capacity. In addition, the knowledge on tungstate adsorption/desorption to/from soils is lacking and thus would be interesting to worldwide scientists.
The objectives of this study are: (1) to investigate the kinetic of tungstate adsorption to the soil of Ganzhou; (2) to identify tungstate adsorption isotherms; and (3) to investigate the influences of pH, ionic strength, and competitive anion (PO43−) on the tungstate adsorption.
2. Materials and methods
2.1. Soil sampling and analysis
Topsoil (about 0 to 20 cm depth) was sampled at 15 sites in the agricultural fields adjacent to W mines in Ganzhou, the southern Jiangxi province of southern China. The soil samples were air-dried in lab, crushed, and passed through 2 mm. Afterwards, portions of these individual samples were mixed together to composite one sample to represent the whole area soil. The climate of Ganzhou is characterized by subtropical monsoon, with average annual precipitation and temperature of 1591.5 mm and 18.5 °C, respectively.
The pH value of each individual soil sample and the composite soil sample was analyzed in a 1
:
10 solid/liquid ratio suspension (left for ∼0.5 h) using a combination pH electrode. The organic matter (OM) concentration was measured and estimated by weight loss on ignition (LOI) to 400 °C.18 The grain size was determined by a LS 230 laser diffraction particle analyser (Beckman Coulter). Specific surface area was measured by the Model QS-7 Quantasorb surface area analyzer (Quantachrom Co., Greenvale, NY).
Portions of each individual soil sample and the composite sample were digested with HNO3–HF–HClO4.19 The Al and Fe in the extracts were measured using ICP-AES (IRIS Intrepid II, Thermo Electron), while W was measured with ICP MS (X Series II, Thermo Electron). Together with digestion and measurement of our soil samples, four reference soils (GSS13, GSS15, GSS17, and GSS25), provided by Institute of Geophysical and Geochemical Exploration, Chinese Academy of Geological Sciences, were digested and analyzed to check the analytical quality. Relative errors were −0.4–3.4% for W, −6.3–4.2% for Al, and −1.5–1.5% for Fe.
2.2. Adsorption experiments
The sorption of tungstate by the composite soil sample was measured in an aqueous matrix consisting of NaCl solution. Accurately weighed samples (∼1 g soil each) were mixed with 25 mL of matrix solution with varying tungstate concentrations (Na2WO4·2H2O). The pH value of the suspensions was adjusted by adding negligible volumes of 0.1 or 0.01 M HCl or NaOH. Competitive anion was added as NaH2PO4·2H2O. The suspensions were gently shaken for several days at 25 ± 2 °C. Then the suspensions were centrifuged at 8000 rpm for 20 min using Xiang Yi centrifuge (H-1650, China). The supernatant was decanted and filtered through 0.45 μm filter. Tungsten in the solution was measured employing the ICP-AES (SPECTRO ARCOS EOP, SPECTRO Analytical Instruments GmbH) or ICP-MS (NexION300x, PerkinElmer Instruments Co. Ltd). Table 1 lists the detailed experimental parameters. Standard deviation of replica was generally less than 5%.
Table 1 Experimental parameters of tungstate adsorption onto the composite soil sample
Experiment |
Initial pH |
Ionic strength |
Initial W concentration |
Equilibrating time |
Kinetic |
5.0 |
0.1 N NaCl |
0.04 mM |
0.25 to 168 h |
Isotherm |
5.0 |
0.1 N NaCl |
0.4 μM to 1.21 mM |
168 h |
pH influence |
5.0, 7.0, 9.0 |
0.1 N NaCl |
0.04 mM |
168 h |
Ionic strength influence |
5.0 |
0.01, 0.05, 0.1 N NaCl |
0.04 mM |
168 h |
Competitive anion influence |
5.0 |
0.1 N NaCl |
0.04 mM |
168 h |
Adsorption percentage (%) was derived from the difference of the initial concentration (C0, mM) and the final one (Ce, mM):
|
 | (1) |
where
C0 (mM) is the initial tungstate concentration,
Ce (mM) is the equilibrium tungstate concentration.
To further understand the tungstate adsorption characteristics, the first-order rate equation,24 the pseudo-second-order rate equation,25 and double-constant rate equation26 were evaluated based on the experimental data as shown below by eqn (2)–(4):
|
ln(qe − qt) = ln qe − k1t
| (2) |
where
qe is the adsorption amount at equilibrium (mmol kg
−1);
qt is the adsorption amount at time
t (mmol kg
−1);
k1 (h
−1) is the rate constant of pseudo-first-order equation, and
t is the equilibrium time (h).
|
 | (3) |
where
k2 (kg mmol
−1 h
−1) is the rate constant of pseudo-second order equation.
where Δ
a,
b is the kinetic constant of double-constant rate equation.
The Langmuir model and Freundlich model have been widely used to model equilibrium adsorption data.33–37 The Langmuir adsorption equation can be expressed as
|
 | (5) |
where
Ce is the equilibrium concentration of tungstate in solution,
qe is the tungstate adsorption amount,
Qmax is maximal adsorption capacity, and
KL (L mmol
−1) is a constant related to the binding energy.
The Freundlich equation is an empirical adsorption model.38 It can be presented as.
where
KF ((mmol kg
−1) (mmol L
−1)
−1/n) is the distribution coefficient.
3. Results and discussion
3.1. General properties of soil
Table 2 summarizes general physiochemical properties of soil samples collected in the agricultural fields near the W mines. Soil pH value ranged from 4.92 to 5.90, showing its acidic property. The organic matter (OM) content varied between 1.19 and 7.58%. The soil in the area is generally classified as ferrosols in Chinese taxonomy (oxisols). The secondary minerals in the oxisols mainly included kaolinite, vermiculite, hydromica, and hematite.20 The soil texture is generally classified as clayey loam, with 10–35%, 10–45%, 30–80% of clay (<1 μm), silt (1 μm to 10 μm), and sand (>10 μm), respectively.20 The specific surface area ranged from 4.25 to 13.47 m2 g−1. The mineral matrix element Al and Fe contents in the soil samples ranged from 4.15 to 8.02% and 1.51–3.54%, respectively. Tungsten content in the soil samples ranged from 3.18 to 102.65 mg kg−1, higher than its background contents in the soils of the Jiangxi province, China, and world.21,22 The composite soil sample contained 21.92 mg kg−1 W, 6.05% Al, 3.22% Fe, and 3.76% SOM, with 5.45 pH and 7.92 m2 g−1 SSA.
Table 2 General physiochemical properties and W contents of the soil samplesa
Sample no. |
W μg g−1 |
Al% |
Fe% |
OM% |
pH |
SSA m2 g−1 |
OM: soil organic matter; SSA: specific surface area. |
1 |
4.39 |
6.16 |
2.19 |
5.18 |
5.53 |
7.56 |
2 |
3.18 |
4.98 |
1.74 |
5.77 |
4.92 |
6.66 |
3 |
5.29 |
8.02 |
2.56 |
6.46 |
5.16 |
9.10 |
4 |
4.61 |
5.13 |
3.12 |
6.19 |
5.04 |
12.71 |
5 |
5.64 |
6.78 |
2.14 |
7.58 |
4.98 |
6.23 |
6 |
16.28 |
7.37 |
3.48 |
7.06 |
5.90 |
13.47 |
7 |
4.41 |
6.20 |
3.54 |
4.35 |
5.58 |
10.22 |
8 |
102.65 |
7.77 |
2.24 |
6.19 |
5.38 |
9.82 |
9 |
88.06 |
5.55 |
1.90 |
4.54 |
5.22 |
6.87 |
10 |
72.83 |
6.09 |
1.79 |
4.66 |
5.13 |
5.68 |
11 |
4.75 |
6.64 |
1.84 |
1.19 |
5.44 |
5.59 |
12 |
12.39 |
7.50 |
2.65 |
6.98 |
5.11 |
10.01 |
13 |
3.98 |
6.29 |
1.85 |
5.00 |
5.34 |
7.40 |
14 |
5.37 |
4.15 |
1.79 |
3.16 |
5.17 |
9.59 |
15 |
22.37 |
4.66 |
1.51 |
2.87 |
5.45 |
4.25 |
Median |
5.37 |
6.20 |
2.14 |
5.18 |
5.22 |
7.56 |
Maximal |
102.65 |
8.02 |
3.54 |
7.58 |
5.90 |
13.47 |
Minimal |
3.18 |
4.15 |
1.51 |
1.19 |
4.92 |
4.25 |
Composite |
21.92 |
6.05 |
2.25 |
3.76 |
5.45 |
7.92 |
Jiangxi |
5.28 |
8.60 |
2.88 |
|
|
|
China |
2.48 |
6.62 |
2.94 |
|
|
|
World |
1.50 |
7.10 |
4.00 |
|
|
|
3.2. Kinetics of tungstate adsorption
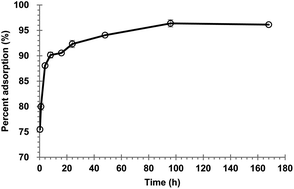
Adsorption kinetic is one of the most important characters which controls the solute uptake rate and represents the adsorption efficiency of the adsorbent. The adsorption kinetic of tungstate onto the composite soil sample at pH 5.0 is shown in Fig. 1.
 |
| Fig. 1 Adsorption kinetic of tungstate onto the composite sample. Experimental parameters are listed in Table 1. | |
The results show that the tungstate adsorption was fast in the initial 24 h and afterwards gradually reached apparent equilibrium within 168 h. The initial fast adsorption might be due to tungstate adsorption on high affinity sites of adsorbents in the soil, while slow adsorption afterwards might be due to tungstate adsorption on the low affinity sites.23 According to the adsorption kinetic in Fig. 1, equilibrium time for the following experiments was fixed at 168 h.
The linear regressions of adsorption kinetics are shown in Fig. 2a–c and fitted parameters are listed in Table 3. The tungstate adsorption kinetics can be fitted with all three models, but the pseudo-second-order was the best. The qe value obtained from the pseudo-second-order equation is more accurate (SE < 1%) than that from the pseudo-first-order rate equation, and the calculated correlation coefficient obtained from the pseudo-second-order equation is high (R2 = 0.99).
 |
| Fig. 2 Kinetic simulation of tungstate adsorption onto the composite soil sample: (a) pseudo-first order model, (b) pseudo-second order model, and (c) double-constant rate model. Experimental parameters are shown in Table 1. | |
Table 3 Parameters of adsorption kinetic models (tungstate concentration of 0.04 mM, pH = 5.0)a
Model |
qe,exp (mmol kg−1) |
k |
qe (mmol kg−1) |
a |
b |
R2 |
SE% |
qe,exp: measured adsorption capacity after contacting 168 h, qe: estimated adsorption amount at equilibrium by the model, SE% = (qe − qe,exp)/qe × 100. |
Pseudo-first-order equation |
0.97 |
1.98 |
0.13 |
— |
— |
0.96 |
646.15 |
Pseudo-second-order equation |
0.97 |
1.05 |
0.96 |
— |
— |
0.99 |
1.04 |
Double-constant rate equation |
0.97 |
— |
— |
0.04 |
0.21 |
0.94 |
— |
Generally, anions adsorption is often described as following mechanisms: external mass transfer (namely fluid film diffusion), intraparticle transport within the adsorbent, and chemiadsorption.27–29 The intraparticle diffusion mechanism is one of the most limiting factors which controls the adsorption kinetics.30 Thus, the intraparticle diffusion model was utilized to determine the rate limiting step of the adsorption process:31,32
where
k3 (mmol kg
−1 h
−1/2) is the intraparticle diffusion rate constant.
According to this model, the relationship qt versus t1/2 is shown in Fig. 3. Two stages can be identified: (a) the first part may be due to the micropore (within ped) diffusion or intraparticle diffusion; (b) the second stage may be attributed to the ultramicropore (within clays) diffusion.
 |
| Fig. 3 Intraparticle diffusion model for the tungstate adsorption. | |
3.3. Tungstate adsorption isotherm
The tungstate isotherm data were fitted with the linearized Langmuir equation and Freundlich equation (Fig. 4). The calculated isotherm parameters from the models are listed in Table 4. Correlation coefficients (R2) were 0.99 and 0.94 for the Langmuir model and Freundlich model, respectively. The maximum adsorption capacity calculated from the Langmuir equation is 10.09 mmol kg−1, while distribution coefficient is 12.6 (mmol kg−1) (mmol L−1)−1/n or 308.0 (mg kg−1) (mg L−1)−1/n. Tuna et al.9 investigated the tungsten adsorption from tungsten canister round munitions onto montmorillonite, kaolinite, Pahokee peat, and illite. They found that tungsten adsorption onto kaolinite was fitted best by the Langmuir model, while tungsten adsorption onto montmorillonite, peat, and illite was fitted best by the Freundlich model. The maximal tungsten adsorption capacity was 6.14 mmol kg−1 for kaolinite, while distribution coefficients were 856, 27.4, and 22.9 (mg kg−1) (mg L−1)−1/n for peat, montmorillonite, and illite, respectively.39 Tungstate adsorption onto goethite was fitted well by both the Langmuir model and the Freundlich model, with the maximal adsorption capacity of 225.7 mmol kg−1 and the distribution coefficient of 159.1 (mmol kg−1) (mmol L−1)−1/n. Therefore, the maximal tungstate adsorption capacity onto the composite soil sample is similar to that for kaolinite, but much lower than that for pure goethite.
 |
| Fig. 4 Langmuir (a) and Freundlich (b) isotherms of tungstate adsorption onto the composite soil sample. | |
Table 4 Parameters of Langmuir and Freundlich modelsa
Model |
KL (L mmol−1) |
Qmax (mmol kg−1) |
KF mmol1−1/n kg−1 L1/n |
1/n |
R2 |
KL: Langmuir constant related to the binding energy; Qmax: the maximal adsorption capacity of Langmuir model; KF: Freundlich distribution coefficient; n: Freundlich correct factor. |
Langmuir |
0.035 |
10.67 |
— |
— |
0.99 |
Freundlich |
— |
— |
12.60 |
0.28 |
0.94 |
3.4. Influence of pH on tungstate adsorption
Anion adsorption varies with pH, usually increasing with pH and reaching a maximum close to the pKa for anions of monoprotic conjugate acids, and slope breaks have been observed at pKa values for anions of polyprotic conjugate acids.40,41 The initial pH values of the suspensions for three treatments were adjusted to 5.0, 7.0, and 9.0. After equilibration of 7 days, the final pH values for the three treatments decreased to 4.93, 5.06, and 5.23, respectively, due to the strong buffering of the soil. Tungstate adsorption decreased from 96.1% to 90.2% with the pH increase from 4.93 to 5.23 (Fig. 5). Xu et al.12 observed that tungstate has a broad adsorption envelope onto goethite across a wide pH range, with the maximum adsorption below pH 5.1, more than 50% of WO42− adsorption at neutral pH, and only 10% above pH 10 on the goethite surface. Tuna et al.13 found that adsorption of tungstate on montmorillonite reaches a maximum at pH 3.5 and become negligible (<5%) at pH 9.0. The effect of pH on the tungstate adsorption onto the composite soil is consistent with the tungstate adsorption onto the soil minerals and three Finnish mineral soils (e.g., gothite, ferrihydrite, γ-Al2O3, montmorillonite, kaolinite etc.).7,11,12,14,15 The decline trend of adsorption of tungstate may be explained by the increase of negative surface charge of the soil minerals with increasing pH.
 |
| Fig. 5 The influence of solution pH on the tungstate adsorption onto the composite soil. | |
3.5. Influence of ionic strength on tungstate adsorption
Tungstate adsorption onto the composite soil increased from 90.1% to 95.5% with the increase of ionic strength from 0.01 M to 0.1 M (Fig. 6). The effect of ionic strength on adsorption was used to distinguish the inner-sphere surface complexation from the outer-sphere one in adsorption, and hence, to give some useful information about the adsorption mechanism.42–45 In general, the increase of ionic strength can decrease the outer-sphere complex duo to ionic competition, but might not have influence on the inner-sphere complex. Therefore, the increase of ionic strength might usually decrease the overall adsorption. However, McBride43 indicated that higher ionic strength might lead to the transform of adsorbate from outer-sphere complex to inner-sphere complex and hence might increase overall adsorption. The similar adsorption trend was reported for borate and arsenate.46–49 Thus, the increase of ionic strength might lead to the formation of the more tungstate inner-sphere complex onto the soil colloids and thus increased the overall tungstate adsorption onto them.
 |
| Fig. 6 The influence of solution ionic strength on the tungstate adsorption onto the composite soil. | |
3.6. Influence of competitive anions on tungstate adsorption
The mobility, bioavailability, and toxicity of tungstate in environments may also be greatly affected by the presence of competitive anions. Anions such as PO43− can compete with tungstate for adsorption sites.3,10,50 In order to confirm competitive adsorption interactions between tungstate (WO42−) and phosphate (PO43−), batch experiments were designed in which initial tungstate concentration was 0.1 mM, while initial phosphate concentration ranged from 0.01 to 1.0 mM (Fig. 7). With the increase of equilibrium phosphate concentration (CEP) from 0.008 mM to 0.215 mM, tungstate adsorption decreased from 2.32 mmol kg−1 to 1.97 mmol kg−1, while phosphate adsorption increased from −0.19 mmol kg−1 to 7.27 mmol kg−1 (Fig. 7a). Afterwards, with the further increase of CEP to 0.544 mM, tungstate adsorption slightly decreased to 1.92 mmol kg−1, but phosphate adsorption continually increased to 11.55 mmol kg−1. In addition, the molar ratio of equilibrium phosphate concentration to tungstate concentration (CEP/CEW) was much higher than the molar ratio of adsorbed phosphate to tungstate (qP/qW). Therefore, it can be concluded that the soil colloids might have small adsorption sites common to tungstate and phosphate anions and large adsorption sites specific to tungstate or phosphate anions.51 Mulcahy et al.52 concluded that tungstate adsorbs on two types of surface sites of alumina, producing loosely and tightly bound surface species.
 |
| Fig. 7 The influence of phosphate on the tungstate adsorption onto the composite soil. | |
4. Conclusion
Tungstate adsorption onto the oxisols generally reached equilibrium after 7 days equilibration. The adsorption kinetics was fitted best with the pseudo-second-order reaction. Micropore (intraparticle) diffusion and ultramicropore (within clays) diffusion might be the adsorption-limiting mechanism. Tungstate adsorption isotherms are fitted well by both Langmuir model and Freundlich model. The slight increase of pH from 4.93 to 5.23 slightly decreased the tungstate adsorption, while the increase of ionic strength from 0.01 M to 0.1 M NaCl slightly increased the tungstate adsorption. In addition, the increase of phosphate concentration from 0.008 mM to 0.215 mM slightly decreased the tungstate adsorption. These results demonstrate that tungstate was adsorbed onto the tungstate-specific adsorption sites of the soil minerals mainly via inner-sphere complexation. Whereas the soil contains high tungsten (e.g. 21.9 mg kg−1), it still has high tungstate adsorption capacity.
Acknowledgements
This study was supported by the National Natural Science Foundation of China (41371441) and the Ministry of Environmental Protection Funded Project (201309044).
References
- C. Steinmaus, M. Lu, R. L. Todd and A. H. Smith, Environ. Health Perspect., 2004, 112, 766–771 CrossRef.
- N. Strigul, A. Koutsospyros, P. Arienti, C. Christodoulatos, D. Dermatas and W. Braida, Chemosphere, 2005, 61, 248–258 CrossRef CAS.
- A. Koutsospyros, W. Braida, C. Christodoulatos, D. Dermatas and N. Strigul, J. Hazard. Mater., 2006, 136, 1–19 CrossRef CAS.
- N. Strigul, Ecotoxicol. Environ. Saf., 2010, 73, 1099–1113 CrossRef CAS.
- I. D. S. Adamakis, E. Panteris and E. P. Eleftheriou, Plant Biol., 2010, 12, 114–124 CrossRef CAS.
- N. Strigul, A. Koutsospyros and C. Christodoulatos, Ecotoxicol. Environ. Saf., 2010, 73, 164–171 CrossRef CAS.
- J. P. Gustafsson, Chem. Geol., 2003, 200, 105–115 CrossRef CAS.
- R. L. Seiler, K. G. Stollenwerk and J. R. Garbarino, Appl. Geochem., 2005, 20, 423–441 CrossRef CAS.
- G. S. Tuna, W. Braida, A. Ogundipe and D. Strickland, Chemosphere, 2012, 86, 1001–1007 CrossRef CAS.
- N. Xu, C. Christodoulatos, A. Koutsospyros and W. Braida, Land Contam. Reclamat., 2009, 17, 45–57 CrossRef.
- M. J. Vissenberg, L. J. M. Joosten, M. M. E. H. Heffels, A. J. van Welsenes, V. H. J. de Beer, R. A. van Santen and J. A. R. van Veen, J. Phys. Chem., 2000, 104, 8456–8461 CrossRef CAS.
- N. Xu, C. Christodoulatos and W. Braida, Chemosphere, 2006, 62, 1726–1735 CrossRef CAS.
- G. Sen Tuna and W. Braida, Soil Sediment Contam., 2014, 23, 838–849 CrossRef CAS.
- A. J. Bednar, W. T. Jones, R. E. Boyd, D. B. Ringelberg and S. L. Larson, J. Environ. Qual., 2008, 37, 229–233 CrossRef CAS.
- A. Mikkonen and J. Tummavuori, Acta Agric. Scand., Sect. B, 1993, 43, 11–15 CAS.
- A. Mikkola and J. Tummavuori, Acta Agric. Scand., Sect. B, 1993, 43, 23–217 Search PubMed.
- C. Y. Lin, R. P. Li, H. G. Cheng, J. Wang and X. Shao, PLoS One, 2014, 9, 1–8 CAS.
- E. Ben-Dor and A. Banin, Commun. Soil Sci. Plant Anal., 1989, 20, 1675–1695 CrossRef.
- C. Y. Lin, M. C. He, Y. X. Zhou, W. Guo and Z. F. Yang, Environ. Monit. Assess., 2008, 137, 329–342 CrossRef CAS.
- J. L. He, G. Y. Xu, H. M. Zhu and G. H. Peng, Background contents of elements in the soils of Jiangxi Province, Publishing House of Chinese Environmental Sciences, Beijing, 2006 Search PubMed.
- F. S. Wei, J. S. Chen, Y. Y. Wu, C. J. Zheng and D. Z. Jiang, Background contents of elements in China soils, Publishing House of Chinese Environmental Sciences, Beijing, 1990 Search PubMed.
- H. J. M. Bowen, Environmental chemistry of the elements, Academic Press, London, 1979 Search PubMed.
- L. Axe and P. R. Anderson, J. Colloid Interface Sci., 1997, 185, 436–448 CrossRef CAS.
- S. L. Wang, C. Y. Lin, M. C. He, X. T. Liu and S. Q. Liu, Water Environ. Res., 2013, 85, 687–695 CrossRef CAS.
- Y. S. Ho, J. Hazard. Mater., 2006, 136, 681–689 CrossRef CAS.
- C. H. Wang, W. Guo, B. H. Tian, Y. S. Pei and K. J. Zhang, J. Environ. Sci. Health, Part A: Toxic/Hazard. Subst. Environ. Eng., 2011, 46, 1632–1639 CrossRef CAS.
- G. E. Boyd, A. W. Adamson and L. S. Myers Jr, J. Am. Chem. Soc., 1947, 69, 2836–2848 CrossRef CAS.
- J. M. Zachara, S. C. Smith, J. P. McKinley and C. T. Resch, Soil Sci. Soc. Am. J., 1993, 57, 1491–1501 CrossRef CAS.
- T. Undabeytia, S. Nir, G. Rytwo, C. Serban, E. Morillo and C. Maqueda, Environ. Sci. Technol., 2002, 36, 2677–2683 CrossRef CAS.
- E. Guibal, P. McCarrick and J. M. Tobin, Sep. Sci. Technol., 2003, 38, 3049–3073 CrossRef CAS.
- W. J. Weber and J. C. Morris, J. Sanit. Eng. Div., Am. Soc. Civ. Eng., 1963, 89, 31–60 Search PubMed.
- Y. Wu, J. Cao, P. Yilihan, Y. Jin, Y. Wen and J. Zhou, RSC Adv., 2013, 3, 10745–10753 RSC.
- I. Langmuir, J. Am. Chem. Soc., 1918, 40, 1361–1403 CrossRef CAS.
- T. Guo, Y. Q. Hu, X. Gao, X. L. Ye, H. N. Liu and Z. J. Wu, RSC Adv., 2014, 4, 24067–24072 RSC.
- Z. Zhu and W. Li, RSC Adv., 2012, 2, 5178–5184 RSC.
- S. W. Wang, J. Hu, J. X. Li and Y. H. Dong, J. Hazard. Mater., 2009, 167, 44–51 CrossRef CAS.
- J. X. Li, J. Hu, G. D. Sheng, G. X. Zhao and Q. Huang, Colloids Surf., A, 2009, 349, 195–201 CrossRef CAS.
- H. Zhang and H. M. Selim, Environ. Sci. Technol., 2005, 39, 6101–6108 CrossRef CAS.
- D. Dermatas, W. Braida, C. Christodoulatos, N. Strigul, N. Panikov, M. Los and S. Larson, Environ. Forensics, 2004, 5, 5–13 CrossRef CAS.
- F. J. Hingston, A review of anion adsorption, in Adsorption of inorganics at solid-liquid interfaces, ed. M. A. Anderson and A. J. Rubin, Ann Arbon, Michigan, 1981, pp. 51–90 Search PubMed.
- D. L. Sparks, Environmental soil chemistry, Elsevier, Amsterdam, 1995 Search PubMed.
- K. F. Hayes, C. Papelis and J. O. Leckie, J. Colloid Interface Sci., 1988, 125, 717–726 CrossRef CAS.
- M. B. McBride, Clays Clay Miner., 1997, 45, 598–608 CAS.
- S. Goldberg, J. Colloid Interface Sci., 2005, 285, 509–517 CrossRef CAS.
- H. Liu, B. Qing, X. Ye, Q. Li, K. Lee and Z. Wu, Chem. Eng. J., 2009, 151, 235–240 CrossRef CAS.
- S. Goldberg, H. S. Forster and E. L. Heick, Soil Sci. Soc. Am. J., 1993, 57, 704–708 CrossRef CAS.
- K. B. Payne and T. M. Abdel-Fattah, J. Environ. Sci. Health, Part A: Toxic/Hazard. Subst. Environ. Eng., 2005, 40, 723–749 CrossRef CAS.
- H. N. Liu, B. Qing, X. S. Ye, M. Guo, Q. Li, Z. J. Wu, K. Lee, D. Lee and K. Lee, Curr. Appl. Phys., 2009, 9, e280–e283 CrossRef.
- E. A. Deliyanni, D. N. Bakoyannakis, A. L. Zouboulis and K. A. Matis, Chemosphere, 2003, 50, 155–163 CrossRef CAS.
- J. P. Gustafsson, Chem. Geol., 2003, 200, 105–115 CrossRef CAS.
- F. J. Hingston, A. M. Posner and J. P. Quirk, Discuss. Faraday Soc., 1971, 52, 334–342 RSC.
- F. M. Mulcahy, M. J. Fay, A. Proctor, M. Houalla and D. M. Hercules, J. Catal., 1990, 124, 231–240 CrossRef CAS.
|
This journal is © The Royal Society of Chemistry 2014 |
Click here to see how this site uses Cookies. View our privacy policy here.