DOI:
10.1039/C4RA09766A
(Paper)
RSC Adv., 2014,
4, 62862-62868
SnO2@Co3O4 p–n heterostructures fabricated by electrospinning and mechanism analysis enhanced acetone sensing†
Received
4th September 2014
, Accepted 31st October 2014
First published on 31st October 2014
Abstract
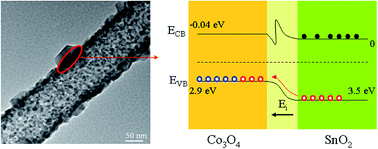
SnO2@Co3O4 p–n heterostructure nanotubes have been obtained for the first time via precursor nanofibres and subsequent annealing. The structure and properties of heterostructure nanotubes were characterized using various analysis methods. The responses of composites with different SnO2 content to 10 ppm acetone have been measured, and found that the composites exhibited higher sensitivity, lower operating temperature and faster response than pure Co3O4. The improvement of sensing characteristics is attributed to the formation of a p–n heterojunction between the two types of semiconductor oxides.
Introduction
Currently, a number of oxide semiconductors as gas sensors are applied to detect harmful and toxic gases. However, during the past few years, the most representative sensor materials are n-type semiconductors such as ZnO, SnO2, WO3 and TiO2.1–4 While little attention has been paid to the development of p-type oxide semiconductor based gas sensors. Likewise, the reports related to gas sensing properties of p-type oxide semiconductors like CuO, Co3O4 and Cr2O3 are relatively insufficient, especially Co3O4.5–8 Co3O4, as a typical p-type semiconductor with a normal spinel structure, has intriguing electronic, electrochemical and electrocatalytic properties, and to be excited, its special structure facilitates electron transportation between Co2+ and Co3+ ions. Co3O4 has shown great potentials due to its effective oxidative catalytic activity and has been thought as one of excellent candidates in future for lithium-ion batteries, supercapacitors, catalysts, and gas sensors.9–13 As is well known, various methods have been utilized to synthesize different morphologies and structures of Co3O4, such as chemical deposition (CVD), pulsed laser deposition, the traditional sol–gel and hydrothermal method.14–18 Nevertheless, the utilization of the above-mentioned methods is limited by some special instruments, harsh conditions, or a relatively high processing temperature. Notably, electrospinning, as a cost-effective, ease of implementation and versatility technique has been in the good graces of researchers, and it can process polymers and related materials into 1D structural fibers with high surface-to-volume ratio, controllable composition, shape, and porous structure formed by annealing.19–22 Because polyvinylpyrrolidone (PVP) is a nontoxic, odorless, environmentally benign polymer, and especially its excellent solubility in dimethyl formamide (DMF), it is commonly served as sacrificial templates, which will be decomposed in the annealing process to obtain hollow fibers of the inorganic shells.23
However, in the field of gas sensors, Co3O4 shows a serious shortcoming of low sensitivity, which may limit their application in actual implementation. Therefore, numerous endeavours should be undertaken to permit the revolution of Co3O4 as a high sensitive material at low operating temperature in detecting targeted gases. Among all kinds of modification methods, compositing with n-type semiconductor can not only modulate the gas sensing characteristics by the strong interactions between the closely packed nano-units in the composite structure, but also extend the electron depletion layer due to the formation of p–n junctions.24 SnO2, as an n-type semiconductor with a wide band gap (Eg = 3.6 eV), has been known as one of excellent gas sensing materials.25,26 Thus SnO2@Co3O4 composite provides a good opportunity to improve gas response by the formation of heterojunction in the interface between n-type and p-type semiconductor oxide. In this work, we first designed SnO2@Co3O4 nanotubes by electrospinning technique, and further explored the influence of different SnO2 content and operating temperature on the gas properties of SnO2@Co3O4 nanotubes to 10 ppm acetone.
Experimental
Preparation of SnO2@Co3O4 nanotubes
To prepare the metal precursor solution, 1.5 g cobalt(II) acetate tetrahydrate [(CH3COO)2·4H2O], 0.15 g stannous chloride dehydrate (SnCl2·2H2O) was dissolved in 9 ml of N,N-dimethylformamide (DMF) and continuously stirred at room temperature until the solution is transparent and uniform. Then, 0.75 g polyvinylpyrrolidone (PVP, Mw = 1
300
000) was dissolved and stirred in the precursor solution for 6 h. The feeding rate was controlled at 0.0006 mm s−1, during electrospinning and a stainless steel foil, employed as a collector, was vertically positioned 20 cm away from the syringe needle under a constant potential of 20 kV. Subsequently, the obtained precursor nanofibers were annealed at 500 °C for 2 h with keeping the heating rate of 5 °C min−1 in an air atmosphere. Similarly, the samples with addition of 0.3, 0.375 and 0.75 g SnCl2·2H2O were prepared with the same method, and pure Co3O4 nanofibers was prepared just without adding SnCl2·2H2O.
Characterization
The structure properties were examined by field emission scanning electron microscopy (FESEM) with a Zeiss Supra 55 instrument operated at 20 kV, a transmission electron microscope (TEM), X-ray diffraction (XRD, a Rigaku D/MAX-2500 X-ray diffractometer with copper Kα radiation (λ = 1.54178 Å)). Adsorption–desorption isotherms of N2 on solid samples were measured at 77 K on Quadra Sorb Station 4 apparatus, from which the Brunauer–Emmett–Teller (BET) surface area was calculated in terms of the multipoint BET method. The thermogravimetric (TG) analysis was carried out in dynamic air atmosphere (75 mL min−1) with a heating rate of 10 °C min−1 using NETZSCH STA 449 F3 thermal analyzer. X-ray photoelectron spectroscopy (XPS) surface characterizations were performed on a VG ESCALAB-MK electron spectrometer with Al Kα source.
Gas sensing characteristics
The products were mixed with ethanol to form the suspension solution, and then pasted onto a ceramic tube between two Au electrodes to form a thin film. A resistance heater in the ceramic tube was used to control the temperature. For SnO2@Co3O4 heterostructure, the sensor response for acetone is defined as the ratio of the resistance in acetone (Racetone) to that in air (Rair).
Results and discussion
Structure and morphology
Here, an electrospinning method was adopted to get the heterostructure nanotubes by controlling the common electrospun parameters, such as the PVP content in the precursor solution and the annealing temperature. We have synthesized composites with the different ratio of Co to Sn. Herein, we take Co
:
Sn = 4.5
:
1 as an example to illustrate the morphologies of SnO2@Co3O4 nanotubes because all samples have nearly a similar appearance. Fig. 1a–e show the typical SEM images of Co3O4 and SnO2@Co3O4 composite, respectively. From Fig. 1a, it can be observed that these randomly oriented nanofibers had a smooth and approximately uniform surface due to the amorphous nature of the PVP/cobalt acetate composite nanofibers. Meanwhile, the PVP/cobalt acetate composite nanofibers have diameters of 200–300 nm. The annealing process of the fibers at 500 °C for 2 h made the precursor convert into Co3O4 and correspondingly the diameters shrunk to 100–200 nm (Fig. 1b), owing to the removal of PVP polymers template and the crystallization of Co3O4. As for the PVP/stannous chloride/cobalt acetate composite nanofibers in Fig. 1c, they show the same morphology with PVP/cobalt acetate composite nanofibers. While SnO2@Co3O4 heterojunction structure (Fig. 1d) obtained by annealing process not only has diameters ranged from 100 to 200 nm, but also presents the hollow structure affirmed by the cross section observed from the higher magnified SEM image (Fig. 1e). And note that their surfaces implanted by some irregular shape nanoparticles are rough and the wall thicknesses are determined to be ∼25 nm. To further obtain more information about the structure characteristics of SnO2@Co3O4 nanotubes, the TEM and HRTEM images were given in Fig. 1f–i. From Fig. 1f–g, it is observed that the nanotubes are composed of countless nanoscale single crystallites which are agglomerated one by one along the direction of the nanotube axis, resulting in the porous structure. More exhaustive information about SnO2@Co3O4 nanotubes local structure is determined by HRTEM images in Fig. 1h–i. Interplanar distances of 0.463 nm and 0.328 nm correspond to the (111) plane of cubic Co3O4 and the (110) plane of tetragonal SnO2, respectively, where is located in the middle of a nanotube. While the amplification part is selected at the edge of the nanotube as Fig. 1i, the lattice spacing is calculated to be 0.457 nm, which is consistent with the (111) plane of SnO2.
 |
| Fig. 1 Morphologies and crystal structures of Co3O4 nanofibers and SnO2@Co3O4 nanotubes: (a) SEM images of the PVP/cobalt acetate composite; (b) SEM images of Co3O4 nanofibers; (c) SEM images of the PVP/stannous chloride/cobalt acetate composite nanofibers; (d) SEM images of SnO2@Co3O4 nanotubes; (e) magnified SEM image of (d); (f) and (g) TEM images of SnO2@Co3O4 nanotubes; (h) and (i) HRTEM images and lattice fringe of SnO2@Co3O4 nanotube. | |
In the XRD pattern of Co3O4 sample (Fig. 2a), it displays distinguishable of (111), (220), (311), (400), (511) and (440), which is assigned to the cubic Co3O4 (JCPDS # 43-1003). For SnO2@Co3O4 samples (Fig. 2b–d) there are another three peaks of (110), (101), (211) corresponding to tetragonal SnO2 (JCPDS # 41-1445). No obvious peak shift or any other characteristic peaks (especially corresponding to salts), indicates that Co3O4 and SnO2 with separate phases coexist in the system, providing a chance of the formation of p–n junction in the interface between Co3O4 and SnO2. What is more, with the increase of SnO2 content, the peak intensity of Co3O4 recedes, yet it increases for SnO2.
 |
| Fig. 2 X-ray diffraction patterns of (a) Co3O4; (b) SnO2@Co3O4 composite with Co : Sn = 9 : 1; (c) SnO2@Co3O4 composite with Co : Sn = 4.5 : 1; (d) SnO2@Co3O4 composite with Co : Sn = 1.8 : 1. | |
Thermogravimetric analysis (TGA) was employed to determine the decomposition temperature of PVP/cobalt acetate composite nanofibers (Fig. 3). There are three distinctive regions in the process. In the first region below 240 °C, N,N-dimethylformamide (DMF) in the composite fibers was vaporized. With the temperature rising up, the second region indicated the thermal decomposition of PVP associated with the conversion of inorganic salts to metal oxides, corresponding to the weight loss of 52%. As the temperature was increased up to 480 °C, the weight remained uncharged.27 Therefore, the annealing temperature of 500 °C for 2 h is reasonable. Besides, a possible mechanism for the formation of SnO2@Co3O4 nanotubes is suggested as shown in Fig. 4. The slowly heating rate and the constant temperature and time are crucial factors to the nanotubes formation. During the gradually decomposition of PVP in the annealing, some Co3O4 and SnO2 primary nanoparticles are formed in the precursor fibers. At a relatively lower temperature, the heat is distributed unevenly so that the reaction rate on the outside is larger than that in the inner, which results in the construction of outside nanoparticles and formation of loose nanowires. However, when the temperature reaches to an appropriate temperature, the reaction rate will be enhanced rapidly. And under the condition that the outside particles constrict, while the inner particles expand because of the large strain strength, SnO2@Co3O4 nanotubes are produced.28–30
 |
| Fig. 3 TG/DTA curve of PVP/stannous chloride/cobalt acetate composite nanofibers. | |
 |
| Fig. 4 A possible mechanism for the formation of SnO2@Co3O4 nanotubes. | |
Fig. 5 shows the representative Raman spectra of pure Co3O4 and SnO2@Co3O4 composite. In Fig. 5a there are three observed peaks centered at 485, 524, 695 cm−1, which are assigned to the Raman-active modes (Eg, F2g, A1g) of Co3O4, respectively.31,32 With the addition of SnO2, the Raman spectra of SnO2@Co3O4 composite is similar to pure Co3O4, but it is obvious to find that the Raman peaks shift to lower wavenumbers and the peak intensities decrease. Especially, the strongest peak (Fig. 5b) shift from 695 to 689 cm−1, which is a sensitive indication of the defects and oxygen vacancies, but not the structural transformation.33,34 Besides, the intensity of peak at 485 cm−1 decreases with respect to the peak at 524 cm−1 with SnO2 addition (Fig. 5c). The decrease in the intensity ratio (I485/I524) adequately inflects the increase of defects and oxygen vacancies, which results in the improvement of gas sensitivity.34
 |
| Fig. 5 Raman spectra of Co3O4 and SnO2@Co3O4 composite with Co : Sn = 4.5 : 1. | |
To further explore the surface properties of the composite, XPS quantitative analyses were also carried out. To this regard, Fig. 6 shows experimental and fitted photoelectron spectra of Co 2p, O 1s and Sn 3d. The spectrum of Co 2p displayed spin–orbit splitting in 2p1/2 and 2p3/2 components, corresponding to the binding energies at 795.85 eV and 780.55 eV, which is consist with the reported literatures.35–37 Furthermore, Co 2p2/3 can be divided into two peaks with the binding energies of Co3+ and Co2+ ions at 780.00 and 781.55 eV.38,39 Meanwhile, note that two shakeup satellite peaks were located at 787.12 eV and 803.85 eV, which are important characteristics to further confirm the Co3O4 crystal phase. Fig. 6b shows that the O 1s spectra can be appreciably fitted to three peaks centered at 530.32, 531.25, 532.44 eV, respectively. The peak at 530.32 eV should be attributed to the lattice oxygen (OL) in the Co3O4 phase; the peak at 531.25 eV is associated with surface adsorbed oxygen species (Oads, O2−, O2−, or O−) caused by the unsaturated oxygen species within the matrix of Co3O4; and the OC peak at 532.44 eV is ascribed to contributions from hydroxyl/carbonate specie.38,40,41 As we all know, the excellent chemisorbed ability to oxygen species is beneficial to the enhancement of gas sensitivity. As for the characterized sample, the percentage of the OC component is about 18.0%. Similarly, the peaks appearing in Fig. 6c are located at 486.85 and 495.25 eV, which are assigned to Sn 3d5/2 and Sn 3d3/2, respectively. And the binding energy difference between the Sn 3d5/2 and Sn 3d3/2 level (8.4 eV) is also in good agreement with the standard data for Sn4+ in SnO2 as reported in the literature.42,43
 |
| Fig. 6 X-ray photoelectron spectra of SnO2@Co3O4 composite with Co : Sn = 4.5 : 1. (a) Co 2p; (b) O 1s; (c) Sn 3d. | |
Gas sensing properties
Acetone is known to be used commonly as chemical reagent in industry and lab, it can cause many health problems. Besides, it can also act as a biomarker for diagnosis of diabetes. In general speaking, the concentration of acetone in the healthy human breath is less than 0.9 ppm, while for diabetic patients, it is more than 1.8 ppm. So SnO2@Co3O4 composite gas sensors to acetone were investigated as shown in Fig. 7. The results suggest that the response of SnO2@Co3O4 composite gas sensor to 10 ppm acetone is a function of operating temperature. It exhibits a trend of “increase-maximum-decay” behaviour with the increment of operating temperature. For the composite with Co
:
Sn = 4.5
:
1, the response first increases with the operating temperature, up to 135 °C, and then gradually decreases. At the inflection point of 135 °C, the response reaches the maximum value of 2.72, which is called the optimum operation temperature. Interestingly, it is found that pure Co3O4 shows a low response of 1.28 to acetone at its optimum operation temperature of 160 °C, however, modification with SnO2 can achieve a tremendous increase in sensitivity and even the sensor response is also measured as a function of SnO2 concentration at respective optimum operation temperature. The response for the composite with Co
:
Sn = 9
:
1 is 1.55, corresponding to the operating temperature of 150 °C, while it is 2.72 for the composite with Co
:
Sn = 4.5
:
1, to the operating temperature of 135 °C, and making matter worse, for the composite with Co
:
Sn = 1.8
:
1, it is just 1.29 at the temperature of 135 °C. Therefore, a speculation is obtained that the higher SnO2 concentration may not further improve sensing performance, instead, it perhaps hinder the properties of the gas sensing.
 |
| Fig. 7 Gas responses of Co3O4 and Co3O4 modified with different SnO2 concentrations: (a) pure Co3O4; (b) Co : Sn = 9 : 1; (c) Co : Sn = 4.5 : 1; (d) Co : Sn = 1.8 : 1. | |
This phenomenon can be illuminated in Fig. 8. The oxygen-deficient SnO2 displays n-type conductivity by elections, while oxygen-excess Co3O4 shows p-type by holes. Combination of two type semiconductors means that the conduction channel is no longer same as single type material. For SnO2@Co3O4 composite, there are five distinct types of conductive pathways: n–n, forward bias p–n, reverse bias p–n, p–p, and grain contacts with voids. However, of the five possible pathways, the grain-avoid and the reverse-biased p–n interfaces are highly resistive, and the carriers are always apt to transport via a low resistance channel. Therefore we simulate three conduction models of SnO2@Co3O4 composite to explain the effect of SnO2 content.44 It is clearly evident from Fig. 8 that only modification with modest content of SnO2 can provide sufficient p–n junctions to improve gas sensing response enormously. Though it is speculated that though the increment of SnO2 will enhance the surface roughness to provide more adsorption sites for gaseous molecules, the p–n junctions formed between SnO2 and Co3O4 play more important role than the surface area.45,46 Additionally, the effect of SnO2 concentration on the operating temperature is transparent, that is, lower or higher SnO2 concentration makes the optimum operating temperature of gas sensor shift towards higher temperature.
 |
| Fig. 8 Three conduction models of SnO2@Co3O4 composites with different SnO2 contents. | |
Fig. 9a shows the representative transient response curve of composite upon exposing different acetone concentrations from 2 to 50 ppm at the optimum operation temperature of 140 °C. The output voltage of composite decreases abruptly in the presence of acetone and recover to the initial state upon the introduction of air, which is in agreement with the characteristics of typical p-type semiconductor.
 |
| Fig. 9 (a) Acetone gas-sensing behaviors of SnO2@Co3O4 composite with Co : Sn = 4.5 : 1 at 140 °C to different acetone concentrations in the range of 2 to 50 ppm (inset: A liner relationship between the response of sensor to acetone and the acetone concentration); (b) the response plots of Co3O4 to 10 ppm acetone; (c) the response plots of SnO2@Co3O4 composite with Co : Sn = 4.5 : 1 to 10 ppm acetone. | |
Furthermore, the output voltage decreases more with the increased acetone gas concentration. A liner relationship between the response and acetone concentration was been carried out (see inset in Fig. 9a). It is observed that there are two types of liner relationship, one is located in the low acetone concentration (2–10 ppm), and another liner relationship is in high concentration range between 10 and 50 ppm. The response characteristics of pure Co3O4 and composite to 10 ppm acetone are investigated at their optimum operation temperature (160 °C and 140 °C), as shown in Fig. 9b and c. The response time of pure Co3O4 is 48 s, while it is 35 s for the composite. It is obvious that the composite responses rapidly when acetone gas is injected into the test chamber. In a practical application, the sensor should possess the ability of anti-interference for other gases, that is, sensor's selectivity. Fig. 10 shows the response of sensor based on pure Co3O4 and composite with Co
:
Sn = 4.5
:
1 to 10 ppm various gases at their optimum operating temperature. We can see that the obvious selectivity makes senor possible to detect acetone from a mixture of gases.
 |
| Fig. 10 Response of sensor based on pure Co3O4 and composite with Co : Sn = 4.5 : 1 to 10 ppm various gases at their optimum operating temperature. | |
Gas sensing mechanism of SnO2@Co3O4 composite
The results obviously suggest that the SnO2@Co3O4 composites exhibit enhanced gas sensing properties, which must be correlated with the band configuration of SnO2@Co3O4. A p–n heterojunction formed at the interface between Co3O4 and SnO2 is considered as the vital important favour of enhancing response.47 To further investigate the gas sensing mechanism, the Co3O4 and SnO2 band edge positions are predicted (eqn (1) and (2)) to determine the migration directions of the carriers.48where X is the absolute electronegativity of the semiconductor, which is geometric mean of the absolute electronegativity of the constituent atoms; Ee is the energy of free electrons on the hydrogen scale (∼4.5 eV); Eg is the band gap of the semiconductor.
The predicted band edge positions of Co3O4 and SnO2 are exhibited in the ESI (Table 1S†). It can be seen that the valence band (VB) edge potential of SnO2 is lower than that of Co3O4. Hence, in according with thermodynamic principle, holes of SnO2 can easily transfer to VB of Co3O4, resulting in a thicker surface holes accumulation layer at the interface between Co3O4 and SnO2. As we all know, the direction of built-in electric field formed by the transform of electrons to p-type Co3O4 and the holes to n-type SnO2 until the system obtains equalization of the Fermi levels is from n-type to p-type semiconductor. As for forward bias p–n as shown in Fig. 11a, when the SnO2@Co3O4 composite is exposed to air, the concentration of holes in Co3O4 is enhanced, but electrons in SnO2 decrease. From Fig. 11a, we can see that holes can transfer from n-type to p-type semiconductor, leading to an increase in the electrical current in the heterocontacts. However, when acetone is injected into test chamber, the subsequent reaction releases electrons into the conduction band of Co3O4 and SnO2, reducing the concentration of holes, meanwhile electrons cannot transfer between n-type and p-type semiconductor because of the potential barrier in the internal field.48 Therefore, the resistance of SnO2@Co3O4 is increased greatly. Meanwhile, the separation of electrons and holes is enhanced greatly and more electrons react with O2. All above-mentioned phenomena can contribute to the response improvement. On the contrary, for reverse bias p–n in Fig. 11b, holes must pass across the p–n interface and then transfer to the external circuit. As is known to all, current would more likely avoid the highly resistive pathway, and instead choose a conductive path, so forward bias p–n junction play an important role in the enhancement of gas response. In addition, the enhanced gas sensing behaviour of SnO2@Co3O4 nanotubes is also related to the higher surface area (22.326 m2 g−1) compared to that of Co3O4 (20.885 m2 g−1) (see ESI, Fig. S2†).
 |
| Fig. 11 Schematic diagrams to illustrate the influence of p–n heterojunction on gas response: (a) the direction of external circuit is similar to that of built-in electric field; (b) the direction of external circuit is opposite to that of built-in electric field. | |
Conclusions
In summary, the SnO2@Co3O4 composites were prepared by a simple and versatility electrospinning technique, we applied Co3O4 and Co3O4 modified with different concentration of SnO2 to semiconducting gas sensors and compared their gas sensing properties. SnO2@Co3O4 composite (Co
:
Sn = 4.5
:
1) exhibits higher acetone sensing compared to pure Co3O4. In addition, the SnO2@Co3O4 composites can not only improve the response, but also lowered the optimum operating temperature because of modification with different SnO2 concentrations. The variation of gas sensing characteristics is ascribed to the formation of p–n heterojunction and analysed in detail by thermodynamic principle and XPS characterization.
Acknowledgements
This work was supported by the National Natural Science Foundation of China (Grant nos 21177007 and 51372013), the Fundamental Research Funds for the Central Universities (YS1406) and the Dean Project of Guangxi Key Laboratory of Petrochemical Resource Processing and Process Intensification Technology.
Notes and references
- M. S. Yao, Y. B. Cao, P. Hu, J. M. Fan, C. Lu, F. L. Yuan, C. Y. Shi and Y. F. Chen, Sens. Actuators, B, 2014, 201, 255–265 CrossRef.
- H. Wang, Y. Qu, H. Chen, Z. D. Lin and K. Dai, Sens. Actuators, B, 2014, 201, 369–377 CrossRef.
- Y. B. Shen, B. Q. Zhang, X. M. Cao, D. Z. Wei, J. W. Ma, L. J. Jia, S. L. Gao, B. Y. Cui and Y. C. Jin, Sens. Actuators, B, 2014, 193, 273–279 CrossRef CAS.
- Y. J. Choi, Z. Seeley, A. Bandyopadhyay, S. Bose and S. A. Akbar, Sens. Actuators, B, 2007, 124, 111–117 CrossRef CAS.
- S. Steinhauer, E. Brunet, T. Maier, G. C. Mutinati, A. Köck, O. Freudenberg, C. Gspan, W. Grogger, A. Neuhold and R. Resel, Sens. Actuators, B, 2013, 187, 50–57 CrossRef CAS.
- Y. J. Liu, G. X. Zhu, B. L. Ge, H. Zhou, A. H. Yuan and X. P. Shen, CrystEngComm, 2012, 14, 6264–6270 RSC.
- A. Stănoiu, C. E. Simion, L. Diamandescu, D. Tărăbăşanu-Mihăilă and M. Feder, Thin Solid Films, 2012, 522, 395–400 CrossRef.
- H. J. Kim and J. H. Lee, Sens. Actuators, B, 2014, 192, 607–627 CrossRef CAS.
- J. Park, X. Shen and G. Wang, Sens. Actuators, B, 2009, 136, 494–498 CrossRef CAS.
- B. Guo, C. Li and Z. Yuan, J. Phys. Chem. C, 2010, 114, 12805–12817 CAS.
- J. C. Deng, L. T. Kang, G. L. Bai, P. Y. Li, X. G. Liu, Y. Z. Yang, F. Gao and W. Liang, Electrochim. Acta, 2014, 132, 127–135 CrossRef CAS.
- H.-F. Wang, R. Kavanagh, Y.-L. Guo, Y. Guo, G. Lu and P. Hu, J. Catal., 2012, 296, 110–119 CrossRef CAS.
- Z. Wen, L. Zhu, W. Mei, L. Hu, Y. Li, L. Sun, H. Cai and Z. Ye, Sens. Actuators, B, 2013, 186, 172–179 CrossRef CAS.
- Y. Wang, Z. Y. Zhong, Y. Chen, C. T. Ng and J. Y. Lin, Nano. Res., 2011, 4(7), 695–704 CrossRef CAS.
- H. Sun, Y. Liu, Y. Yu, M. Ahmad, D. Nan and J. Zhu, Electrochim. Acta, 2014, 118, 1–9 CrossRef CAS.
- T. Warang, N. Patel, A. Santini, N. Bazzanella, A. Kale and A. Miotello, Appl. Catal., A, 2012, 423–424, 21–27 CrossRef CAS PubMed.
- S. N. Karthick, K. V. Hemalatha, C. Justin Raj, H. Je Kim and M. Yi, J. Nanopart. Res., 2013, 15, 1474 CrossRef.
- M. Y. Nassar, Mater. Lett., 2013, 94, 112–115 CrossRef CAS PubMed.
- R. Ostermann, D. Li, Y. D. Yin, J. T. McCann and Y. Xia, Nano Lett., 2006, 6, 1297–1302 CrossRef CAS PubMed.
- Z. Y. Zhang, X. H. Li, C. H. Wang, L. M. Wei, Y. C. Liu and C. L. Shao, J. Phys. Chem. C, 2009, 113, 19397–19403 CAS.
- R. A. Kadir, Z. Y. Li, A. Z. Sadek, R. A. Rani, A. S. Zoolfakar, M. R. Field, J. Z. Ou, A. F. Chrimes and K. Kalantar-zadeh, J. Phys. Chem. C, 2014, 118, 3129–3139 Search PubMed.
- N. G. Cho, H. S. Woo, J. H. Lee and I. D. Kim, Chem. Commun., 2011, 47, 11300–11302 RSC.
- S. S. Mali, H. Kim, W. Y. Jang, H. S. Park, P. S. Patil and C. K. Hong, ACS Sustainable Chem. Eng., 2013, 1, 1207–1213 CrossRef CAS.
- C. W. Na, H. S. Woo, I. D. Kim and J. H. Lee, Chem. Commun., 2011, 47, 5148–5150 RSC.
- S. Ding, D. Luan, F. Y. Boey, J. S. Chen and X. W. Lou, Chem. Commun., 2011, 47, 7155–7157 RSC.
- L. Xiao, H. Shen, R. von Hagen, J. Pan, L. Belkoura and S. Mathur, Chem. Commun., 2010, 46, 6509–6511 RSC.
- L. Xu, R. Zheng, S. Liu, J. Song, J. Chen, B. Dong and H. Song, Inorg. Chem., 2012, 51, 7733–7740 CrossRef CAS.
- L. Xu, H. Song, B. Dong, Y. Wang, J. Chen and X. Bai, Inorg. Chem., 2010, 49, 10590–10597 CrossRef CAS.
- X. Bai, H. Ji, P. Gao, Y. Zhang and X. Sun, Sens. Actuators, B, 2014, 193, 100–106 CrossRef CAS.
- S. H. Choi, I. S. Hwang, J. H. Lee, S. G. Oh and I. D. Kim, Chem. Commun., 2011, 47, 9315–9317 RSC.
- C. J. Jia, M. Schwickardi, C. Weidenthaler, W. Schmidt, S. Korhonen, B. M. Weckhuysen and F. Schuth, J. Am. Chem. Soc., 2011, 133, 11279–11288 CrossRef CAS.
- Q. Jiao, M. Fu, C. You, Y. Zhao and H. Li, Inorg. Chem., 2012, 51, 11513–11520 CrossRef CAS.
- J. Li, G. Lu, G. Wu, D. Mao, Y. Guo, Y. Wang and Y. Guo, RSC Adv., 2013, 3, 12409 RSC.
- N. Illyaskutty, S. Sreedhar, H. Kohler, R. Philip, V. Rajan and V. P. M. Pillai, J. Phys. Chem. C, 2013, 117, 7818–7829 CAS.
- F. Qu, J. Liu, Y. Wang, S. Wen, Y. Chen, X. Li and S. Ruan, Sens. Actuators, B, 2014, 199, 346–353 CrossRef CAS PubMed.
- L. F. Liotta, G. Di Carlo, G. Pantaleo, A. M. Venezia and G. Deganello, Appl. Catal., B, 2006, 66, 217–227 CrossRef CAS PubMed.
- L. Li, M. Liu, S. He and W. Chen, Anal. Chem., 2014, 86, 7996–8002 CrossRef CAS PubMed.
- J. Li, G. Lu, G. Wu, D. Mao, Y. Guo, Y. Wang and Y. Guo, Catal. Sci. Technol., 2014, 4, 1268 CAS.
- B. Y. Bai and J. H. Li, ACS Catal., 2014, 4, 2753–2762 CrossRef CAS.
- D. Barreca, A. Gasparotto, O. I. Lebedev, C. Maccato, A. Pozza, E. Tondello, S. Turner and G. V. Tendeloo, CrystEngComm, 2010, 12, 2185–2197 RSC.
- Y. Y. Lü, W. W. Zhan, Y. He, Y. T. Wang, X. J. Kong, Q. Kuang, Z. X. Xie and L. S. Zheng, ACS Appl. Mater. Interfaces, 2014, 6, 4186–4195 Search PubMed.
- S. Balachandran, K. Selvam, B. Babu and M. Swaminathan, Dalton Trans., 2013, 42, 16365–16374 RSC.
- J. C. Huo, Y. J. Hu, H. Jiang, W. J. Huang and C. Z. Li, J. Mater. Chem. A., 2014, 2, 8266–8272 CAS.
- Y. Shimizu, N. Nakashima, T. Hyodo and M. Egashira, J. Electroceram., 2001, 6, 209–217 CrossRef CAS.
- M. Mashock, K. Yu, S. Cui, S. Mao, G. Lu and J. H. Chen, ACS Appl. Mater. Interfaces, 2012, 4, 4192–4199 CAS.
- M. Choudharya, N. K. Singh, V. N. Mishra and R. Dwivedi, Mater. Chem. Phys., 2013, 142, 370–380 CrossRef PubMed.
- Z. Lou, L. L. Wang, T. Fei and T. Zhang, New J. Chem., 2012, 36, 1003–1007 RSC.
- Y. Q. Liang, Z. D. Cui, S. L. Zhu, Z. Y. Li, X. J. Yang, Y. J. Chen and J. M. Ma, Nanoscale, 2013, 5, 10916–10926 RSC.
Footnote |
† Electronic supplementary information (ESI) available. See DOI: 10.1039/c4ra09766a |
|
This journal is © The Royal Society of Chemistry 2014 |
Click here to see how this site uses Cookies. View our privacy policy here.