Solid state plasmonic dye sensitized solar cells based on solution processed perovskite CsSnI3 as the hole transporter

N. Chander*, P. S. Chandrasekhar and V. K. Komarala
Photovoltaic Laboratory, Centre for Energy Studies, Indian Institute of Technology Delhi, New Delhi-110016, India. E-mail: nikhilphysics@gmail.com

Received 3rd September 2014 , Accepted 20th October 2014

First published on 20th October 2014


Abstract

Perovskite CsSnI3 was synthesized by a facile low temperature solution based method and used as a hole transport material in solid state dye sensitized solar cells (ss-DSCs). DSCs with an efficiency of ∼3.5% were fabricated in this fashion. Further, by adopting a plasmonics concept for enhancing the absorption process in the device, gold nanoparticles with optimized concentration having an average size ∼18 nm were mixed in TiO2 paste to fabricate plasmonic ss-DSCs. An enhancement of ∼23% in photocurrent was observed and an efficiency of ∼4.2% was obtained for the case of plasmonic ss-DSCs fabricated with an Au–TiO2 weight ratio of 0.3 wt%. Electrochemical impedance spectroscopy study revealed enhanced electron lifetimes for plasmonic ss-DSCs, which are due to the accelerated charge transport under the Au NPs' plasmon near-fields leading to a reduction in transport resistance and the recombination process.

Introduction

Dye sensitized solar cells (DSC) make use of liquid electrolyte, a technical limitation, which has prevented their widespread deployment in actual working conditions in the field. Solid state DSCs (ss-DSCs) based on the spiro-OMeTAD hole transport material (HTM) have relatively low efficiencies and suffer from poor pore filling of the nano-TiO2 and long term stability problems.1 It has been established previously that spiro-OMeTAD based ss-DSCs have high electron transport resistance and low electron diffusion length and recombination time.2 The ss-DSCs using spiro-OMeTAD as the HTM employ special dyes and thin TiO2 films, but still the best efficiencies have reached only ∼7%.3 Low pore filling of nano-TiO2 by spiro-OMeTAD also disrupts the hole transport between the adsorbed dye molecules and HTM. A combination of all these factors leads to a relatively lower efficiency and has prevented the development of spiro-OMeTAD based ss-DSCs.

Recently, an inorganic p-type semiconductor, CsSnI3, was employed as a solid electrolyte in DSCs and showed promising efficiency.4 Following this work, a thin film Schottky solar cell based on CsSnI3 was reported, though the efficiency was less than 1%.5 A facile solution based method for the fabrication of CsSnI3 has also been reported.6 This material has been shown to possess excellent conductivity and hole mobility, far in excess of those obtained for spiro-OMeTAD.4 But surprisingly, no other reports describing the use of CsSnI3 in DSCs or as thin film solar cells have been reported and the material still remains largely unexplored for photovoltaic applications. In the present work, we show that the one-pot solution synthesized perovskite CsSnI3 works as well as the high temperature melt-synthesized CsSnI3; and functions well as a solid state electrolyte, both in normal and plasmonic DSCs, and the cells have good power conversion efficiencies.

Experimental

Synthesis of perovskite CsSnI3 by solution route

The perovskite CsSnI3 was synthesized by a slight modification of one-pot solution route as described by Zhou et al.6 Anhydrous CsI (0.21 g, CDH, India) and SnI2 (0.3 g, Alfa Aesar) were dissolved in 3 ml of 1[thin space (1/6-em)]:[thin space (1/6-em)]3[thin space (1/6-em)]:[thin space (1/6-em)]2 mixture of methoxyacetonitrile (Acros Organics), N,N-dimethylformamide (Sigma Aldrich) and acetonitrile (Fisher Scientific). The reaction was carried out under nitrogen atmosphere for 12 h with continuous stirring. The obtained yellow-brown colored solution was filtered and drop-casted on microscope glass slides and evaporation of solution was carried out in a vacuum oven at 90 °C. The dried material was scraped off glass slides and re-dispersed in a 3[thin space (1/6-em)]:[thin space (1/6-em)]2 volume mixture of N,N-DMF and acetonitrile. About 200 mg of the black colored powder was dissolved in 5 ml of the mixed polar solvents to obtain a transparent yellow solution.

Synthesis of gold nanoparticles and preparation of plasmonic paste

The Turkevich method was used to synthesize gold nanoparticles (GNPs) of average size ∼18 nm. A 50 ml aqueous solution of 1 mM hydrogen tetrachloroaurate (III) trihydrate (HAuCl4·3H2O) was brought to boil on a hot plate. About 2.5 ml of 1% w/w trisodium citrate dihydrate aqueous solution was added to the boiling solution under stirring. The heating and stirring was further continued for 10 min. A clear red colored solution was obtained in this fashion. The size of the GNPs thus prepared was estimated to be ∼18 nm (see Fig. S1 in ESI). About 2.5 ml of a 5% polyvinylpyrrolidone (PVP) solution in de-ionized water was added to 50 ml of as synthesized GNPs solution and stirred for 12 h at room temperature. Afterwards the solution was centrifuged at 12[thin space (1/6-em)]000 rpm for 30 min. The supernatant was removed and the GNPs collected at the bottom of centrifuge tubes were weighed and re-dispersed in ethanol. The GNPs dispersed in ethanol were mixed in desired Au–TiO2 weight ratios (0.1, 0.3 and 0.7 wt%) with the commercial TiO2 paste to form ‘plasmonic’ pastes, which were further used to fabricate the plasmonic TiO2–Au films. Since extra ethanol (i.e. ethanol dispersion of GNPs) was added to the plasmonic paste, it was slightly less viscous than the normal TiO2 paste; although most of the extra ethanol was evaporated by vacuum annealing the paste at 40 °C for 2 hours.

Fabrication of solid-state dye sensitized solar cells

Fluorine doped tin oxide (FTO) glass substrates were cleaned using soap water, de-ionized water, acetone and propanol. An ∼80 nm compact TiO2 layer was deposited on FTO substrates by spray pyrolysis of a solution of titanium diisopropoxide bis(acetylacetonate) (Sigma Aldrich), diluted in ethanol, at 450 °C. A mesoporous TiO2 layer (18-NR-T, Dyesol) was doctor bladed on top of the compact TiO2 layer to obtain a thickness of ∼8 μm. The doctor blade process was repeated with ethanol diluted TiO2 paste to obtain desirable thicknesses of ∼12 μm and ∼15 μm. For fabricating TiO2–Au films, the plasmonic paste described above was used. Generally, due to different viscosities of the normal and plasmonic pastes, slightly thinner TiO2–Au films were obtained. The thicknesses of all the films were made more or less identical by repetition of doctor blade process using diluted pastes. In this fashion, films with thicknesses of ∼8 μm and ∼12 μm were obtained. For fabricating high efficiency standard liquid electrolyte DSCs, a scattering layer (WER2-O, Dyesol) of ∼3 μm was also coated on top of the TiO2 and plasmonic layers. Composition of electrolyte used for fabricating liquid electrolyte based dye sensitized solar cells was: 0.1 M LiI, 0.05 M I2, 0.5 M tert-butylpyridine (TBP) and 0.6 M 1-propyl-2,3-dimethyl imidazolium iodide (DMPII) in acetonitrile.

Since electrochemical impedance spectroscopy (EIS) measurements are sensitive to thickness and area of TiO2 film, the exact thicknesses of films are mentioned in Table 2. The dimensions of the deposited films were ∼1 cm × 1 cm. The films were heated up to 500 °C for 30 min. Following this step, the films were dipped in a 40 mM TiCl4 aqueous solution for 30 min. After TiCl4 treatment, the films were again annealed at 500 °C for 15 min. Thus prepared TiO2 and TiO2–Au thin films were dipped in 0.3 mM N719 dye solution in ethanol for 20 h. The films were rinsed with acetonitrile and dried in air after taking out from the dye solution. The dye sensitized films were kept at 70 °C on a hot plate and ∼20 μl of CsSnI3 solution was drop casted on the films. The solvents slowly evaporated, leaving behind dye sensitized films containing CsSnI3 in the solid form. Visually, no major difference could be observed in the films with and without CsSnI3, although the films containing CsSnI3 appeared slightly darker. Finally, a drop of CsSnI3 solution (∼10 μl) was put on the dye-sensitized films and a platinum coated ITO substrate was clamped to complete the sandwich DSSC structure. Thus, a total of 30 μl CsSnI3 as an electrolyte solution was used for ∼1 cm2 dye-sensitized TiO2 film.

Instruments

X-ray diffraction (XRD) pattern of powder CsSnI3 sample was obtained by Rigaku Ultima IV XRD system in a 2θ range of 20°–50° using Cu-Kα radiation (λ = 1.54 Å). Energy dispersive X-ray (EDX) analysis of two CsSnI3 samples prepared in different batches was carried out using two different instruments. Zeiss EVO50 scanning electron microscope (SEM) equipped with EDX detector, and Hitachi TM3000 table-top SEM with SwiftED 3000 EDX detector were used for the measurements. The transmittance, reflectance and extinction spectra of films and GNP solution were recorded using UV-Vis-NIR spectrophotometer (Lambda 1050, Perkin Elmer). SEM image of TiO2 film was recorded at a voltage of 20 kV by Zeiss EVO50 electron microscope. Transmission electron micrograph (TEM) of GNPs was recorded at an acceleration voltage of 300 kV by Tecnai G2 F30 electron microscope. Thickness of all the deposited films was measured using Dektak XT surface profiler (Bruker).

Current density versus voltage graphs were obtained using Keithley 2440 source-meter under AM1.5G illumination (100 mW cm−2) provided by a class AAA solar simulator (Oriel Sol3A, Newport). A calibrated silicon solar cell (NREL certified) was used as a reference. The incident photon to current conversion efficiency (IPCE) spectra were recorded by SpeQuest quantum efficiency measurement system (ReRa Solutions, The Netherlands) at an interval of 10 nm in the wavelength range 400–800 nm. The incident monochromatic light was chopped at a frequency of 20 Hz and a bias light of 0.1 Sun was provided during measurements.

Electrochemical impedance spectra (EIS) were recorded by Zahner Zennium (Germany) electrochemical workstation. An AC sinusoidal signal of 10 mV was employed for the measurements. Frequency range was set from 0.1 Hz to 1 MHz and the measurements were performed under AM1.5G illumination (100 mW cm−2) provided by a 150 W solar simulator (Sciencetech Inc., Canada).

Results and discussion

The XRD pattern of powder CsSnI3 sample is shown in Fig. 1a. The peaks correspond to the orthorhombic B-γ-CsSnI3 and some of them match well with the reported literature.6,7 In Fig. 1a, some peaks have not been assigned any hkl index and are most likely due to Cs2SnI6 phase. The EDX analysis of two CsSnI3 samples prepared in different batches and tested using two different instruments (see Experimental details) showed the presence of cesium, tin, iodine, oxygen and carbon in the sample (see Fig. S2a and S2b). The Cs[thin space (1/6-em)]:[thin space (1/6-em)]Sn weight ratios for samples 1 and 2 are 1[thin space (1/6-em)]:[thin space (1/6-em)]2.64 and 1[thin space (1/6-em)]:[thin space (1/6-em)]2.41, respectively. Based on the analysis of the two samples it can be said that the weight percentage of iodine is relatively more than the other two elements. These results suggest that the solution synthesized samples of perovskite CsSnI3 have relatively higher number of Cs vacancies compared to Sn or I vacancies. These Cs vacancies give rise to the p-type behavior of the perovskite material.7 Although, the earlier study on CsSnI3 reports that the defect formation energy of Sn vacancies (VSn) is lower than the Cs vacancies (VCs),7 our EDX analysis suggests that the solution synthesized CsSnI3 is relatively poorer in Cs indicating that VCs is the major p-type carrier source. The exact reason for this behavior is not properly understood at this time. Apart from Cs, Sn and I, the EDX spectra also show presence of oxygen and carbon. The oxygen presence in both the samples is quite significant and is most probably due to moisture in the tested samples. Carbon signature in EDX spectra is due to the carbon tape used to stick samples on the SEM substrate holder.
image file: c4ra09719j-f1.tif
Fig. 1 (a) X-ray diffraction pattern of perovskite CsSnI3 B-γ phase synthesized by one-pot solution route. (b) Diffused reflectance spectra of CsSnI3 film on glass substrate. (c) Band gap calculated from absorption graph obtained from diffused reflectance data by Kubelka–Munk relation.

Fig. 1b shows the diffused reflectance spectrum of CsSnI3 film on glass slide. The band gap of CsSnI3 has been calculated using the Kubelka–Munk relation and is shown in Fig. 1c.7 The band gap of solution synthesized CsSnI3 is ∼1.1 eV which is slightly less than that of melt-synthesized CsSnI3.4,7 This might be because of some subtle changes occurring in the band structure due to the presence of Cs vacancies instead of Sn in the solution synthesized CsSnI3.

It was earlier suggested that high-vacuum, high-temperature, melt-synthesis is essential to obtain pure B-γ-CsSnI3 phase, which is soluble in mixed polar solvents.7 However, the work of Zhou et al. and our present work demonstrate that it is indeed possible to have a facile low-temperature process to synthesize the B-γ phase of perovskite CsSnI3. The black colored CsSnI3 powder obtained via solution synthesis was dissolved in a mixed polar solvent consisting of acetonitrile and N,N-DMF. As shown in Fig. 2, the solution was transparent and yellow in color and showed no signs of suspended particles. This solution is injected into the mesoporous TiO2 film and penetrates inside the pores of the film. Upon heating, the solvents slowly evaporate and the perovskite CsSnI3 crystallizes as a solid phase. The use of this material as a solid state electrolyte in DSCs is described later.


image file: c4ra09719j-f2.tif
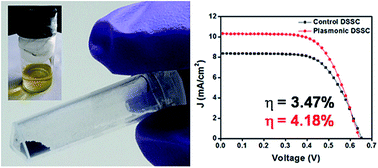
Fig. 2 Digital photograph of black colored CsSnI3 powder synthesized via one-pot solution route. Inset shows the yellow transparent solution obtained upon dissolving the powder in a mixture of acetonitrile and N,N-dimethylformamide.

Optical properties of TiO2 and TiO2–Au films

The absorptance spectra of TiO2 and TiO2–Au films calculated from the total transmittance and the total reflectance spectra are shown in Fig. 3. The film fabricated using commercial titania paste (18-NR-T, Dyesol) exhibits absorptance values less than 10% in 400–800 nm wavelength region, indicating that it is virtually transparent to visible light. The plasmonic film (TiO2–Au film) containing 0.3 wt% Au NPs (average size ∼18 nm) shows enhanced absorption in the visible region with a broad peak around 550 nm. The absorptance of dye-sensitized films is also shown in Fig. 3 as an inset. The absorptance of TiO2–Au dye-sensitized films is more than that of TiO2 film, implying that Au NPs present in TiO2 film are helping in trapping more light. The size of GNPs used in the present study is ∼18 nm, which is comparable to that of TiO2 NPs (average size is ∼20 nm). This ensures that the effective surface area of TiO2–Au film is not reduced in comparison to the bare TiO2 film, and the dye loading remains almost same for both the films. In literature, small sized metal NPs (diameter < 50 nm) have generally been preferred over larger NPs. The small NPs have been shown to enhance the photocurrent of DSCs by a significant amount.8–11
image file: c4ra09719j-f3.tif
Fig. 3 Absorptance spectra of un-sensitized TiO2 and TiO2–Au films, inset of figure shows the dye-sensitized TiO2 and TiO2–Au films.

Solid-state plasmonic dye sensitized solar cells

After establishing the fact that plasmonic TiO2 film absorbs more incident light than the bare TiO2 film, ss-DSCs were fabricated using normal TiO2 and TiO2–Au films on FTO substrates. Different thicknesses (∼8 μm, ∼12 μm, and ∼15 μm) of Au–TiO2 films, and three different weight ratios (0.1, 0.3 and 0.7 wt%) of Au–TiO2 films were experimented upon to optimize the thickness of films and concentration of GNPs in films, in order to get maximum photocurrent enhancement (see Table 1). For this purpose, initially ss-DSCs with ∼8 μm film thickness having Au–TiO2 weight ratios of 0.1, 0.3 and 0.7 wt% were fabricated (see Fig. 4). The area of all the devices was 1 cm2. Fig. 5a shows the current density–voltage (JV) curves of the best control ss-DSC and plasmonic ss-DSC. All the device photovoltaic parameters and percentage of enhancement in photocurrent are presented in Table 1. The cell fabricated with an Au–TiO2 weight ratio of 0.3% (DSC3) provides the maximum photocurrent enhancement of ∼29%. Higher concentrations of GNPs are not beneficial for DSCs, because the parasitic absorption becomes dominant in such cases.
Table 1 Photovoltaic parameters of solid state control and plasmonic dye sensitized solar cells of various configurations. Enhancements in photocurrent for plasmonic devices are also tabulated
Device Device-ID Jsc (mA cm−2) Voc (mV) FF (%) Efficiency (%) % enhancement in photocurrent
Control ss-DSC8 micron DSC1 6.16 673 48.7 2.02
Plasmonic ss-DSC8 micron (0.1 wt% Au–TiO2) DSC2 6.52 673 49.5 2.17 5.84
Plasmonic ss-DSC8 micron (0.3 wt% Au–TiO2) DSC3 8 681 42.7 2.33 29.8
Plasmonic ss-DSC8 micron (0.7 wt% Au–TiO2) DSC4 7.15 674 42 2.03 16.07
Control ss-DSC12 micron DSC5 8.36 654 63.4 3.47
Plasmonic ss-DSC12 micron (0.3 wt% Au–TiO2) DSC6 10.32 642 63 4.18 23.44
ss-DSC15 micron DSC7 6.93 650 64 2.88
ss-DSC12 + 3 micron DSC8 3.5 665 56.8 1.32


image file: c4ra09719j-f4.tif
Fig. 4 Current density–voltage curves of control and plasmonic solid state DSCs showing the effect of variation of Au–TiO2 weight ratio. An Au–TiO2 film thickness of 8 μm is used for all the devices.

image file: c4ra09719j-f5.tif
Fig. 5 Current density–voltage and IPCE curves of best control and plasmonic solid state DSCs prepared using TiO2 and Au (0.3 wt%)–TiO2 film thicknesses of 12 μm.

Device having Au–TiO2 film thickness of ∼12 μm gave the highest efficiency of 4.18%, compared to the same device without Au NPs having efficiency of 3.47%, which is the optimized TiO2 thickness for ss-DSCs. A mesoporous TiO2 film thickness greater than 12 μm resulted in a decrease in efficiency (DSC7). Even the use of scattering layer consisting of larger TiO2 particles resulted in a significantly lower efficiency of the device (DSC8). There is a need for detailed understanding of this observation. The solvent used for dissolving CsSnI3 is a mixture of acetonitrile and N,N-DMF and is more viscous than just acetonitrile alone, which is typically used as a solvent for making liquid electrolyte. This relatively viscous solution is prevented from reaching the underlying mesoporous layer by the less porous scattering layer and as such the electrolyte is unable to fill the complete volume of the film. Consequently, the efficiency of ss-DSC employing scattering layer or having large thickness (>12 μm) gets deteriorated. It implies that a less porous layer, like scattering layer consisting of 400 nm TiO2 particles, cannot be used for ss-DSCs based on perovskite CsSnI3 HTM. Due to this reason the typical two layer structure (nano TiO2 + scattering layer) has not been employed for ss-DSCs based on CsSnI3 in the earlier study by Chung et al.,4 and the present work. Chung et al. employed a photonic crystal layer to increase the light trapping and here we make use of near-field effects of GNPs for absorption enhancement. The ss-DSC offers an interesting platform to test the plasmonic effects as the thickness of the device cannot be increased beyond a certain limit.

The best control ss-DSC delivers an efficiency of ∼3.5% (DSC5), which is nearly the same as the ∼3.7% efficiency obtained by Chung et al. using CsSnI3 synthesized by high temperature method.4 This gives credence to our claim that the solution processed B-γ-CsSnI3 performs as well as the high temperature processed CsSnI3. The plasmonic ss-DSC gave an efficiency of ∼4.2% which is the highest efficiency of ss-DSC based on CsSnI3 hole transporter (we have not done any fluorine doping as reported by Chung et al.).

The IPCE spectrum (Fig. 5b) of plasmonic ss-DSC (DSC6) shows enhancement throughout the measurement region (350–800 nm) compared to control ss-DSC (DSC5). This enhancement correlates well with the enhanced absorption of dye-sensitized TiO2–Au film shown in Fig. 3. The GNPs function like light harvesting antennae for dye molecules adsorbed on TiO2 NPs. The conduction electrons of GNPs resonate with the incident light radiation resulting in optical near-fields which are localized around the GNPs. The excitations of dye molecules under the influence of near-fields are more efficient and hence the photocurrent gets enhanced. The plasmonic ss-DSC (DSC6) shows a photocurrent enhancement of 1.96 mA cm−2 compared to control ss-DSC (DSC5) as seen from JV curves (see Fig. 5 and Table 1). The photocurrents of the devices were also calculated by integrating the IPCE spectra using Photor software (ReRa Solutions, The Netherlands) and the difference obtained was 1.7 mA cm−2. The small difference in the two values could be due to non-accounting of light below 350 nm in IPCE measurements.

Fig. 6 shows the normalized IPCE spectra of liquid electrolyte DSC and ss-DSC. The presence of perovskite CsSnI3 results in a red-shift of the peak of IPCE spectrum in ss-DSC. The ss-DSC also harvests more photons in the red region (600–750 nm). This observation indicates that the increased red absorption can be attributed to the red-shifting of absorption edge in ss-DSC due to CsSnI3 which has a band gap of ∼1.3 eV. Our results are consistent with the enhanced red absorption reported in the earlier work on CsSnI3 based ss-DSC.4


image file: c4ra09719j-f6.tif
Fig. 6 Normalized IPCE spectra of liquid electrolyte based and CsSnI3 based DSCs. The thickness of the TiO2 layer is 12 μm for both the devices.

Electrochemical impedance spectroscopy (EIS) analysis

Impedance spectroscopy is a useful technique for studying electron transport and charge recombination in DSCs. For analyzing the EIS data, we have used the general approach adopted by Kern et al. and also the methods followed by Chung et al. for CsSnI3 ss-DSCs.4,12 Our main aim for performing EIS analysis is to find out the differences between a standard liquid electrolyte DSC and ss-DSC based on perovskite HTM and the effect of GNPs on electron transport and recombination process in plasmonic ss-DSCs.

The typical Nyquist plot of a DSC has three semi-circles or arcs: (1) the high frequency arc (first arc towards the left in Nyquist plot) corresponding to the counter electrode–electrolyte interface, (2) mid-frequency arc corresponding to the TiO2–dye–electrolyte interface and (3) low-frequency arc pertaining to the diffusion of ions in the electrolyte in TiO2.13 Fig. 7a shows the Nyquist plot obtained for a ∼7.4% efficient DSC based on liquid electrolyte (the plot with filled triangles). Generally, the high and low frequency arcs are not easily distinguishable in high efficiency liquid electrolyte DSCs (see Fig. 7a) and appear as deformations of the main central arc.13 This is because the catalytic activity of platinum counter electrode is high and only a very small resistance is observed at Pt–electrolyte interface (high-frequency arc towards the left). Also, the liquid electrolyte has relatively high diffusion constant and the contributions from diffusion occur at very low frequency (low-frequency deformed arc towards the right) such that it is difficult to observe the corresponding arc in high efficiency DSCs. The effective electron lifetimes can be calculated using the relation τeff = 1/(2πfm), where fm is the frequency corresponding to the peak phase in the mid-frequency region (1–100 Hz) of the Bode plot.12


image file: c4ra09719j-f7.tif
Fig. 7 (a) Nyquist and (b) Bode plots of control and plasmonic solid state DSC with CsSnI3 as the hole transport material and standard liquid electrolyte DSC.

Nyquist plots for standard DSC (device DSC9, filled triangles), control ss-DSC (device DSC10, filled squares) and plasmonic ss-DSC (device DSC11, filled circles) are shown in Fig. 7a. The EIS and photovoltaic parameters of three devices are presented in Table 2. The device DSC9 shows a total resistance (Rtot) of about 17 ohms while the device DSC10 has Rtot of 30 ohms. The low-frequency and high-frequency arcs of DSC10 and DSC11 are large compared to that of DSC9. This indicates higher impedance at platinum–electrolyte interface and slow diffusion of holes in solid state electrolyte in the TiO2 film. This is to be expected since we are using a solid state HTM and the corresponding impedances at various interfaces are higher than that for a liquid electrolyte, which can support fast reactions and diffusion of ions while the solid state HTM cannot. Due to this reason, the effective electron lifetime of device DSC10 (3.26 ms) is also lower than that of DSC9 (4.43 ms). The photoanode resistance or charge transfer resistance (RTiO2) is the resistance offered to the injection of electrons from excited dye molecules to TiO2 and also to the back recombination of electrons from TiO2 with holes in the electrolyte. This resistance is given by the diameter of the central arc of the Nyquist plot. The RTiO2 of cell DSC9 is about 3.5 ohms while that of cell DSC10 is 8 ohms. Thus, CsSnI3 based ss-DSCs has a higher resistance for charge transfer from dye to TiO2 compared to standard liquid electrolyte DSC. This is one of the reasons that ss-DSCs have lower photocurrent than liquid electrolyte DSCs. On the other hand, the increased RTiO2 also means an increase in resistance for the back recombination of electrons with holes in the electrolyte; therefore, the effective electron lifetime is not affected significantly compared to that of standard DSC (see Table 2). Except for the photocurrent, all other photovoltaic parameters (open circuit voltage and fill factor) of ss-DSC are comparable to those of standard DSC which demonstrate the suitability of perovskite CsSnI3 as a solid state HTM for DSCs.

Table 2 Electrochemical impedance spectroscopy (EIS) analysis and current density–voltage (JV) characteristics of control and plasmonic solid state dye sensitized solar cells. The EIS measurements were performed at open circuit voltage under AM1.5G illumination provided by a solar simulator
Device-ID Physical parameters of device EIS analysis JV characteristics
Film thickness (μm) Area (cm2) Rtotal (Ω) RTiO2 (Ω) Frequency of the central peak of Bode plot (Hz) Electron lifetime (ms) Jsc (mA cm−2) Voc (mV) FF (%) η (%)
Standard DSC (DSC9) 12 + 3 1 17 3.5 35.90 4.43 16 710 65 7.38
Control ss-DSC (DSC10) 11.5 1 30 8 48.89 3.26 8.21 655 64 3.44
Plasmonic (0.3 wt% Au–TiO2) ss-DSC (DSC11) 12.1 1 24 5 25.96 6.13 10.20 644 62.5 4.11


Plasmonic ss-DSC (device DSC11) shows a Rtot of 24 ohms, which is less than that of device DSC10 (30 ohms). The charge transfer resistance (RTiO2) of plasmonic device is 5 ohms compared to the 8 ohms shown by DSC10. The introduction of GNPs enhances the photocurrent due to near-field effects and reduces RTiO2 and Rtot leading to more efficient electron injection and transport. The resulting effective electron lifetime is 6.13 ms owing to these factors. Surprisingly, this value of electron lifetime is even greater than that of liquid electrolyte DSC. This is an interesting result and we try to explain it in the following discussion. In addition to the decrease in impedances, as mentioned above, other processes are also responsible for this enhancement of electron lifetimes. With the introduction of metal NPs, the photocurrent is enhanced due to optical near-field effects; so, there are additional electrons available compared to the normal device. These additional electrons fill up some of the trap sites in TiO2 so, the number of available trap states might have reduced, which can lead to the reduced recombination process. As a consequence of reduced recombination rate, the effective electron lifetime is enhanced in the case of plasmonic ss-DSC. But this point alone does not explain the increased lifetime of DSC11 because DSC9 has a higher current density. In the present case, the device DSC11 has a higher RTiO2 (5 ohms) than device DSC9 (3.5 ohms). The difference is not very significant, but it ensures that the charge injection from dye to TiO2 is adequately efficient but simultaneously it is sufficiently high to prevent back recombination of electrons in TiO2 with holes in the solid state electrolyte. Thus, a combination of all the involved processes ultimately results in an increase of electron lifetime for plasmonic ss-DSC. In some earlier studies also, the researchers have observed enhanced electron lifetimes for liquid electrolyte based plasmonic DSCs, compared to the normal DSCs.8,14 We would like to stress here that our discussion is based on the EIS results only, and the differences in electron lifetimes of the three devices (DSC9, DSC10 and DSC11) are not very significant. So, it can be concluded that CsSnI3 supports a similar electron lifetime as that supported by the liquid electrolyte.

So far, we have discussed the EIS results of CsSnI3 based DSCs with liquid electrolyte based DSCs only. A comparison with other ss-DSCs is outlined here to bring out the advantages of CsSnI3. It has been shown earlier that transport mechanism of electrons in TiO2 in DSCs under dark conditions remains unchanged, irrespective of the medium of hole transport.2,19 However, under illumination, the diffusion length and recombination time of spiro-OMeTAD based ss-DSCs are limited by a high transfer rate at TiO2–spiro interface.2 These ss-DSCs also have relatively low fill factors because of large transport resistance offered by spiro-OMeTAD. The CsSnI3 based ss-DSCs have fill factors comparable to those of standard liquid electrolyte based DSCs and recombination rate is also comparable as seen from the effective electron lifetime values (see Tables 1 and 2). These results imply that CsSnI3 is a better HTM than spiro-OMeTAD. Also, thick TiO2 films (∼10–12 μm) cannot be used with HTMs like spiro and CuSCN due to their poor penetration into the mesoporous film. Thicker films used for ss-DSCs generally increase the photovoltage due to high recombination resistance and decrease the photocurrent due to high internal resistance offered to electron transport.2,19 Thus, the thickness of ss-DSC has to be adjusted to get optimum photocurrent and photovoltage. This problem is not present in CsSnI3 based ss-DSCs since the HTM solution can penetrate deep into the TiO2 film, allowing the use of thicker films (∼12 μm) and common synthetic dyes (N719, N749 etc.).

The perovskite CsSnI3 has received very less attention as a photovoltaic material, although it has been demonstrated to be solution processable and works well as an HTM in DSCs. We have fabricated efficient ss-DSCs based on this material and shown that advanced concepts of nano-photonics like plasmonics can also be employed for improving the performance of this type of ss-DSCs. Solid-state DSCs were the primary and main inspiration for the modern perovskite solar cells (PSCs) which are essentially an extension of the ss-DSC concept.15,16 Modern photonics approaches like plasmonics and down-shifting have already been demonstrated for these PSCs which employ spiro-OMeTAD as the HTM.17,18 Our next objective is to integrate CsSnI3 with the existing perovskite solar cells in order to fabricate all/full perovskite solar cells (APSC/FPSC) with CsSnI3 functioning as the HTM. Since CsSnI3 has been proven to be better than spiro-OMeTAD as an HTM,4 it is logical to aim for an APSC and a good performance can be expected from these devices.

Conclusions

We have successfully fabricated ss-DSCs based on solution synthesized perovskite CsSnI3 as the hole transport material. The ss-DSCs display good efficiency and the electron lifetime is comparable to that of liquid electrolyte based DSCs. Plasmonic ss-DSCs fabricated using an Au–TiO2 weight ratio of 0.3 wt% showed ∼23% enhancement in photocurrent and ∼20% enhancement in overall energy conversion efficiency. Plasmonic ss-DSC demonstrated increased electron lifetime compared to the control ss-DSC due to decrease in charge transfer and electron transport resistance.

Acknowledgements

Authors would like to thank the Nanoscale Research Facility (NRF) of IIT Delhi for impedance spectroscopy measurements. P.S.C. would like to acknowledge financial support from Department of Science & Technology, Government of India under DST INSPIRE fellowships (IF120755).

Notes and references

  1. A. Hagfeldt, G. Boschloo, L. Sun, L. Kloo and H. Pettersson, Chem. Rev., 2010, 110, 6595–6663 CrossRef CAS PubMed.
  2. F. Fabregat-Santiago, J. Bisquert, L. Cevey, P. Chen, M. Wang, S. M. Zakeeruddin and M. Gratzel, J. Am. Chem. Soc., 2009, 131, 558 CrossRef CAS PubMed.
  3. N. Cai, S. J. Moon, L. Cevey-Ha, T. Moehl, R. Humphry-Baker, P. Wang, S. M. Zakeeruddin and M. Gratzel, Nano Lett., 2011, 11, 1452 CrossRef CAS PubMed.
  4. I. Chung, B. Lee, J. He, R. P. H. Chang and M. G. Kanatzidis, Nature, 2012, 485, 486 CrossRef CAS PubMed.
  5. Z. Chen, J. J. Wang, Y. Ren, C. Yu and K. Shum, Appl. Phys. Lett., 2012, 101, 093901 CrossRef PubMed.
  6. Y. Zhou, H. F. Garces, B. S. Senturk, A. L. Ortiz and N. P. Padture, Mater. Lett., 2013, 110, 127 CrossRef CAS PubMed.
  7. I. Chung, J. H. Song, J. Im, J. Androulakis, C. D. Malliakas, H. Li, A. J. Freeman, J. T. Kenney and M. G. Kanatzidis, J. Am. Chem. Soc., 2012, 134, 8579 CrossRef CAS PubMed.
  8. Y. Li, H. Wang, Q. Feng, G. Zhou and Z. S. Wang, Energy Environ. Sci., 2013, 6, 2156 CAS.
  9. N. Chander, P. Singh, A. F. Khan, V. Dutta and V. K. Komarala, Thin Solid Films, 2014, 568, 74 CrossRef CAS PubMed.
  10. N. Chander, A. F. Khan, E. Thouti, S. K. Sardana, P. S. Chandrasekhar, V. Dutta and V. K. Komarala, Sol. Energy, 2014, 109, 11 CrossRef CAS PubMed.
  11. X. Dang, J. Qi, M. T. Klug, P. Y. Chen, D. S. Yun, N. X. Fang, P. T. Hammond and A. M. Belcher, Nano Lett., 2013, 13, 637 CrossRef CAS PubMed.
  12. R. Kern, R. Sastrawan, J. Ferber, R. Stangl and J. Luther, Electrochim. Acta, 2002, 47, 4213 CrossRef CAS.
  13. Dye-sensitized solar cells, ed. K. Kalyansundaram, EPFL Press, Lausanne (Switzerland), ch. 12, 2010 Search PubMed.
  14. R. A. Naphade, M. Tathavadekar, J. P. Jog, S. Agarkar and S. Ogale, J. Mater. Chem. A, 2014, 2, 975 CAS.
  15. P. Gao, M. Gratzel and M. K. Nazeeruddin, Energy Environ. Sci., 2014, 7, 2448 CAS.
  16. M. A. Green, A. Ho-Baillie and H. J. Snaith, Nat. Photonics, 2014, 8, 506 CrossRef CAS.
  17. W. Zhang, M. Saliba, S. D. Stranks, Y. Sun, X. Shi, U. Wiesner and H. J. Snaith, Nano Lett., 2013, 13, 4505 CrossRef CAS PubMed.
  18. N. Chander, A. F. Khan, P. S. Chandrasekhar, E. Thouti, S. K. Swami, V. Dutta and V. K. Komarala, Appl. Phys. Lett., 2014, 105, 033904 CrossRef PubMed.
  19. I. Mora Sero, S. Gimenez, F. Fabregat-Santiago, E. Azaceta, R. Tena-Zaera and J. Bisquert, Phys. Chem. Chem. Phys., 2011, 13, 7162 RSC.

Footnote

Electronic supplementary information (ESI) available: EDX spectra of perovskite material TEM of gold nanoparticles. See DOI: 10.1039/c4ra09719j

This journal is © The Royal Society of Chemistry 2014
Click here to see how this site uses Cookies. View our privacy policy here.