Self-nanoemulsifying drug delivery systems (SNEDDS) for oral delivery of arteether: pharmacokinetics, toxicity and antimalarial activity in mice

Pankaj Dwivediae, Renuka Khatika, Kiran Khandelwala, Richa Srivastavaa, Isha Tanejab, Kanumuri Siva Rama Rajub, Hemlata Dwivedid, Prashant Shuklaa, Pramod Guptaa, Sarika Singhc, Renu Tripathid, Sarvesh Kumar Paliwale, Wahajuddinb, Anil Kumar Dwivedia and Prabhat Ranjan Mishra*a
aPharmaceutics Division, Central Drug Research Institute, Lucknow 226031, India. E-mail: mishrapr@hotmail.com; dwivedipank@gmail.com; Tel: +91 9415753171, +91 9305141751
bPharmacokinetics and Metabolism Division, Central Drug Research Institute, Lucknow 226031, India
cToxicology Division, Central Drug Research Institute, Lucknow 226031, India
dParasitology Division, Central Drug Research Institute, Lucknow 226031, India
eBanasthali Vidyapeeth, Banasthali, Rajasthan 304022, India

Received 2nd September 2014 , Accepted 5th November 2014

First published on 6th November 2014


Abstract

The aim of the study was to develop oral arteether (AE) nano formulations, to investigate their effects in rats, and for the complete and effective treatment of Plasmodium yoelii nigeriensis infected mice at a reduced dose by increasing the relative bioavailability. Nano-formulations of arteether have been developed. The relative bioavailability (RB%) was assessed by calculating individual Area under curve (AUC) AUC0–t, AUC0–∞ and Cmax values. Haematological and biochemical parameters were estimated in rats and sections of brain and peripheral organs were analyzed for histopathological changes. The formulations were tested for antimalarial efficacy and safety in Plasmodium yoelii nigeriensis infected swiss mice. The AUC for lipid formulations (AUC0–t 4.98 ± 0.79 h μg ml−1) and AUC0–∞ (5.02 ± 0.80 h μg ml−1) was significantly higher (p < 0.05) than for AE in ground nut oil (GNO) and AE in aqueous suspension. The Cmax was also significantly higher for all the formulations. The RB% has been found to be significantly higher (257%) in the formulations than for AE in GNO. No considerable changes have been monitored in the serum biochemical parameters of rats. These formulations have been found to be highly effective for the treatment of Plasmodium yoelii nigeriensis infected swiss mice, even at the lower dose of 12.5 mg kg−1 × 5 days. Overall the developed formulations are safe, provide a non-toxic platform for further clinical studies, and can be used in artemisinin-based combination therapies (ACTs).
1. Introduction

Malaria is a major health problem in tropical and subtropical countries, almost 106 countries are seriously affected by it and it is associated with morbidity and mortality even in the twenty first century. According to the WHO world malaria report 2013, more than six hundred thousand people die every year due to malaria including a large number of children, which means almost 1300 lives are lost per day due to malaria. Although the mortality figure has fallen over the last few years, it’s still a huge number.1 Malaria is caused by Plasmodium species, of which the most life threatening is Plasmodium falciparum. The prevalence of malaria is still a high risk due to the rise in the development of resistant parasites, a poor rate of discovery of antiparasitic compounds and the high cost of antimalarial drugs.2 There is a requirement for new antimalarial drugs, or to fully exploit the use of existing drugs. Mass-drug-administration has recently been proposed as an option for malaria chemotherapy as it has rolled back the burden of other horrific parasitic diseases (e.g. river blindness, lymphatic filariasis, trachoma).3 In 2012, the WHO recommended seasonal malaria chemoprevention with a combination of sulfadoxine-pyrimethamine and amodiaquine (SP + AQ) for children aged between 3 and 59 months in areas of high seasonal malaria transmission across the Sahel sub-region. Artemisinin is a sesquiterpene lactone which is isolated from the plant Artemesia annua L. The derivatives of this artemisinin are now widely used to cure complex malaria. Artemisinin derivatives including dihydroartemisinin, artesunate, artemether and AE are the keystones of the treatment for Plasmodium falciparum malaria due to their high potency and rapid action. AE is an ethyl ether derivative of dihydroartemisinin, which is a dihydro derivative of artemisinin and is one of the most promising candidates for curing malaria. We have chosen AE as our candidate drug as it is developed by our institute (Central Drug Research Institute, India), and is a potential alternative to quinine, because of the drug resistance and safety issues seen with quinine. It may also be more effective than other artemisinin derivatives because of its oil solubility, longer half life, and increased chemical stability.4 AE contains a stable endoperoxide bridge, this bridge is proposed to be responsible for its antimalarial activity. AE also possesses gametocytocidal properties through inhibiting parasite transmission.5–7 It is particularly effective against Plasmodium falciparum malaria parasites that are resistant to conventional antimalarial drugs.7–9 Artemisinin partial resistance has been documented in Plasmodium falciparum malaria in the region of Southeast Asia i.e. in Cambodia, Thailand, Myanmar, and Vietnam.10–13 To overcome this resistance, treatments with artemisinin compounds are usually associated with other conventional drugs.14 Artemisinin-based combination therapies (ACTs) are recommended by the WHO as the first-line treatment for uncomplicated Plasmodium falciparum malaria as it is believed and has been proven that drugs with different modes of action can reduce the risk of resistant parasites emerging when combined together, but still their widespread use for treating patients with Plasmodium falciparum malaria raises the question of emerging drug resistance. In a combination, the role of the artemisinin compound is to reduce the main parasite load during the first three days of treatment, while the role of the partner drug is to eliminate the remaining parasites.15 Self nanoemulsifying drug delivery systems (SNEDDS) are isotropic mixtures of lipid/oil, surfactant and drug substances that rapidly form a fine oil-in-water micro emulsion, providing a large surface area for increased absorption, when exposed to aqueous media under conditions of gentle agitation or digestive motility that would be encountered in the gastrointestinal tract.16,17 SNEDDS are considered as an interesting approach because of their high drug solubilizing capacity and the enhancement in both the rate and extent of absorption by lymphatic uptake.18–21 Moreover, it is possible to form blends comprised several excipients: which can be pure triglyceride (TG) oils, or blends of different TG, diglyceride (DG) and monoglyceride (MG) oils, or blends of different TG, DG and MG. In addition different types of surfactants (lipophilic and hydrophilic) can be added as co-solvents.22 The oral administration of lipophilic drugs presents a major challenge because of their low aqueous solubility. Orally administrated SNEDDS widen the accessibility of lipidic excipients with particular characteristics to offer flexibility of function with respect to improving the bioavailability of poorly water-soluble drugs by manipulating their release profiles and protecting them from enzymatic and/or chemical hydrolysis while facilitating their passage in the gastrointestinal tract until their intestinal absorption.23 They can be simply manufactured using hot or cold mixing, at low cost, which is of special interest to developing countries. Moreover these liquid SNEDDS can be converted into solid SNEDDS, there are several reports in which the liquid SNEDDS have been successfully formulated to solid SNEDDS by using Aerosil 200,24 mannitol and sucrose monopalmitate,25 calcium silicate, magnesium aluminum silicate and silicon dioxide26 by a spray drying method and can be formulated into tablets, capsules or pellets which are easy to dispense.

AE is associated with several shortcomings: poor aqueous solubility, and low oral bioavailability.4 To overcome the problems associated with artemisinins; several formulations have been proposed such as conventional and long circulating liposomes, alone and in combination with curcumin, which were found to be effective against malaria infected mice.27,28 Solid lipid nanoparticles of AE have also been formulated which result in improved oral bioavailability.29 SNEDDS30 can also be another approach to develop an oral formulation of AE which can overcome its limitations. A combination therapy with a sub-therapeutic dose of β-arteether and curcumin has been formulated as a lipid based drug delivery system as a promising approach for the treatment of malaria.31

In the present investigation, we have developed SNEDDS of AE which have been found to increase the bioavailability and were found to be effective against malaria infected mice at a low dose of AE and with improved bio-availability. In the future, these SNEDDS can be converted into solid SNEDDS and can also be combined with other conventional antimalarial drugs for effective combination therapy in malaria treatment.

2. Results

2.1. Solubility study and its compatibility

The SNEDDS consisted of oil, surfactants and AE, which should be a clear and monophasic liquid at ambient temperature when introduced to the aqueous phase and should have good solvent properties to allow the presentation of the AE in solution. All the vehicles showed good solubility of AE (Table 1). Among the tested vehicles in this study, Labrafac, Lauroglycol and GNO were selected because they showed the maximum solubility for AE, and GNO was also reported for its enhanced absorption of AE. Moreover, these vehicles have great miscibility with surfactant mixtures and form a spontaneous emulsion with a smaller than average diameter of globules when they come in contact with the aqueous phase, forming a clear solution. Labrasol was excluded for the preparation of SNEDDS as it was found to be poorly miscible with other surfactants. Thus, Labrafac, Lauroglycol and GNO were selected as oily vehicles due to their good AE solubility and good emulsion-forming ability for preparing an optimal SNEDDS formulation, resulting in the improvement of AE loading and in the spontaneous formation of a fine emulsion.
Table 1 Solubility of AE in various excipients
Vehicle Composition Solubility of AE (mg ml−1) mean
Lauroglycol 90 Propylene glycol laurate 438 ± 43.8
Labrafac PG Propylene glycol dicaprylate/dicaprate 412 ± 34
Labrasol Caprylocaproyl polyoxylate glycerides 225 ± 28
GNO Triglycerides of long chain fatty acids 100 ± 12.6
Soybean oil Triglycerides of long chain fatty acids 80 ± 17
Sesame oil Poly unsaturated fatty acids 75 ± 22


The vehicles and the excipients have been evaluated for their compatibility with AE, which was found to be acceptable (Table 2).

Table 2 Drug–excipients compatibility study
Drug + excipients Parameters Conditions Comments
RT40 °C ± 2 °C/75% ± 5% RH
AE + Lauroglycol 90 Proper miscibility No change in AE Compatible
AE + Labrafac PG Proper miscibility No change in AE Compatible
AE + GNO Proper miscibility No change in AE Compatible
AE + Cremephore EL Proper miscibility No change in AE Compatible
AE + Tween 80 Proper miscibility No change in AE Compatible
AE + Span 80 Proper miscibility No change in AE Compatible


2.2. Construction of pseudo-ternary phase diagrams

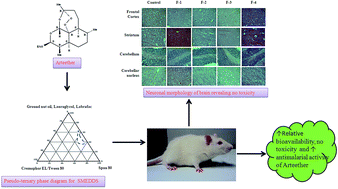
A series of SNEDDS were prepared and their self-emulsifying properties were observed visually when they came into contact with the aqueous phase. It has been reported that the drug incorporated in the SNEDDS might have some effect on the self-emulsifying performance. Thus, pseudo-ternary phase diagrams were constructed in the presence of AE to identify the self-emulsifying regions with maximum drug loading and to optimize the concentration of oil and surfactant in the SNEDDS. Labrafac and Lauroglycol showed a significantly high amount of AE incorporation due to the high solubility of AE in them. The phase diagram of the system containing Labrafac/Lauroglycol/GNO as an oil and Cremophor EL and Span 80 as a surfactant with AE is shown in Fig. 1. It was observed that within the self-emulsifying region there was increased spontaneity of the self-emulsification process. The efficiency of emulsification was good when the surfactant concentration was more than 60% v/v of the SNEDDS formulation. It was observed that the spontaneous emulsion formation was not efficient with less than 30% v/v of surfactant in the SNEDDS.
image file: c4ra09267h-f1.tif
Fig. 1 Pseudo-ternary phase diagram: the doted section represents isotropic regions for formulations with various concentrations forming spontaneous emulsions when exposed to aqueous medium.

2.3. Development of SNEDDS

We aimed to design AE loaded SNEDDS that could self-emulsify spontaneously when in contact with physiological media. AE has been reported to have poor absorption when given as an aqueous solution, with a base line in mind that when AE is given with a fat rich diet, it has an improved absorption. Hence, lipid-based SNEDDS were designed based on the literature to enhance the solubility and thus bioavailability of AE and to obtain self-emulsifying properties with the selected excipients. SNEDDS were prepared using the phase diagram method and four preparations of SNEDDS were finalized, which gave a clear emulsion on dilution with the aqueous phase and were subjected to further studies.

2.4. Characterization of the SNEDDS

2.4.1. Effect of dilution of SNEDDS. F-1, F-2, F-3 and F-4 have been characterized by diluting them with the aqueous phase in a volumetric flask containing TDW and agitated to form a fine emulsion. The visual parameters revealed the spontaneous formation of a clear emulsion and globule size in the range of 55–160 nm. All the SNEDDS were diluted with TDW to an appropriate concentration before determining the zeta potential. Each sample was analyzed thrice (Table 4).
Table 3 Description of the composition of various SNEDDS
Composition F-1 F-2 F-3 F-4
AE (mg) 250 250 250 250
Ground nut oil (mg) 300
Labrafac (mg)   300
Lauroglycol (mg) 300 300
Cremophor EL (mg) 500 500
Tween 80 (mg) 500 500
Span 80 (mg) 200 200 200 200


Table 4 Physicochemical characterization of SNEDDSa
Formulation Zeta potential (mv) Average globule size (nm) Polydispersity
a Values are expressed as mean ± SD; (n = 3).
F-I −12.0 ± 1.6 125 ± 15.4 0.234 ± 0.05
F-II −25.3 ± 1.5 178 ± 12.6 0.189 ± 0.06
F-III −28.2 ± 2.8 224 ± 16.7 0.197 ± 0.08
F-IV −25.2 ± 2.6 268 ± 09.6 0.161 ± 0.04


The F-1, F-2, F-3 and F-4 were evaluated for their self emulsification in simulated gastrointestinal fluid. The size of the globules after dilution and AE solubility were assessed after keeping them at room temperature for 2 h in simulated gastric fluid and up to 8 h in simulated intestinal fluid. The optimized SNEDDS which were chosen for further studies had a size of approximately 80 nm and a polydispersity index (PDI) less than 0.2, indicating a homogeneous distribution of size (Table 5).

Table 5 Self emulsification of SNEDDS in simulated gastro-intestinal fluids
Formulation Gastric pH 1.2 buffer Intestinal pH 7.5 buffer Triple distilled water
Globule size (nm) PDI Globule size (nm) PDI Globule size (nm) PDI
F-1 124.12 ± 9.6 0.11 117.23 ± 7.2 0.16 118.25 ± 6.1 0.18
F-2 126.22 ± 8.4 0.09 126.73 ± 8.1 0.29 139.42 ± 4.4 0.26
F-3 128.19 ± 7.9 0.18 112.28 ± 7.9 0.14 115.44 ± 9.3 0.17
F-4 129.13 ± 8.5 0.13 118.41 ± 4.6 0.11 116.25 ± 5.2 0.15


In contrast, SNEDDS with an upper PDI of 0.5 and the globule size larger than 450 nm were rejected. The globule size of the emulsions is an important parameter for self-emulsifying systems. Indeed, it influences the speed and the quantity of released and absorbed compounds.

2.5. Cytotoxicity study

The cytotoxicity of all the SNEDDS without AE was found to be within acceptable limits when tested against Caco-2 cell lines by MTT assay. The cell viability remained >90% for all the SNEDDS against Caco-2 cell lines, indicating the safety of the excipients used. At a higher equivalent concentration of AE in F-1, F-2, F-3 and F-4 (10 μg ml−1) less than 45% cell viability was observed, whereas at a lower equivalent concentration of AE in F-1, F-2, F-3 and F-4 (5 μg ml−1) the cell viability was more than 60%. The data is shown in Fig. 2.
image file: c4ra09267h-f2.tif
Fig. 2 Cell viability% of SNEDDS at different concentrations.

2.6. In vivo studies

2.6.1. Repeated dose oral toxicity study. SNEDDS were evaluated for their toxicological effects. The dose was selected as twice the effective dose predicted in murine malaria models. Mortalities in rats have not been observed in any of the treatment or in control groups throughout the experiment. The animal feed was normal throughout the experiment with normal behavior. The increase in body weight of animals in all treatment groups was comparable to that of the control group. No adverse effects in terms of the general health of the animals have been observed upon oral administration of SNEDDS. The various hematological parameters of the treatment groups did not vary significantly from the control group (Fig. 3). These results also agreed well with the serum biochemistry profiles of the animals. The serum biochemical parameters (Fig. 4) and serum hepatic markers (Fig. 5) of the treatment groups did not vary significantly from that of the control group. The serum ALT levels of the treatment groups did not vary significantly from that of control group, in animals of either sex. This is in line with earlier reports that AE is not associated with hematological or renal adverse effects.32 AE has been previously reported to be neurotoxic when given in oily solution in comparison to AE given in aqueous form for a long period of time, so the SNEDDS were evaluated for neurotoxicity by histological examination of various neuronal regions of the brain in the control and SNEDDS groups, where no significant difference was observed from normal histology (Fig. 6). Histological examinations of liver and other organs such as kidney, spleen and stomach showed no evidence of hepatotoxicity and were indistinguishable from controls (Fig. 7).
image file: c4ra09267h-f3.tif
Fig. 3 Hematological parameters in Wistar rats.

image file: c4ra09267h-f4.tif
Fig. 4 Serum biochemistry parameters in Wistar rats.

image file: c4ra09267h-f5.tif
Fig. 5 Serum hepatic markers in Wistar rats.

image file: c4ra09267h-f6.tif
Fig. 6 Representative histological photomicrographs of various neuronal morphologies in different brain regions in control and SNEDDS groups.

image file: c4ra09267h-f7.tif
Fig. 7 Representative histological photomicrographs of various organs in control and SNEDDS groups. The various organ sections were stained with haematoxylin and eosin.
2.6.2. Pharmacokinetic studies. The data was subjected to non-compartmental analysis. The plasma concentration–time profiles of F-1, F-2, F-3 and F-4, AE in GNO and AE aqueous suspension are shown in Fig. 8. As shown in Table 6, the Cmax and AUC0–∞ for all the SNEDDS is significantly higher than the AE aqueous suspension. However, compared to the AE in GNO, a significant difference for these parameters was found for F-1 and F-3 only. The area under curve (AUC) in the case of F-1 (AUC0–t 4.98 ± 0.79 h μg ml−1 and AUC0–∞ 5.02 ± 0.80 h μg ml−1) was significantly higher (p < 0.05) than AE in GNO (AUC0–t 2.43 ± 0.6 h μg ml−1 and AUC0–∞ 2.47 ± 0.64 h μg ml−1) and the AE aqueous suspension (AUC0–t 0.046 ± 0.008 h μg ml−1 and AUC0–∞ 0.046 ± 0.007 h μg ml−1), whereas the AUC values of F-2, F-3 and F-4 were AUC0–t 3.55 ± 0.75 h μg ml−1 and AUC0–∞ 3.57 ± 0.74 h μg ml−1, AUC0–t 6.33 ± 1.21 h μg ml−1 and AUC0–∞ 6.36 ± 1.21 h μg ml−1, and AUC0–t 3.30 ± 0.51 h μg ml−1 and AUC0–∞ 3.32 ± 0.53 h μg ml−1, respectively. The t1/2 of F-1 was found to be 0.39 ± 0.14 h whereas AE in GNO has a t1/2 of 2.48 ± 0.57 h and the AE aqueous suspension has a t1/2 of 0.78 ± 0.23 h. The Cmax of F-1 (1.35 ± 0.73 μg ml−1) was also significantly higher (p < 0.05) than AE in GNO (0.58 ± 0.055 μg ml−1) and the AE aqueous suspension (0.048 ± 0.003 μg ml−1) whereas the Tmax of F-1, F-2, F-3, F-4 and AE in GNO was 1.5 ± 0.7 h, 1.51 ± 0.08 h, 2.08 ± 0.38 h, 2.53 ± 0.17 h and 0.37 ± 0.17 h, respectively. The RB% of F-1, F-2, F-3 and F-4 was found to be 203.29, 144.53, 257.49 and 133.74% higher, respectively, than AE in GNO, and when compared to AE in aqueous suspension F-1, F-2, F-3 and F-4 were 10[thin space (1/6-em)]913.04, 7760.87, 13[thin space (1/6-em)]826 and 7217% higher, respectively.
image file: c4ra09267h-f8.tif
Fig. 8 Plasma concentration–time profile of SNEDDS, AE in GNO and AE in aqueous suspension upon oral administration. Data represented as mean ± S.D. (n = 4).
Table 6 Pharmacokinetic parameters of AE in GNO, AE aqueous suspension and SNEDDS upon oral administration. Data represented as mean ± S.D. (n = 4)
Parameter AE in aqueous suspension, 25 mg kg−1 AE in GNO, 25 mg kg−1 F-1, 25 mg kg−1 F-2, 25 mg kg−1 F-3, 25 mg kg−1 F-4, 25 mg kg−1
a Significantly different compared to AE in aqueous suspension (p < 0.05).b Significantly different compared to AE in GNO (p < 0.05).
t1/2 (h) 0.78 ± 0.23 2.48 ± 0.57 0.39 ± 0.14a,b 2.17 ± 0.92a 2.13 ± 1.56a 3.11 ± 0.43a
AUC0–t (h μg ml−1) 0.046 ± 0.008 2.43 ± 0.65 4.98 ± 0.79a,b 3.55 ± 0.75a 6.33 ± 1.21a,b 3.30 ± 0.51a
AUC0–∞ (h μg ml−1) 0.046 ± 0.007 2.47 ± 0.64 5.02 ± 0.80a,b 3.57 ± 0.74a 6.36 ± 1.21a,b 3.32 ± 0.53a
Cmax (μg ml−1) 0.048 ± 0.003 0.58 ± 0.055 1.35 ± 0.73a 1.51 ± 0.08a,b 2.08 ± 0.38a,b 2.53 ± 0.17a,b
Tmax (h) 0.25 ± 0.00 0.37 ± 0.17 1.5 ± 0.7a 0.5 ± 0.0a 2.0 ± 0.0 0.25 ± 0.0


2.6.3. Efficacy of SNEDDS against Plasmodium yoelii nigeriensis mice. The efficacy of F-1, F-2, F-3 and F-4 were tested against Plasmodium yoelii nigeriensis infected mice and were compared with the equivalent oral dose of AE given in the GNO as an oily solution and with the control group which was kept without the treatment. The SNEDDS used in this study were well tolerated by the experimental mice and there was no abnormality seen in the behavior, food/water consumption and general activity of the animals throughout the treatment and post treatment period.33 The anti-malarial profile of these formulations is given in Table 7.
Table 7 Antimalarial efficacy of oral formulations of AE against MDR P. y. nig in swiss micea,b
Formulations Dose (mg kg−1) × 5 days Mean parasitaemia% ± S.D. Mean survival time (MST) Cure rate%
Day 4 Day 7 Day 10 Day 14 Day 18 Day 21 Day 24 Day 28
a Pooled data of 2–3 experiments.b No. of surviving mice are given in parentheses.
F-1 40 0.0 (15) 0.0 (15) 0.0 (15) 0.0 (15) 0.0 (15) 0.0 (15) 0.0 (15) 0.0 (15) >28 100
25 0.0 (15) 0.0 (15) 0.0 (15) 0.0 (15) 0.0 (15) 0.0 (15) 0.0 (15) 0.0 (15) >28 100
12.5 0.0 (5) 0.0 (5) 0.0 (5) 0.0 (5) 0.0 (5) 0.0 (5) 0.0 (5) 0.0 (5) >28 100
Blank 64.2 ± 11 (5) Dead 5.2 ± 1.16 0
F-2 40 0.0 (15) 0.0 (15) 0.0 (15) 0.0 (15) 0.0 (15) 0.0 (15) 0.0 (15) 0.0 (15) >28 100
25 0.0 (15) 0.0 (15) 0.0 (15) 0.0 (15) 0.0 (15) 0.0 (15) 0.0 (15) 0.0 (15) >28 100
12.5 0.0 (5) 0.0 (5) 0.0 (5) 0.0 (5) 0.008 ± 0.016 (5) 2.7 ± 3.48 (5) 8.4 ± 10.36 (5) 10.46 ± 20.77 (5) >28 40
Blank 56 ± 16.9 (5) Dead 5 ± 1.1 0
F-3 40 0.0 (15) 0.0 (15) 0.0 (15) 0.0 (15) 0.0 (15) 0.0 (15) 0.0 (15) 0.0 (15) >28 100
25 0.0 (15) 0.0 (15) 0.0 (15) 0.0 (15) 0.0 (15) 0.0 (15) 0.0 (15) 0.0 (15) >28 100
12.5 0.0 (5) 0.0 (5) 0.0 (5) 0.02 ± 0.04 (5) 0.0 (4) 0.0 (4) 0.0 (4) 0.0 (4) 25.8 ± 4.4 80
Blank 54 ± 15.4 (5) 35.4 ± 0.0 (1) 23 ± 0.0 (1) 39.07 ± 0.0 (1) Dead 7.4 ± 3.92 0
F-4 40 0.0 (15) 0.0 (15) 0.0 (15) 0.0 (15) 0.0 (15) 0.0 (15) 0.0 (15) 0.0 (15) >28 100
25 0.0 (15) 0.0 (15) 0.0 (15) 0.0 (15) 0.0 (15) 0.0 (15) 0.0 (15) 0.0 (15) >28 100
12.5 0.0 (15) 0.0 (15) 2.16 ± 8.10 (15) 0.05 ± 0.20 (14) 0.0 (13) 1.95 ± 6.76 (13) 0.0 (12) 0.0 (12) 25.86 ± 4.80 80
Blank 40.5 ± 14.4 (4) Dead     6.25 ± 0.83 0
AE in GNO 40 0.0 (5) 0.0 (5) 0.0 (5) 0.0 (5) 0.0 (5) 0.0 (5) 0.0 (5) 0.0 (5) >28 100
25 0.0 (11) 0.0 (11) 0.0 (11) 0.11 ± 0.34 (11) 0.0 (10) 0.0 (10) 0.0 (10) 0.0 (10) 27.09 ± 2.87 91
12.5 0.0 (20) 0.0061 ± 0.017 (20) 13.78 ± 26.26 (18) 3.19 ± 7.42 (10) 2.87 ± 7.60 (8) 5.52 ± 12.93 (8) 0.0 (6) 0.0 (6) 18.29 ± 7.08 30
Blank 43.8 ± 28.8 (5) Dead 6.5 ± 1.16 0
Control 40.25 ± 19.49 (21) 41 ± 0 (1) Dead 6.23 ± 0.81 0


F-1, F-2, F-3 and F-4 demonstrated almost similar results when evaluated for their antimalarial efficacy. The percent cure rate at doses of 40 mg kg−1 × 5 days and 25 mg kg−1 × 5 days was found to be 100%. Mean survival time of this group was >28 days showing no parasitaemia up to 28 days. At the dose of 12.5 mg kg−1 × 5 days the cure rate for F-1 was observed to be 100% with mean survival time of >28 days showing no parasitaemia, whereas for F-2 no mortality was observed up to day 28 but the parasitaemia was present from day 18 of the treatment with a 40% cure rate, for F-3 and F-4 the cure rate was 80%. This indicates that 12.5 mg kg−1 × 5 days is a curative dose for the F-1, whereas for F-2, F-3 and F-4 the curative dose has been found to be 25 mg kg−1 × 5 days. The activity of these SNEDDS was confirmed by repeated experiments. AE in GNO was also given, for which the curative dose was found to be 40 mg kg−1 × 5 days with the mean survival time of >28 days, but at the dose of 25 mg kg−1 × 5 days the cure rate was observed as 80% with mean survival time of 19.6 ± 7.66 days showing parasitaemia on day 21 of the experiment, and at the lower dose of 12.5 mg kg−1 × 5 days the cure rate was observed to be only 30% with mean survival time of 17.3 ± 7.65 days showing parasitaemia on day 7 of the experiment. Both the blank SNEDDS and oil without AE groups showed parasitaemia on the fourth day of the experiment and all the mice died within 7 days of starting the treatment. The control group which was untreated has parasitaemia of more than 50% on the fourth day of the experiment, with all the mice dead within 7 days of treatment. These results might be due to the formation of a lipophilic protective layer over the AE molecules and their slow release from the SNEDDS, resulting in enhanced activity and reduced curative dose. The survival graph is shown in Fig. 9.


image file: c4ra09267h-f9.tif
Fig. 9 Survival of infected mice treated with AE-SNEDDS at 25 and 12.5 mg kg−1 × 5 days, (A) F-1, (B) F-2, (C) F-3, and (D) F-4.

These results imply that oral formulations of AE can be developed using SNEDDS for potential applications against malaria. This important lead would be very useful for the development of a solid oral dosage form of AE, if liquid SNEDDS are converted to solid SNEDDS.24,25 It has been reported previously that when oral AE was given in GNO, there was an increased neurotoxicity and mortality as compared to an aqueous suspension,34 but in the present study the SNEDDS of AE have not been found to be associated with neurotoxicity. These SNEDDS can also be combined with other conventional antimalarial drugs (such as fansidar and lumefantrine). These combinations can be expected to have a positive impact on the effective treatment of complicated malaria.31

3. Discussion

SNEDDS, lipid based formulations which offer the potential for enhancing the absorption of water insoluble drugs, were prepared for the oral delivery of AE. SNEDDS were our choice of formulation as it has been reported that the bioavailability of lipophilic drugs can be improved in the presence of fatty acids. SNEDDS self-emulsify themselves when they come in contact with the aqueous phase. These SNEDDS also provide stability to the drug due to the absence of aqueous phase related degradation, and also protect the drug from enzymatic and chemical hydrolysis in the gastrointestinal tract until their intestinal absorption, which increases the bioavailability of lipophilic drugs. SNEDDS of some active pharmaceutical ingredients are also available commercially, including cyclosporine, ritonavir, saquinavir and amprenavir.35 The liquid SNEDDS can easily be formulated into solid SNEDDS, these solid SNEDDS are easy to dispense and can be converted to tablets, capsules and even to pellets. We have developed SNEDDS with a blend of drug, oil and surfactants. These surfactants are known to increase permeability by disturbing the cell membrane and thus enhance the absorption of poorly soluble drugs.36,37 Furthermore, AE is a highly lipophilic compound and has good solubility in oils, these factors inspired us to develop SNEDDS which can solve the problems of oral bioavailability associated with AE and contribute towards absorption via the lymphatic route.31

The SNEDDS formulations were found to be robust when tested for the effect of dilution. The developed optimized formulations spontaneously formed self-emulsions with a very small globule size (55–160 nm), which is a significant parameter as it influences the absorption of AE. This may be attributed to cremophor and Lauroglycol which increased the solubilization capacity of AE and the high kinetic stability of SNEDDS upon dilution.

The cytotoxicity data reveals that the excipients used are safe and can be used further for the preparation of SNEDDS based formulations which can be used in humans. The cell viability remained >90% for all the SNEDDS against Caco-2 cell lines, indicating the safety of the excipients used. The Caco-2 cell line was used for the study since they originate from enterocytes and their viability data can share several biological and biochemical properties of both the resident and activated peritoneal macrophages.

The repeated dose oral toxicity study reveals no toxicity in terms of the mortality, serum biochemical parameters and serum hepatic markers of the treatment groups. Neither was there any sign of toxicity or significant change in the water and food consumption or body weights of mice in all groups during the 14 days observation period, or these are comparable to the control. Changes in the serum hepatic markers of treatment groups were insignificant compared to the control group. These results conform with our cytotoxicity data which indicates that the excipients used are well digested by the animals.

AE has been reported to be associated with neurotoxicity, although due to the significant number of cases reported of Plasmodium falciparum malaria and artemisinins being the best answer to them; not much importance has been given to their high dose neurotoxicity,38 so the histological examination of various neuronal brain regions after the administration of SNEDDS was carried out, no sign of toxicity was found and the results were parallel to the control. The liver is the major site of detoxification in the body for all drugs/toxins. Therefore it is an important organ in any toxicological study. Histological examinations of liver showed no evidence of hepatotoxicity and were indistinguishable from the controls. Kidneys are the main organs in the body susceptible to the toxic effects of drugs. Histological sections of the kidney derived from rats treated showed normal appearance of the renal capsules and tubules. Macroscopic and histological evaluation of other target organs such as spleen and stomach tissues showed no evidence of inflammation, cell lysis, or lesions; the natural architecture of the organs remained unaffected. Thus, the repeated dose toxicity study illustrated the safety of the developed SNEDDS for oral administration in the context of malaria infection.

We have used a sensitive and selective LC-MS technique to study the pharmacokinetic profile of AE. The liquid–liquid extraction method gave high and consistent recoveries for AE and I.S. and provided clean extracts. This analytical method was applied to estimate the levels of AE in rat plasma following an oral dose of 25 mg kg−1 in SNEDDS. The AUC reflects the extent of drug absorption and Cmax and Tmax are important features of the plasma level profile, these parameters are characteristics of the drug formulation and are important for comparative bioavailability (bioequivalence) studies. Significantly higher AUC was achieved in comparison to the both AE in GNO and AE in aqueous suspension. The superior performance of the SNEDDS may be attributed to the formation of the fine emulsion droplets and subsequent lipolysis and formation of mixed micelles, providing a larger surface area for the absorption of AE. Cremophor EL and Tween 80, which inhibits P-glycoprotein activity (which serves to protect the body from xenotoxins) resulted in enhanced intestinal permeability of AE. Oleic acid present in Tween 80 also increases chylomicron secretion which consecutively improves the lymphatic transport of AE. However, the poor oral bioavailability of AE in GNO and AE in aqueous suspension might lead to instability in the gastrointestinal fluids and limited aqueous solubility and dissolution of AE. The results of the pharmacokinetics study clearly indicate a significant enhancement in the bioavailability of AE in F-1, F-2, F-3 and F-4. The pharmacokinetic data was also supported by the antimalarial activity of the SNEDDS. The high solubility of the drug in the long chain oil present in SNEDDS, and the increased mucosal permeability caused by the presence of surfactants, is likely to improve lymphatic absorption of the drug and thus enhancing the bioavailability of AE. Rapid clearance of parasitaemia in mice was observed which might be due to the fast-acting schizontocide activity of AE. F-1, F-2, F-3 and F-4 completely cured Plasmodium yoelii infected mice by the oral route at a low dose compared to AE in GNO. The dose of 12.5 mg kg−1 for 5 days was a curative dose in our F-1 formulation without symptoms of parasitaemia and mortality even after the completion of our experiment, which might be attributed to the fact that AE was not degraded and remains stable for a prolonged period providing a higher concentration of AE for activity. The increased permeability of the intestinal membrane and increased absorption from the site might also be the reason. The curative dose of AE in GNO was 40 mg kg−1 for 5 days. Whereas the mean survival time of the untreated mice or mice treated with GNO only was less than 6 days. GNO has been taken as a control in our study as it is rich in mono- and polyunsaturated fatty acids, such as linolenic acid, linoleic acid and oleic acid, lacking antimalarial activity. The results clearly demonstrate that F-1, F-2, F-3 and F-4 were highly active against P. yoelii infected mice.

These formulations if combined with other conventional drugs, as in ACTs, can possibly reduce mortality among Plasmodium falciparum cases particularly in children and pregnant women who are at maximum risk and can overcome the problems associated with malaria infections.

4. Materials and methods

4.1. Materials

Arteether (AE) was kindly supplied by Themis Medicare, Mumbai, India. Labrafac, Labrasol and Lauroglycol were supplied by Gattefosse, Saint Priest cedex, France as a free gift. Tween 80, Span 80, and cremophor EL were purchased from Sigma Aldrich (St. Louis, USA), ground nut oil (GNO) was purchased from the local market as Premio refined oil. Acetonitrile was of spectroscopic grade and purchased from Merck (India). All other reagents and chemicals were of analytical grade. All materials were used without further purification. The water used in all experiments was prepared in a three-stage Millipore Milli-Q plus 185 purification system (Bedford, MA, US).

4.2. Pre-formulation studies

4.2.1. Solubility studies. An excess amount of AE was placed in 1 ml of vehicle (GNO, Labrafac PG, Labrasol, Lauroglycol 90, soybean oil, sesame oil). Then, the mixture was vortexed and kept for 48 h at ambient temperature in a shaking water bath to facilitate the solubilization. The samples were centrifuged at 5000 g for 20 min to remove the un-dissolved AE. The supernatant was taken and diluted with methanol for quantification of AE by HPLC. The HPLC system was equipped with 10 ATVP binary gradient pumps (Shimadzu), a Rheodyne (Cotati, CA, USA) model 7125 injector with a 20 μl loop and SPD-M10 AVP U V detector (Shimadzu). HPLC was carried out on a C18 column (250 mm, 4 mm, and 5 μm) (Merck). The injection volume was 20 μl and the column effluent was monitored at 215 nm. Data was acquired and processed using Class VP software. The mobile phase consisted of a mixture of acetonitrile[thin space (1/6-em)]:[thin space (1/6-em)]water (70[thin space (1/6-em)]:[thin space (1/6-em)]30 v/v).39 Chromatography was performed at a flow rate of 1.0 ml min−1. The solubility of AE in various excipients is described in Table 1.
4.2.2. Drug–excipient compatibility studies. In this dosage form the AE remains in close contact with one or more excipients; thus, these could affect the stability of the AE. The AE was kept with the excipients in a closed container for a given period of time and the properties of the AE were monitored at different time points up to three months, the amount of AE was estimated using HPLC method described above. Knowledge of AE–excipient interactions is useful in selecting appropriate excipients. The compatibility of excipients with AE was tested before preparing the SNEDDS (Table 2).

4.3. Construction of ternary phase diagram

The ternary phase diagram of systems containing oil and a blend of surfactants was made to identify the existence of self-emulsifying oil formulation fields and to optimize the concentration of oil that could self-emulsify under dilution and gentle agitation in the presence of the aqueous medium. Since the free energy required to form an emulsion is very low, the formation is thermodynamically spontaneous. Oily mixtures of AE and surfactant were prepared and varied in different percentage of the total preparation, each of them representing one corner of the triangle. A series of self-emulsifying systems were prepared in the formula with AE and varying concentrations of vehicle and surfactants. For any mixture, the total of surfactant and oil concentrations always added up to 100%. Compositions were evaluated for nanoemulsion formation by diluting 1 ml of each of the 64 mixtures to 100 ml with triple distilled water. Dispersions with a globule size of 200 nm or below were considered desirable. The area of nanoemulsion formation was identified for the respective system in which nanoemulsions with desired globule size were obtained. A formulation (0.2 ml) was introduced into 300 ml of triple distilled water (TDW) in a glass beaker at 37 °C and the contents were mixed gently on a vortex. The tendency to emulsify spontaneously by forming a fine milky emulsion and also the progress of emulsion droplets were observed by visual examination. All studies were repeated thrice, with similar observations being made between repeats. The series of SNEDDS were prepared and their self-emulsifying properties were observed visually.

4.4. Development of SNEDDS

A series of SNEDDS were prepared by dissolving AE in the oil followed by mixture of surfactant at ambient temperature. The AE-SNEDDS which were used for further study were F-1, F-2, F-3 and F-4, the composition of these formulations is shown in Table 3. The final mixture was vortexed vigorously for 20 min to achieve complete mixing until a clear solution was obtained. The SNEDDS were examined for any signs of turbidity or phase separation prior to self-emulsification and globule size studies. These SNEDDS were equilibrated to ambient temperature for 24 h and then stored at room temperature.

4.5. Characterization of the SNEDDS

4.5.1. Self-emulsification of SNEDDS in simulated gastro-intestinal fluids. F-1, F-2, F-3 and F-4 were evaluated for their self-emulsification, as they will come in contact with different physiological fluids after oral administration. The size and solubility of SNEDDS were measured in TDW, in simulated gastric fluid (prepared by dissolving 2.0 g of sodium chloride and 3.2 g of purified pepsin in 7.0 ml of hydrochloric acid and water up to 1000 ml) and in simulated intestinal fluid (prepared by dissolving 6.8 g of monobasic potassium phosphate in 250 ml of water and then adding 77 ml of 0.2 N sodium hydroxide and 500 ml of water, 10.0 g of pancreatin was then added and the resulting solution was adjusted with 0.2 N sodium hydroxide or 0.2 N hydrochloric acid to a pH of 6.8 ± 0.1 and finally diluted to 1000 ml).40 The size of the lipid droplets was determined at 25 °C by photon correlation spectroscopy using a Zetasizer Nano ZS (Malvern Instruments Ltd., UK).
4.5.2. Globule size and zeta potential. The globule size of F-1, F-2, F-3 and F-4 was determined by a Zetasizer Nano ZS model (Malvern Instruments) and the zeta potential was determined by laser Doppler anemometry using the Malvern Zetasizer. All the SNEDDS were diluted with TDW to an appropriate concentration before determining the zeta potential. The measurements were carried out in the fully automatic mode. Each sample was analyzed thrice.
4.5.3. In vitro cytotoxicity studies. Cytotoxicity studies were carried out using an MTT assay on the Caco-2 cell line to assess the safety of the excipients used in the preparation of SNEDDS. Caco-2 cell lines were grown to a density of 2–2.5 million cells in 25 cm2 flat bottom tissue culture flasks.41 F-1, F-2, F-3 and F-4 with and without AE were examined after dilution in DMEM for their in vitro cytotoxicity according to the methods reported previously.42 The optical density of the treated cells was measured using a multiwell scanning spectrophotometer (MRX Microplate Reader, Dynatech Laboratories Inc., Chantilly, VA, US) at a wavelength of 570 nm.

4.6. In vivo studies

4.6.1. Repeated dose oral toxicity study.
4.6.1.1. Animal handling. Animal studies were executed to analyze the toxicological effects of SNEDDS on the repeated dose oral toxicity, in terms of serum, liver enzyme levels and biomarkers of hepatotoxicity. The toxicity in the brain and peripheral organs was also evaluated. Wistar rats of about 150–200 g were obtained from the National Laboratory Animal Center, CDRI. The animals were kept at a controlled temperature of 23 ± 1 °C, with humidity of 55 ± 5%, in a 14 h light/10 h dark cycle. Throughout the study, the animals were provided with soy-free diet and filtered drinking water.

The toxicity of SNEDDS after oral administration of multiple doses has been evaluated. Neurotoxicity in animal models (mice, rats, dogs and rhesus monkeys) after the multiple IM doses of AE has been reported previously.43,44 Some studies on the neurotoxicity of AE in rats after multiple (7 days) injections of AE in sesame oil (AESO) resulted in a 7.5 fold higher level of AE accumulation in the blood due to the very slow and prolonged absorption of AE from the injection site, which was associated with neurotoxicity in the brain, besides causing anorexia and gastrointestinal toxicity.45 A formulation of AE in GNO has also been reported to have no neurotoxicity in animals by IM/oral/rectal routes as well as in clinical trials in which 3 doses were administered through IM injection.46–48 Although, due to the widespread presence of malaria and the development of resistant strains of Plasmodium, allowance has been given for the neurotoxic effects of artemisinins.38


4.6.1.2. Study protocol and drug treatment. SNEDDS were evaluated at a dose equivalent to 50 mg kg−1 for toxicity studies; this dose has been selected as it is twice the curative dose for malaria for AE in GNO. The SNEDDS were diluted suitably with water. Wistar rats of either sex were assigned to five test groups consisting of four animals each for histopathological, hematological and serum biomarkers: Group I (F-I), Group II (F-II), Group III (F-III), Group IV (F-IV), and Group V (control). Animals in each test group were administered SNEDDS at the dose of 50 mg kg−1 body weight for 14 days, once daily, by oral gavages.
4.6.1.3. Hematological parameters. Blood was drawn from the retro orbital plexus of rats in tubes containing anticoagulant EDTA; the tubes were tabbed to mix the blood with anticoagulant properly to prevent blood-coagulation. Blood haematological analysis was done by using an automated hematoanalyser (SYSMEX XT-2000). Different haematological parameters viz. haemoglobin (Hgb); red blood cells (RBC); mean corpuscular volume (MCV); mean corpuscular haemoglobin concentration (MCHC); mean corpuscular hemoglobin (MCH); white blood cells (WBC), and differential population of leukocytes were estimated.
4.6.1.4. Biochemical parameters. Blood was drawn from the retro orbital plexus of rats of different experimental groups and allowed to stand undisturbed for 30 min. Serum was separated by centrifugation and levels of urea, alanine transaminase (ALT), aspartate aminotransferase (AST), blood urea nitrogen (BUN), total bilirubin (T-BIL), creatinine (CRT), etc. were estimated using a fully automated biochemical analyzer (Merck-selectra junior).
4.6.1.5. Histological analysis. To evaluate the morphological alterations, haematoxylin and eosin (HE) staining was performed in sections of the brain and peripheral organs. Animals were perfused intracardially with ice-cold 0.1 M phosphate-buffered saline (PBS) followed by cold para-formaldehyde (4% wt/vol) in 0.1 M PBS. Selected brain sections were cut based, two blocks were taken from each brain; one encompassing the midbrain, the other encompassing the caudal pons and rostral medulla (as well as the cerebellum). The blocks were embedded in paraffin and sectioned. The animals were decapitated and other peripheral organs like the stomach, liver, spleen and kidneys were also removed and processed for paraffin embedded sectioning. 4–5 μm thick lateral sections were cut on a Microtome (Leica, USA) and were collected on poly-L-lysine coated slides and processed for hematoxylin and eosin staining. Images were captured on an upright microscope at 40× magnification.

4.7. Pharmacokinetic studies by LC-MS

The pharmacokinetic study to evaluate the oral absorption of F-1, F-2, F-3 and F-4 has been carried out using a LC-MS technique.49,50

A HPLC system consisting of Series 200 pumps and auto sampler with a temperature controlled Peltier-tray (Perkin-Elmer instruments, Norwalk, USA) was used to inject 10 μl aliquots of the processed samples on an X-bridge C18 column (4.6 mm × 50 mm, 5.0 μm). The system was run in isocratic mode with the mobile phase consisting of methanol and 0.01 M ammonium acetate (pH 5.0) in the ratio of 95[thin space (1/6-em)]:[thin space (1/6-em)]5 (v/v). The mobile phase was duly filtered through a 0.22 μm millipore filter (Billerica, USA), degassed ultrasonically for 15 min and delivered at a flow rate of 0.8 ml min−1 for chromatographic separation.

Mass spectrometric detection was performed on a QTRAP 4000 mass spectrometer (Applied Biosystems, MDS Sciex Toronto, Canada) equipped with an API electrospray ionization (ESI) source. The ion spray voltage was set at 5500 V. The instrument parameters viz., nebulizer gas, curtain gas, auxillary gas and collision gas were set at 50, 35, 45 and 12, respectively. Compound parameters viz., de-clustering potential (DP), collision energy (CE), entrance potential (EP) and collision exit potential (CXP) were 35, 13, 10, 15 V and 35, 16, 10, 10 V for AE and the internal standard, artemisinin, respectively. Zero air was used as source gas while nitrogen was used as both curtain and collision gas. The mass spectrometer was operated in ESI positive ion mode and detection of the ions was performed in the multiple reaction monitoring (MRM) mode, monitoring the transition of the m/z 330.0 precursor ion [M + H]+ to the m/z 267.0 product ion for AE and the m/z 300.4 precursor ion [M + H]+ to the m/z 209.4 product ion for the IS. Quadrupoles Q1 and Q3 were set on unit resolution. Data acquisition and quantitation were performed using analyst software version 1.6 (Applied Biosystems, MDS Sciex Toronto, Canada).

4.7.1. In vivo pharmacokinetic study. Young adult male Sprague-Dawley (SD) rats, weighing 200 ± 20 g, were procured from the National Laboratory Animal Center, CSIR-CDRI (Lucknow, India). Rats were housed in well ventilated cages at room temperature (24 ± 2 °C) and 40–60% relative humidity while on a regular 12 h light–dark cycle. The animals were acclimatized for a minimum period of 3 days prior to the experiment. Approval from the Local Animal Ethics Committee was sought and the study protocols were approved before the commencement of the studies. To evaluate the enhancement in the bioavailability of developed formulations (F-1, F-2, F-3 and F-4), it was compared with the AE aqueous suspension (AE suspended in water) and AE in GNO (a known amount of AE dissolved in GNO by warming at 50 °C). SNEDDS, AE aqueous suspension and AE in GNO were administered orally at an equivalent dose of 25 mg kg−1. Blood samples were collected from the retro orbital plexus of rats under light ether anesthesia into microfuge tubes containing heparin as an anti-coagulant at 0.08, 0.25, 0.5, 1.0, 1.5, 2.0, 4.0, 5.0, 7.0, 9.0 and 24.0 h post-dosing. Plasma samples were harvested by centrifuging the blood at 13[thin space (1/6-em)]000 rpm for 10 min and stored frozen at −70 ± 10 °C until analysis. Plasma (100 μl) samples were spiked with internal standard (IS), and processed as described.
4.7.2. Sample preparation. A simple liquid–liquid extraction method was followed for the extraction of AE and IS from rat plasma. To 100 μl of plasma aliquot, IS solution (10 μl of 40 ng ml−1 working stock) equivalent to 4.0 ng was added and mixed for 15 s on a cyclomixer (Spinix Tarsons, Kolkata, India), followed by extraction with 2.0 ml of hexane[thin space (1/6-em)]:[thin space (1/6-em)]ethyl acetate, 1[thin space (1/6-em)]:[thin space (1/6-em)]1 (v/v), mixture. The mixture was vortexed for 3 min, followed by centrifugation for 5 min at 2000 g on a Sigma 3-16K (Frankfurt, Germany). An aliquot of 1.6 ml of organic layer was separated and evaporated to dryness under vacuum in a speed vac concentrator (Savant Instrument, Farmingdale, USA). The residue was reconstituted in 200 μl of the mobile phase and 10 μl was injected onto the analytical column.

The recovery of AE and IS, through the liquid–liquid extraction procedure, has been determined by comparing the responses of the analytes extracted from replicate quality control (QC) samples (n = 6) with the response of analytes from post-extracted plasma standard samples at equivalent concentrations. Recoveries of AE were determined at lower limit of quantitation, QC low and QC high concentrations viz., 5, 15 and 800 ng ml−1, whereas the recovery of IS was determined at a single concentration of 40.0 ng ml.51

4.7.3. Pharmacokinetic analysis. The observed maximum plasma concentration (Cmax) and the time to reach the maximum plasma concentration (Tmax) were obtained by visual inspection of the experimental data. The data was subjected to non-compartmental pharmacokinetics analysis using WinNonlin (version 5.1, Pharsight Corporation, Mountain View, USA). Area under curve (AUC) from 0 to 24 h (AUC0–24) was calculated using a linear trapezoidal rule. AUC from 0 to infinity (AUC0–∞) was calculated as the sum of AUC0–t and Clast/kel, where Clast represents the last quantifiable concentration and kel represents the elimination rate constant.
4.7.4. Relative bioavailability (RB%). The RB% of AE in F-1, F-2, F-3 and F-4 formulations has been calculated in order to determine the percentage enhancement in bioavailability.

The RB% was calculated as follows:

image file: c4ra09267h-t1.tif

4.8. In vivo antimalarial efficacy of SNEDDS

Swiss mice (20 ± 2 g) of either sex, infected with Plasmodium yoelii nigeriensis were used in the study. Plasmodium yoelii nigeriensis has been reported to be resistant to chloroquine (128 mg kg−1 × 4), mefloquine (128 mg kg−1 × 4) and quinine (300 mg kg−1 × 4).52–54 All the experiments were conducted with the approval of the Institutional Animal Ethics Committee. Mice were kept under controlled climate conditions (23 ± 2 °C; RH = 60%) and photoperiod (12 h light–dark cycles) in the animal house. Animals were fed on a standard mouse diet and provided with clean drinking water ad libitum. Mice were inoculated with 1 × 10⁶ inoculum of Plasmodium yoelii nigeriensis infected RBC by the I/P route and after 4–5 h of giving the infection, the treatment was started from the same day. All the SNEDDS of AE were administered through the oral route only and standard AE in GNO was also given at all the doses.
4.8.1. Administration of the drug. F-1, F-2, F-3 and F-4 were administered orally to the Plasmodium yoelii nigeriensis infected mice. Initially 40 mg kg−1 dose for 5 days was used for the treatment and the formulations, which cured the mice at a particular dose, were further tested at lower doses of 25 mg kg−1 and 12.5 mg kg−1.
4.8.2. Antimalarial activity assessment. Blood schizontocidal activity of F-1, F-2, F-3 and F-4 was assessed according to the method reported earlier with some modifications.55 F-1, F-2, F-3 and F-4 were administered once daily by the oral route, starting from the day of infection (day 0) and with continuing once daily administration for a total of 5 days. Thin blood smears were prepared from the tail vein of each animal on days 4, 7, 10, 14, 21, 24 and 28 in order to check the parasitaemia. Smears were fixed with methanol and stained with Giemsa’s stain. These smears were examined for parasitaemia% and their ± SD was also calculated. If animals remained without parasitaemia until day 28, the formulation was considered to be 100% curative at that particular dose.

5. Statistical analysis

All results have been expressed as means ± SD (n = 3–4). Differences were compared using one-way analysis of variance (ANOVA) followed by the Tukey–Kramer multiple comparison test, using Graph Pad Instat software (Graph Pad Software Inc. CA, USA). p < 0.05 denotes significance in all cases.

6. Conclusions

In conclusion, the present investigation illustrated the potential use of SNEDDS for improving the pharmacokinetics of AE by the oral route. The results indicate a significant improvement in the relative bioavailability of AE in rats without causing any toxicity. SNEDDS of AE can be a promising delivery system, and if combined with other recommended conventional drugs for malaria, it could be possible to employ them for artemisinin based combination therapy in resistant malaria.

7. Ethical statement

Animal studies were conducted in accordance with the current legislation of the institute on animal experiments, and the protocol was approved by the ‘Institutional Animal Ethical Committee’ of CSIR-Central Drug Research Institute, India. They were housed in plastic cages in climatically controlled rooms and fed with standard rodent food pellets (Lipton India Ltd, Bombay) and water ad libitum. The study was carried out with the guidelines of the Council for the Purpose of Control and Supervision of Experiments on Animals (CPCSEA), Ministry of Social Justice and Empowerment, Government of India.

Conflict of interest

The authors declare they have no competing financial interest.

Acknowledgements

The authors would like to thank BIOCERAM (ESC-0103) and the Indian Council of Medical Research New-Delhi, India for providing SRF fellowship. CDRI communication number is 8855.

References

  1. WHO, 2013.
  2. R. W. Snow, C. A. Guerra, A. M. Noor, H. Y. Myint and S. I. Hay, Nature, 2005, 434, 214–217 CrossRef CAS PubMed.
  3. G. Jagoe, Medicines for Malaria Venture, 2014, vol. 2014 Search PubMed.
  4. B. B. Afolabi and C. N. Okoromah, Cochrane Database Syst. Rev., 2004, 18, CD004391 Search PubMed.
  5. F. Nosten and N. J. White, Am. J. Trop. Med. Hyg., 2007, 77, 181–192 CAS.
  6. U. Eckstein-Ludwig, R. J. Webb, I. D. Van Goethem, J. M. East, A. G. Lee, M. Kimura, P. M. O’Neill, P. G. Bray, S. A. Ward and S. Krishna, Nature, 2003, 424, 957–961 CrossRef CAS PubMed.
  7. S. R. Meshnick, Int. J. Parasitol., 2002, 32, 1655–1660 CrossRef CAS.
  8. V. Dhingra, K. Vishweshwar Rao and M. Lakshmi Narasu, Life Sci., 2000, 66, 279–300 CrossRef CAS.
  9. P. M. O’Neill, Nature, 2004, 430, 838–839 CrossRef PubMed.
  10. C. O’Brien, P. P. Henrich, N. Passi and D. A. Fidock, Curr. Opin. Infect. Dis., 2011, 24, 570–577 CrossRef PubMed.
  11. H. Noedl, Y. Se, K. Schaecher, B. L. Smith, D. Socheat and M. M. Fukuda, N. Engl. J. Med., 2008, 359, 2619–2620 CrossRef CAS PubMed.
  12. C. Amaratunga, S. Sreng, S. Suon, E. S. Phelps, K. Stepniewska, P. Lim, C. Zhou, S. Mao, J. M. Anderson, N. Lindegardh, H. Jiang, J. Song, X.-z. Su, N. J. White, A. M. Dondorp, T. J. C. Anderson, M. P. Fay, J. Mu, S. Duong and R. M. Fairhurst, Lancet Infect. Dis., 2012, 12, 851–858 CrossRef.
  13. A. P. Phyo, S. Nkhoma, K. Stepniewska, E. A. Ashley, S. Nair, R. McGready, C. ler Moo, S. Al-Saai, A. M. Dondorp, K. M. Lwin, P. Singhasivanon, N. P. J. Day, N. J. White, T. J. C. Anderson and F. Nosten, Lancet, 2012, 379, 1960–1966 CrossRef.
  14. R. T. Eastman and D. A. Fidock, Nat. Rev. Microbiol., 2009, 7, 864–874 CAS.
  15. WHO, 2014.
  16. S. D. Mandawgade, S. Sharma, S. Pathak and V. B. Patravale, Int. J. Pharm., 2008, 362, 179–183 CrossRef CAS PubMed.
  17. W. Wu, Y. Wang and L. Que, Eur. J. Pharm. Biopharm., 2006, 63, 288–294 CrossRef CAS PubMed.
  18. C. W. Pouton and C. J. Porter, Adv. Drug Delivery Rev., 2008, 60, 625–637 CrossRef CAS PubMed.
  19. C. W. Pouton, Eur. J. Pharm. Sci., 2006, 29, 278–287 CrossRef CAS PubMed.
  20. M. J. Lawrence and G. D. Rees, Adv. Drug Delivery Rev., 2000, 45, 89–121 CrossRef CAS.
  21. R. N. Gursoy and S. Benita, Biomed. Pharmacother., 2004, 58, 173–182 CrossRef PubMed.
  22. K. M. Wasan, Drug Dev. Ind. Pharm., 2001, 27, 267–276 CrossRef CAS PubMed.
  23. A. A. Attama and M. O. Nkemnele, Int. J. Pharm., 2005, 304, 4–10 CrossRef CAS PubMed.
  24. P. Balakrishnan, B. J. Lee, D. H. Oh, J. O. Kim, M. J. Hong, J. P. Jee, J. A. Kim, B. K. Yoo, J. S. Woo, C. S. Yong and H. G. Choi, Eur. J. Pharm. Biopharm., 2009, 72, 539–545 CrossRef CAS PubMed.
  25. W. Cho, M. S. Kim, J. S. Kim, J. Park, H. J. Park, K. H. Cha, J. S. Park and S. J. Hwang, Int. J. Nanomed., 2013, 8, 1673–1682 Search PubMed.
  26. V. Agarwal, A. Siddiqui, H. Ali and S. Nazzal, Int. J. Pharm., 2009, 366, 44–52 CrossRef CAS PubMed.
  27. B. Isacchi, M. C. Bergonzi, M. Grazioso, C. Righeschi, A. Pietretti, C. Severini and A. R. Bilia, Eur. J. Pharm. Biopharm., 2012, 80, 528–534 CrossRef CAS PubMed.
  28. C. Righeschi, M. Coronnello, A. Mastrantoni, B. Isacchi, M. C. Bergonzi, E. Mini and A. R. Bilia, Colloids Surf., B, 2014, 116, 121–127 CrossRef CAS PubMed.
  29. P. Dwivedi, R. Khatik, K. Khandelwal, I. Taneja, K. S. Raju, M. Wahajuddin, S. K. Paliwal, A. K. Dwivedi and P. R. Mishra, Int. J. Pharm., 2014, 466, 321–327,  DOI:10.1016/j.ijpharm.2014.03.036 Epub 2014 Mar 20.
  30. C. W. Pouton, Eur. J. Pharm. Sci., 2000, 11, S93–S98 CrossRef CAS.
  31. P. B. Memvanga, R. Coco and V. Preat, J. Controlled Release, 2013, 172, 904–913 CrossRef CAS PubMed.
  32. W. R. Taylor and N. J. White, Drug Saf., 2004, 27, 25–61 CrossRef CAS PubMed.
  33. R. Tripathi, M. Khanna and A. K. Dwivedi, Chemotherapy, 2010, 56, 178–183 CrossRef CAS PubMed.
  34. A. Nontprasert, S. Pukrittayakamee, M. Nosten-Bertrand, S. Vanijanonta and N. J. White, Am. J. Trop. Med. Hyg., 2000, 62, 409–412 CAS.
  35. T. R. Kommuru, B. Gurley, M. A. Khan and I. K. Reddy, Int. J. Pharm., 2001, 212, 233–246 CrossRef CAS.
  36. E. Scott Swenson and W. J. Curatolo, Adv. Drug Delivery Rev., 1992, 8, 39–92 CrossRef.
  37. P. Artursson and J. Karlsson, Biochem. Biophys. Res. Commun., 1991, 175, 880–885 CrossRef CAS.
  38. P. J. de Vries and T. K. Dien, Drugs, 1996, 52, 818–836 CrossRef CAS PubMed.
  39. A. A. Al-Angary, M. A. Al-Meshal, M. A. Bayomi and S. H. Khidr, Int. J. Pharm., 1996, 128, 163–168 CrossRef CAS.
  40. E. Galia, E. Nicolaides, D. Horter, R. Lobenberg, C. Reppas and J. B. Dressman, Pharm. Res., 1998, 15, 698–705 CrossRef CAS.
  41. P. Dwivedi, S. Kansal, M. Sharma, R. Shukla, A. Verma, P. Shukla, P. Tripathi, P. Gupta, D. Saini, K. Khandelwal, R. Verma, A. K. Dwivedi and P. R. Mishra, J. Drug Targeting, 2012, 20, 883–896 CrossRef CAS PubMed.
  42. T. Mosmann, J. Immunol. Methods, 1983, 65, 55–63 CrossRef CAS.
  43. T. G. Brewer, S. J. Grate, J. O. Peggins, P. J. Weina, J. M. Petras, B. S. Levine, M. H. Heiffer and B. G. Schuster, Am. J. Trop. Med. Hyg., 1994, 51, 251–259 CAS.
  44. J. M. Petras, D. E. Kyle, M. Gettayacamin, G. D. Young, R. A. Bauman, H. K. Webster, K. D. Corcoran, J. O. Peggins, M. A. Vane and T. G. Brewer, Am. J. Trop. Med. Hyg., 1997, 56, 390–396 CAS.
  45. Q. G. Li, S. R. Mog, Y. Z. Si, D. E. Kyle, M. Gettayacamin and W. K. Milhous, Am. J. Trop. Med. Hyg., 2002, 66, 516–525 CAS.
  46. S. K. Mishra, O. P. Asthana, S. Mohanty, J. K. Patnaik, B. S. Das, J. S. Srivastava, S. K. Satpathy, S. Dash, P. K. Rath and K. Varghese, Trans. R. Soc. Trop. Med. Hyg., 1995, 89, 299–301 CrossRef CAS.
  47. P. K. Mohapatra, A. M. Khan, A. Prakash, J. Mahanta and V. K. Srivastava, Indian J. Med. Res., 1996, 104, 284–287 CAS.
  48. O. P. Asthana, J. S. Srivastava and P. Das Gupta, J. Assoc. Physicians India, 2002, 50, 539–545 CAS.
  49. S. Sabarinath, R. P. Singh and R. C. Gupta, J. Chromatogr. B: Anal. Technol. Biomed. Life Sci., 2006, 842, 36–42 CrossRef CAS PubMed.
  50. M. Rajanikanth, K. P. Madhusudanan and R. C. Gupta, J. Chromatogr. B: Anal. Technol. Biomed. Life Sci., 2003, 783, 391–399 CrossRef CAS.
  51. M. Rajanikanth, K. P. Madhusudanan and R. C. Gupta, Biomed. Chromatogr., 2003, 17, 440–446 CrossRef CAS PubMed.
  52. R. Tripathi, A. Umesh, M. Mishra, S. K. Puri and G. P. Dutta, Exp. Parasitol., 2000, 94, 190–193 CrossRef CAS PubMed.
  53. G. P. Dutta, R. Bajpai and R. A. Vishwakarma, Pharmacol. Res., 1989, 21, 415–419 CrossRef CAS.
  54. A. Awasthi, G. P. Dutta, V. Bhakuni and R. Tripathi, Exp. Parasitol., 2004, 107, 115–119 CrossRef CAS PubMed.
  55. R. Tripathi, M. Khanna and A. K. Dwivedi, Chemotherapy, 2010, 56, 178–183 CrossRef CAS PubMed.

This journal is © The Royal Society of Chemistry 2014