DOI:
10.1039/C4RA09227A
(Paper)
RSC Adv., 2014,
4, 48703-48711
Adsorption-photocatalytic degradation of methyl orange over a facile one-step hydrothermally synthesized TiO2/ZnO–NH2–RGO nanocomposite†
Received
25th August 2014
, Accepted 16th September 2014
First published on 16th September 2014
Abstract
A novel TiO2/ZnO–NH2–reduced graphene oxide (TZ-a-RGO) nanocomposite was successfully prepared using a facile one-step hydrothermal method. The TZ-a-RGO was characterized by X-ray diffraction (XRD), Fourier transform infrared spectroscopy (FTIR), Transmission electron microscopy (TEM), Brunauer–Emmett–Teller (BET) surface area analysis and UV-vis absorption spectrophotometry to investigate its structural features. The TZ-a-RGO was used as a catalyst to remove methyl orange (MO) from wastewater, and the results indicated that this catalytic system has a good performance in terms of removal of MO. The adsorption experiments of the TZ-a-RGO followed the pseudo-second-order kinetic model, and the adsorption isotherms were accurately represented by the Langmuir model. The degradation of methyl orange (MO) by TZ-a-RGO fitted well with the Langmuir–Hinshelwood model, and MO removal was obtained through a synergistic effect of adsorption and photocatalysis. The photocatalytic rate of MO over the composites was as high as 8.2 and 3.2 times that over commercial P25 (Degussa) and TiO2/ZnO, respectively. The potential photocatalytic mechanism for the TZ-a-RGO nanocomposite under UV was discussed.
1. Introduction
Azo dyes, which contain one or more nitrogen to nitrogen double bonds (–N
N–) conjugating the pendant aromatic rings, are the largest group of colorants used in industries such as color printing, foodstuffs, textile dyeing and leather. However, many dyes are mutagenic and carcinogenic which are harmful to man and the environment.1,2 Therefore the removal of dyes from water has received increasing attention. Several physico-chemical methods are widely used, such as, membrane filtration,3 flocculation-coagulation,4 ozonation5 and adsorption.6 However, these conventional treatment technologies have a common drawback that they are unable to completely remove azo dyes from wastewater causing secondary pollution which is economically unfeasible.
Heterogeneous photocatalysis by semiconductor materials promises increasing attention for the removal of toxic organic and inorganic pollutants from effluents, because it not only degrades the contaminations, but also causes their complete mineralization to CO2, H2O and mineral acids.7 Titanium dioxide (TiO2) is a photocatalytic material that be used extensively due to its high chemical stability, powerful oxidation strength, low toxicity, low cost and outstanding catalytic performance.8,9 However, the quick recombination of photogenerated electron–hole pairs and the low solar energy conversion efficiency are the two drawbacks that limit its application in practice. To eliminate the above difficulties, modifying TiO2 with noble metal10,11 can narrow the wide band gap of TiO2 and enhance the photogenerated charge separation. In consideration of high price and depletable resources of noble metals, the coupling with an oxide semiconductor is considered to be an attractive method. It can drive charge separation efficiently, extend the lifetime of the charge carriers and obviously enhance the efficiency of the interfacial charge transfer to adsorbed dyes.12 It is generally known that ZnO coupling is an appropriate choice to TiO2 due to similar photodegradation mechanism and higher photocatalytic performance.13,14 Furthermore, the biggest advantage of coupling with ZnO is that it can absorb over a larger fraction of UV spectrum and the corresponding threshold value is 425 nm.15 ZnO/TiO2 nanocomposite has been reported to modify their electronic states. Under the illumination, the electrons transfer from the conduction band of ZnO to the conduction band of TiO2, reversely, the holes transfer from the valence band of TiO2 to the valence band of ZnO, resulting in a reduction rate of electron hole pairs recombination and an increase of their lifetime.16 Nevertheless, these nanocomposite easily agglomerate in the aqueous solution owing to inter-particle interactions such as Van der waals forces and the rapid recombination of charge still exists. Thus, these drawbacks limit their practical application.
Graphene, a two-dimensional material with a one-atom-thick, has recently attracted a great deal of scientific attention among the researchers. Owing to its extraordinary advantages, such as large theoretical specific surface area (2630 m2 g−1),17 superior electronic and excellent chemical stability,18 graphene is considered as an outstanding support for photocatalytic application. Zhang et al.19 reported that the P25–Graphene composites demonstrated an improved photocatalytic activity in the degradation of methylene blue as compared with P25. Xu et al.20 illustrated ZnO–RGO composite exhibited much higher photo-degradation performance than pure ZnO. Dong et al.17 demonstrated that graphene/rod-shaped TiO2 nanocomposite showed a significant enhancement of photocatalytic activity compared to the bare commercial TiO2. Based on the above considerations, TZ-a-RGO nanocomposite was obtained through a facile one-step hydrothermal method. GO was reduced and primary amine was induced into the reduced graphene oxide sheet (amine-RGO) that could not only improve the solubility of composite, but also enhance the absorptive capacity. The produced composite was characterized by X-ray diffraction (XRD), Fourier transform infrared spectrum (FTIR), Transmission electron microscope (TEM), Brunauer–Emmett–Teller (BET) and UV-vis absorption spectrophotometer. The synergistic effect between surface adsorption characteristics and photocatalytic potential was examined by the comparisons of typical reaction systems during the degradation of MO solutions.
2. Experimental
2.1 Materials
Natural flake graphite was purchased from Nanyang BoXing mining Co., Ltd. (China). Commercial P25 (Degussa) was obtained from JAH TECH Co., Ltd. (China) with average diameter of 21 nm. Other chemicals (analytical grade) were obtained from AiHua Fine Chemicals Co., Ltd. (China) and used as received without any further purification.
2.2 Preparation of graphene oxide (GO)
GO was synthesized by chemical oxidation and exfoliation of natural flake graphite in accordance with improved Hummers' method.21 In brief, 500 mg of graphite powder was added into pre-blended solution of concentrated sulfuric acid (H2SO4) and phosphoric acid (H3PO4). Then, 3.0 g of KMnO4 was slowly added while magnetic stirring and cooling continuously to keep the temperature blow 298 K. The ice-bath was exchanged by an oil-bath and the mixture was heated to 323 K and maintained it for 12 h with vigorous stirring. Then, the mixture was cooled to room temperature and added 1.5 ml of 35% hydrogen peroxide aqueous solution, and the suspension turned brilliant yellow immediately. Afterwards, the suspension was filtered, washed with 200 ml absolute ethanol and finally dried under vacuum condition.
2.3 Synthesis of TZ-a-RGO photocatalyst
TZ-a-RGO were prepared via a hydrothermal method. In a typical procedure, a certain amount of GO was uniformly dispersed into 50 ml ethanol solution followed by ultrasonication for 1 h. Then, 0.038 g of zinc acetate dehydrate and 0.02 g of KOH were dissolved into the GO dispersion with vigorous stirring, respectively. Under vigorous stirring, NaOH solution and subsequently ethylenediamine solution was dropped into the suspension (pH ≈ 12.5). Then, 0.014 g of P25 was added into this suspension which was strongly stirred for 1 h. After forming a homogeneous dispersion, the mixture was sealed into a teflon lined stainless autoclave and heated at 161 °C for 24 h. The resulting product was washed thoroughly with deionized water and then dried at 80 °C in air for further use. As a comparison, ZnO/TiO2 composite was prepared under the same condition without using GO.
2.4 Photocatalytic and adsorption experiment
MO was used as an objective pollutant to evaluate the photocatalytic capability of the as-prepared photocatalysts. The photodegradation experiments were conducted in a cylindrical glass vessel with a double walled cooling water jacket to keep the room temperature of the reaction solution during the experiment. The intense light source was provided with a 400 W high-pressure mercury lamp, and a constant dissolved oxygen concentration was achieved by bubbling air into the reaction solution. Before the photocatalytic reaction, 15 mg of TZ-a-RGO was dispersed into aqueous solutions of desired concentration from 10 mg l−1 to 30 mg l−1 at certain pH, and the suspension was favored the adsorption–desorption equilibration by stirring for 30 min. At an appropriate time interval, fixed amounts of the suspension were withdrawn from the reactor and filtered by 0.45 um membrane filter for further analysis. For comparison, the P25 and ZnO/TiO2 nanocomposite were also performed using the same parameters.
2.5 Characterization
The crystalline structure of the catalysts was investigated by X-ray diffraction (XRD, XRD-6000, shimadzu, Japan). The morphology of GO and TZ-a-RGO was observed by a transmission electron microscope (TEM, TecnaiG2F30). The Brunauer–Emmett–Teller (BET) specific surface area, pore volume and size were determined by using N2 adsorption–desorption at 77 K (Sorptomatic 1990, Thermo, USA). The surface chemical characteristics were examined by a NEXUS670FTIR spectrometer (Nicolet Instrument Corporation, USA). The UV-vis absorption spectra were recorded using a Hitachi U-3900 UV-vis spectrophotometer.
3. Results and discussion
3.1 Characterization of photocatalysts
The crystalline phase of the as-prepared materials was characterized by XRD (Fig. 1). As can be seen, GO was reduced by ethylenediamine to RGO, pertinent diffraction peaks for ZnO were indexed to a pure wurtzite hexagon phase and matched well with the already reported data.22 From the diffraction peaks of commercial P25, it was confirmed that the P25 is the integration of anatase and rutile, where anatase is the predominant phase. Apparently, the XRD pattern of the titanium dioxide in the ZnO/TiO2 and TZ-a-RGO were similar with pure P25. Compared with ZnO/TiO2, the TZ-a-RGO exhibits the formation of Zn2TiO4 at low angle region 2θ = 28.2° (ref. 23) and a small amount of a brookite phase.24 This indicated that the introduction of graphene can hinder the anatase phase growth and facilitate transforming from anatase to brookite, because of graphene specific structural properties during the hydrothermal treatment process.25 As for the mixed-phase of anatase and brookite, it has a higher photocatalytic efficiency than pure TiO2 phase due to its enhanced quantum efficiency.26 No diffraction peaks for carbon species were observed in the composite, which might be due to the low amount and relatively low diffraction intensity of graphene. The morphology of as-prepared materials has been investigated by TEM. Fig. 2(a) shows flake-like shapes of amine-RGO with wrinkles. Fig. 2(c and d) shows that a number of the TZ-a-RGO about 30–50 nm nanoparticles are homogeneously dispersed on the surface of RGO which helps to prevent the agglomeration. Furthermore, the existence of amine-RGO, ZnO and TiO2 in the composite has been proved by the peaks of C, N, Zn, Ti and O in the EDX data as shown in Fig. 2(b).
 |
| Fig. 1 XRD patterns of (a) TZ-a-RGO (b) ZnO/TiO2 (c) P25 (d) amine-RGO (e) GO. | |
 |
| Fig. 2 TEM image (a) of amine-RGO, EDX pattern (b), TEM image (c) and (d) of TZ-a-RGO. The inset in graph d show TEM image of P25. | |
The N2 adsorption–desorption isotherms (Fig. 3) of GO, amine-RGO, ZnO/TiO2 and TZ-a-RGO show characteristic type-IV curves with an H3 hysteresis loop, and the shapes demonstrated meso- and macro-porous characteristics.27 According to the calculated textural parameters of as-prepared materials investigated (Table 1) that the TZ-a-RGO had a higher surface area (64 m2 g−1) than that of the commercial P25 TiO2 (50 m2 g−1), ZnO/TiO2 (33.52 m2 g−1) and amine-RGO (55.62 m2 g−1). Therefore the RGO provided more available adsorption sites on the adsorbent surfaces. In comparison with the theoretical value of single graphene sheets (2630 m2 g−1), the GO has smaller specific surface area (40 m2 g−1), possibly because different types of oxygen containing functional groups on the GO, and the hydrogen bonding resulted in tight sheet association.28 The average pore size of TZ-a-RGO is 13.25 nm and the total pore volume is 0.213 cm3 g−1. The result means that the TZ-a-RGO can strongly extract MO molecules from solution and then concentrate them near the catalyst surface to promote the photocatalytic degradation.
 |
| Fig. 3 Nitrogen sorption isotherms for (1) GO (2) ZnO/TiO2 (3) TZ-a-RGO (4) amine-RGO. | |
Table 1 Pore characteristics of GO, amine-RGO, ZnO/TiO2 and TZ-a-RGO
Materials |
Surface area (m2 g−1) |
Pore volume (cm3 g−1) |
Pore size (nm) |
GO |
41.24 |
0.064 |
6.23 |
Amine-RGO |
55.62 |
0.305 |
21.37 |
ZnO/TiO2 |
33.52 |
0.1202 |
14.34 |
TZ-a-RGO |
64.40 |
0.213 |
13.25 |
The FTIR spectra were investigated to affirm the process for the preparation of TZ-a-RGO hybrids. Fig. 4 showed the typical spectra of GO, the peaks at 3434 cm−1 and 1408 cm−1 were attributed to O–H stretching and vibration mode of inter-calated water. The characteristic peaks of oxygen groups located at 1228 cm−1, 1624 cm−1 and 1738 cm−1 were in correspondence with epoxy or alkoxy (v(C–O)), and C
O in carboxylic acid and carbonyl moieties (v(carbonyl)), respectively.29 Compared to the FT-IR spectrum of GO, it was clearly seen that the oxygen-containing functional characteristic peaks decrease to a large extent or even disappeared for the amine-RGO and TZ-a-RGO composites, further revealing that the GO was reduced after the solvothermal reduction. In addition, the new band at 1583 cm−1 of TZ-a-RGO was attributed to stretching vibration of N–H (in the C–NH group).30 Pure P25 powder showed two frequency bands around 656 and 527 cm−1, which corresponded to the vibration of Ti–O–Ti bands of anatase and rutile phase. However, in the as-prepared TZ-a-RGO, with the ZnO doping, the band at 656 cm−1 shifted to 669 cm−1. The change indicated that the addition of ZnO affected the titanium surface oxide species, and Zn–O–Ti bonds may have been formed.31,32 The band at around 1125 cm−1 was attributed to the vibration mode of Ti–O band (anatase).33 The results were in agreement with those obtained from TEM analysis.
 |
| Fig. 4 FTIR spectra of GO, amine-RGO, P25, and TZ-a-RGO. | |
In order to describe the photo-absorption behaviors of the TZ-a-RGO nanocomposite, the UV-vis absorption spectrum was recorded and shown in Fig. 5. As a comparison, the absorption spectrum of P25 and ZnO/TiO2 nanocomposites were also conducted at the same conditions. No obvious absorption peaks are detected for P25, indicating a low efficiency for the photo-generation of electron–hole pairs. The absorption edge and band gap energy of these samples were summarized in Table 2. Obviously, compared with P25, TZ-a-RGO showed a large red shift of absorption edge from 392 to 436 nm, and the band gap energy narrowed from 3.17 to 2.92 eV. As a result of the extended photoresponding range of ca. 430–440 nm (corresponding to the violet-blue region in electromagnetic spectrum), a more efficient utilization of UV could be achieved and TZ-a-RGO showed remarkable improvement in the photocatalytic MO over P25 and ZnO/TiO2, as Fig. 8 demonstrates. The significant red shift in optical band energy gap is supposed to be attributed to several factors. First, it comes from the mixture effect of the band gap of the composite semiconductor. When TiO2 with a relative high band gap combines with low band gap ZnO, the band gap of the TZ-a-RGO nanocomposite will be further narrowed, and shifted to a lower energy compared with ZnO and TiO2.34 Second, it is the interfacial coupling effect between ZnO and TiO2.31 Combined with the FT-IR and TEM results, we can conclude that the formation of Ti–O–Zn bonds can play a vital role for red shift. In addition, the presence of NH2-RGO can increase in surface electric charge of the oxide in the TZ-a-RGO nanocomposite35 and facilitate a better distribution of semiconductor crystals to maximize the photo-conversion efficiency.36 As a result of the enlarged light absorption range, TZ-a-RGO nanocomposites are expected to achieved more efficient utilization of the UV and show enhanced photocatalytic activity.
 |
| Fig. 5 UV-vis absorption spectra of P25, ZnO/TiO2, and TZ-a-RGO. | |
Table 2 Absorption edge and band gap energy (Eg) of catalysts
|
P25 |
ZnO/TiO2 |
TZ-a-RGO |
Absorption edge (nm) |
392 |
411 |
436 |
Band gap energy (eV) |
3.17 |
3.05 |
2.96 |
3.2 Adsorption activity of the composite
Isotherm data analysis is significant for describing the adsorption capacity of the adsorbent. In our studies, the adsorption isotherms were stimulated with the help of the Langmuir isotherm and Freundlich isotherm models. The Langmuir isotherm constants were calculated by using the following equations:37,38 |
 | (1) |
|
 | (2) |
where qe (mg g−1) is the amount of MO adsorbed per unit mass of the adsorbent; qm (mg g−1) is the maximum adsorption capacity and the affinity of the binding sites; c0 and ce (mg l−1) is the un-absorbed MO equilibrium concentration and the initial concentration; KL (l mg−1) is the Langmuir isotherm constant. The qm and b were obtained from the intercept and the slop of the equation, respectively (Fig. S1†). The RL value can demonstrated whether the isothermal type is favorable (0 < RL < 1) or unfavorable (RL > 1).
The Freundlich isotherm parameters are defined as follows:39
|
 | (3) |
where
qe and
ce have the same meanings as those in the Langmuir equation;
KF (mg g
−1 (l mg
−1)
1/n) signified the adsorption capacity,
n (dimensionless) related to the adsorption intensity. The
KF and 1/
n were determined from the slop and the intercept of the equation (Fig. S2
†), respectively.
Based on the R2 values (Fig. 6 and Table 3), it can be observed that the Langmuir isotherm model shows a better fit well with the experimental data in comparison to the Freundlich isotherm model, given that the correlation coefficients are close to unity. It has been demonstrated that all the adsorption sites are equivalent and adsorbed molecules don't interact with each other. Furthermore, the dimensionless equilibrium parameter RL has been found to be in the 0–1 range, indicating a favorable adsorption.
 |
| Fig. 6 Adsorption isotherms for MO on the surface of TZ-a-RGO. | |
Table 3 Adsorption constants for MO onto the TZ-a-RGO
Langmuir |
Freundlich |
R2 |
b (l mg−1) |
qm (mg g−1) |
RL |
R2 |
KF (mg (g−1(l mg−1)1/n)) |
n |
0.9974 |
0.05 |
86 |
0.4–0.67 |
0.9775 |
11.97 |
1.5 |
In order to evaluate the adsorption behaviors, the pseudo-first-order and pseudo-second-order kinetic models are expressed as follows:40,41
|
 | (4) |
|
 | (5) |
where
qe (mg g
−1) and
qt (mg g
−1) are the equilibrium adsorption uptake and adsorption uptake (at time
t, min), respectively;
k1 (min
−1) and
k2 (g mg
−1 min
−1) are the rate constants, respectively (Fig. S3 and S4
†). The kinetics of MO adsorption on TZ-a-RGO in
Fig. 7 and the parameters of the regression coefficients
R2 were summarized in
Table 4. It is clearly seen that the
R2 of the pseudo-second-order kinetic equation (
R2 = 0.9938) were greater than that of the pseudo-first-order kinetic equation (
R2 = 0.8539). Furthermore, the experimental
qe (36 mg g
−1) are in accordance with calculated values (40 mg g
−1) obtained through the pseudo-second-order model. The results imply that the kinetics of adsorption obeys a pseudo-second-order model. It was obvious that 38% dye molecules were quickly adsorbed on the surface of TZ-a-RGO after 2 min and the solution obtained equilibrium after 10 min, which 45% MO were adsorbed. It is noteworthy that the reason for the enhanced absorptivity of TZ-a-RGO should not merely originate from the conjugation by π–π stacking between MO and aromatic regions of the graphene, and also assign to the electrostatic attraction that the amine groups of TZ-a-RGO and MO.
 |
| Fig. 7 Adsorption kinetics for MO on the surface of TZ-a-RGO. | |
Table 4 Kinetic parameters for MO adsorption onto TZ-a-RGO
Pseudo-first-order kinetic |
Pseudo-second-order kinetic |
R2 |
k1 |
R2 |
k2 |
0.8539 |
−0.1533 |
0.9938 |
0.0255 |
3.3 Photocatalytic performance of the composite
MO was selected as a model compound for conventional water-soluble azo dyes to evaluate the photocatalytic activity of the TZ-a-RGO. Prior to illumination, the suspension was magnetically stirred for 30 min in the dark to achieve the adsorption equilibrium of the MO on the photocatalyst powders. The TZ-a-RGO exhibits higher adsorption capacity than P25 as well as ZnO/TiO2 nanocrystals. The photocatalytic activity of different composites was then investigated (Fig. 8). Only 40% removal efficiency of MO occurred on the P25 after 60 min under UV illumination, indicating the difficulty in removing MO molecules by the bare TiO2. For all the prepared photocatalysts, the degradation efficiencies were enhanced and particularly, the TZ-a-RGO exhibited better catalytic performances than corresponding to ZnO/TiO2, which might benefit from the advantages of amine-RGO, such as the high absorptivity and efficient charge separation.
 |
| Fig. 8 Photocatalytic degradation of MO over P25, ZnO/TiO2, TZ-a-RGO. | |
The degradation kinetic data were fitted with the Langmuir–Hinshelwood model when the initial concentrations of the adsorbents were low.42,43 The kinetics equation can be assumed as Eq.44
|
 | (6) |
where
k is the rate constant,
c0 is the initial MO concentration (10 mg l
−1);
c1 and
ct are the concentration at reaction time 0,
t, respectively. The reaction rate constants
k shown in Fig. S5,
† it is clearly that the rate constant of TZ-a-RGO drastically increased from 0.00693 min
−1 for the commercial P25 to 0.05658 min
−1 by a factor of 8.2. Comparing with the ZnO/TiO
2, the composite also demonstrated an outstanding photocatalytic activity with an increase in rate constant by about 3.2-folds.
The initial MO concentration is one of the most important parameters controlling the photocatalytic degradation efficiency.45,46 Fig. 9 shows that the photocatalytic degradation efficiencies decreased significantly with the increase of the initial MO concentration. The dependence of the photocatalytic degradation rate on initial dye concentration was also investigated and shown in Table 5. It is obviously that the apparent rate constant k decreased markedly from 0.05658 at 10 mg l−1 to 0.00859 at 20 mg l−1 and then finally to 0.00381 at 30 mg l−1 initial concentration. The presumed reason is that more MO molecules existed in the solution can absorb more photons, therefore less TZ-a-RGO composites can be excited because of the decrease of photons absorption on the surface of composite, which may inhibit the generation of the reactive oxygen species.47 Furthermore, the generation of active radicals on the surface of photocatalyst is reduced at high MO concentration, since the active sites are covered by an excessive number of dye molecules that adsorbed on the surface of TZ-a-RGO.48–50
 |
| Fig. 9 Effect of initial MO concentration on degradation kinetics (pH = 6.02, catalyst dosage = 0.125 g l−1). | |
Table 5 The fitted parameters of photocatalytic kinetics using the Langmuir–Hinshelwood pseudo-first-order kinetics equation
|
MO initial concentration (mg l−1) |
10 |
15 |
20 |
25 |
30 |
R2 |
0.9921 |
0.9921 |
0.9942 |
0.9921 |
0.9660 |
K |
0.05658 |
0.01833 |
0.00859 |
0.00534 |
0.00381 |
Moreover, the TZ-a-RGO exhibited excellent catalytic performance through the degradation of MO at a wide pH range. The results in Fig. 10 showed that the adsorption decolorizing efficiency increased remarkably with the decrease of the pH and even reached 71% at pH = 2.0 (Fig. S6†). That can be attributed to the electrostatic attraction between the positive charge on the surface of the catalyst and MO anions, and the amino groups of RGO in the TZ-a-RGO were more easily protonated at low pH. However, the photodegradation rate was practically a constant under relatively low pH compared with the adsorption rate. When the pH = 6.02, the TZ-a-RGO showed very good photocatalytic activity and reached the highest maximum with a photodegradation efficiency of almost 99% at 60 min. However, when the pH increased to greater than 10, the degradation efficiency markedly decreased. The decrease of MO molecules adsorption onto the surface of photocatalyst can restrain the photocatalytic degradation reaction. A similar effect of pH on MO photodegradation has been observed in previous reported.51
 |
| Fig. 10 Effect of initial pH on MO decolorization (MO concentration: 10 mg l−1, catalyst dosage = 0.125 g l−1). | |
3.4 Enhanced photocatalytic activity mechanism of TZ-a-RGO composites
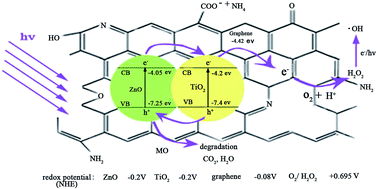
The photocatalytic mechanism of TZ-a-RGO nanocomposite is discussed in detail. In comparison with the P25 and ZnO/TiO2, the TZ-a-RGO exhibit higher photocatalytic activity. This is attributed to three factors: (1) The TZ-a-RGO have larger BET surface area can offer more active adsorption sites and photocatalytic centers, which can enhance photocatalytic activity. (2) Amine groups of the TZ-a-RGO play a vital role that improve the absorption rate and capacity via the electrostatic attraction between the –NH2 functional groups and MO.51 (3) Amine-graphene in the TZ-a-RGO nanocomposite can be used as the electron accepter and transporter.17 According to the data reported on the conduction band (CB) and valence band (VB) of ZnO (−4.05 and −7.25 eV, vs. Vacuum),52 TiO2 (−4.2 and −7.4 eV, vs. Vacuum),53 and the calculated work function of graphene (−4.42 eV, vs. Vacuum),54 the energy levels of these materials follow the order: ZnO(CB)> TiO2(CB)> graphene. As shown in Scheme 1, in the TZ-a-RGO nanocomposite system, the electron could be excited from the VB of ZnO and TiO2 to their CB under UV irradiation, and the photo-induced electrons could transfer from the CB of ZnO via CB of TiO2 to graphene via the percolation mechanism.17,54 Conversely, the hole transfer from the VB of TiO2 to the VB of ZnO. It is noted that graphene, which is an prominent electron acceptor and conductor, has a Fermi level (−0.08 V, vs. NHE), positive to the redox potential of O2/O2˙− (−0.13 V, vs. NHE), but negative to that of O2/H2O2 (+0.695 V, vs. NHE).55,56 This illustrates that the photo-generated electron (e−) which transferred to the graphene cannot thermodynamically react with the dissolved oxygen to produce superoxide anion radicals, but can react with O2 and H+ to produce H2O2.57 The neutral H2O2 species further photodecompose into hydroxyl radicals under UV illumination or react with the photogenerated e− to produce the hydroxyl radicals.58 While the holes are scavenged by the absorbed water to form hydroxyl radicals. Finally, these active species oxidize the MO.36,59,60 In addition as the photodegradation of MO, the adsorption–desorption equilibrium would be broken and more MO molecules transferred from solution to the reaction interface and be degraded into CO2, H2O and other mineralized intermediates. Therefore, there would be a synergetic mechanism of amine-RGO adsorption and ZnO/TiO2 photocatalysis, resulting in an appreciable improvement in photocatalytic oxidation of MO compared to commercial P25.
 |
| Scheme 1 A novel TiO2/ZnO–NH2–reduced graphene oxide (TZ-a-RGO) nanocomposite was successfully prepared and acts as a high-performance platform for efficient photocatalytic removal of methyl orange from water. | |
4. Conclusions
In summary, a facile method for the preparation of TZ-a-RGO nanocomposite was demonstrated using a hydrothermal means. The TZ-a-RGO possessed great absorptivity of dyes, and had the characteristics of fast absorption and photodegradation simultaneously. On the basis of these advantages, TZ-a-RGO exhibited prominent advancement over P25 in the photocatalytic oxidation of MO under irradiation. Moreover, it also demonstrated higher degradation rate than the ZnO/TiO2, mainly due to a giant two dimensional sheet support, which facilitated the higher adsorption capacity of MO and charge transportation. The removal of MO was obtained through a synergistic effect of amine-RGO adsorption and ZnO/TiO2 photocatalysis via the adsorption and photocatalytic degradation experiments. The novel nanocomposites may find prospective applications of environmental photocatalysis.
Acknowledgements
We thank Prof. Dongdong Qin, Guanghui Zhao and Doctor Jianzhi Wang for giving many suggestions on this work.
Notes and references
- M. Saquib and M. Muneer, Desalination, 2003, 155, 255–263 CrossRef.
- A. Mittal, A. Malviya, D. Kaur, J. Mittal and L. Kurup, J. Hazard. Mater., 2007, 148, 229–240 CrossRef CAS PubMed.
- F. Zhao, L. F. Liu, F. L. Yang and N. Q. Ren, Chem. Eng. J., 2013, 230, 491–498 CrossRef CAS PubMed.
- M. A. Martín, I. González, M. Berrios, J. A. Siles and A. Martín, Chem. Eng. J., 2011, 172, 771–782 CrossRef PubMed.
- B. Y. Lan, R. H. Huang, L. S. Li, H. H. Yan, G. Z. Liao, X. Wang and Q. Y. Zhang, Chem. Eng. J., 2013, 219, 346–354 CrossRef CAS PubMed.
- Y. Q. Hu, T. Guo, X. S. Ye, Q. Li, M. Guo, H. N. Liu and Z. J. Wu, Chem. Eng. J., 2013, 228, 392–397 CrossRef CAS PubMed.
- A. K. Gupta, A. Pal and C. Sahoo, Dyes Pigm., 2006, 69, 224–232 CrossRef CAS PubMed.
- F. C. Kent, K. R. Montreuil, R. M. Brookman, R. Sanderson, J. R. Dahn and G. A. Gagnon, Water Res., 2011, 45, 6173–6180 CrossRef CAS PubMed.
- M. M. Khan, S. A. Ansari, M. I. Amal, J. Lee and M. H. Cho, Nanoscale, 2013, 5, 4427–4435 RSC.
- N. M. Flores, U. Pal and E. S. Mora, Appl. Catal., A, 2011, 394, 269–275 CrossRef PubMed.
- Z. Z. Han, L. L. Ren, Z. H. Cui, C. Q. Chen, H. B. Pan and J. Z. Chen, Appl. Catal., B, 2012, 126, 298–305 CrossRef CAS PubMed.
- L. Lin, Y. C. Yang, L. Men, X. Wang, D. N. He, Y. C. Chai, B. Zhao, S. Ghoshroy and Q. W. Tang, Nanoscale, 2013, 5, 588–593 RSC.
- Y. H. Jiang, Y. M. Sun, H. Liu, F. H. Zhu and H. B. Yin, Dyes Pigm., 2008, 78, 77–83 CrossRef CAS PubMed.
- C. A. K. Gouvea, F. Wypych, S. G. Moraes, N. Duran, N. Nagata and P. P. Zamora, Chemosphere, 2000, 40, 433–440 CrossRef CAS.
- M. A. Behnajady, N. Modirshahla and R. Hamzavi, J. Hazard. Mater., 2006, 133, 226–232 CrossRef CAS PubMed.
- N. Serpone, P. Maruthamuthu, P. Pichat, E. Pelizzetti and H. Hidaka, J. Photochem. Photobiol., A, 1995, 85, 247–255 CrossRef CAS.
- P. Y. Dong, Y. H. Wang, L. N. Guo, B. Liu, S. Y. Xin, J. Zhang, Y. R. Shi, W. Zeng and S. Yin, Nanoscale, 2012, 4, 4641–4649 RSC.
- K. P. Loh, Q. L. Bao, P. K. Ang and J. X. Yang, J. Mater. Chem., 2010, 20, 2277–2289 RSC.
- H. Zhang, X. J. Lv, Y. M. Li, Y. Wang and J. H. Li, ACS Nano, 2010, 4, 380–386 CrossRef CAS PubMed.
- T. G. Xu, L. W. Zhang, H. Y. Cheng and Y. F. Zhu, Appl. Catal., B, 2011, 101, 382–387 CrossRef CAS PubMed.
- D. C. Marcano, D. V. Kosynkin, J. M. Berlin, A. Sinitskii, Z. Z. Sun, A. Slesarev, L. B. Alemany, W. Lu and J. M. Tour, ACS Nano, 2010, 4, 4806–4814 CrossRef CAS PubMed.
- Joint Committee on Powder Diffraction Standards Card no. 89–1397.
- V. Houkova, V. Stengl, S. Bakardjieva and N. Murafa, J. Phys. Chem. Solids, 2008, 69, 1623–1631 CrossRef PubMed.
- Joint Committee on Powder Diffraction Standards Card no. 29–1630.
- V. Stengl, D. Popelkova and P. Vlacil, J. Phys. Chem. C, 2011, 115, 25209–25218 CAS.
- D. C. Hurum, A. G. Agrios and K. A. Gray, J. Phys. Chem. B, 2003, 107, 4545–4549 CrossRef CAS.
- G. D. Jiang, Z. F. Lin, C. Chen, L. H. Zhu, Q. Chang, N. Wang, W. Wei and H. Q. Tang, Carbon, 2011, 49, 2693–2701 CrossRef CAS PubMed.
- T. N. Lambert, C. A. Chavez, B. Hernandez-Sanchez, P. Lu, N. S. Bell and A. Ambrosini, J. Phys. Chem. C, 2009, 113, 19812–19823 CAS.
- X. L. Huang, N. T. Hu, R. G. Gao, Y. Yu, Y. Y. Wang, Z. Yang, E. S. W. Kong, H. Wei and Y. F. Zhang, J. Mater. Chem., 2012, 22, 22488–22495 RSC.
- H. L. Ma, Y. W. Zhang, Q. H. Hu, D. Yan, Z. Z. Yu and M. L. Zhai, J. Mater. Chem., 2012, 22, 5914–5916 RSC.
- X. J. Wang, Z. Wu, Y. Wang, W. Wang, X. Wang, Y. J. Bu and J. F. Zhao, J. Hazard. Mater., 2013, 262, 16–24 CrossRef CAS PubMed.
- X. T. Wang, S. H. Zhong and X. F. Xiao, J. Mol. Catal. A: Chem., 2005, 229, 87–93 CrossRef CAS PubMed.
- G. S. P. A. Kambur, Chemosphere, 2014, 105, 152–159 CrossRef PubMed.
- X. D. Yan, C. W. Zou, X. D. Gao and W. Gao, J. Mater. Chem., 2012, 22, 5629–5640 RSC.
- X. J. Liu, L. K. Pan, T. Lv and Z. Sun, J. Colloid Interface Sci., 2013, 394, 441–444 CrossRef CAS PubMed.
- Y. H. Tang, G. Zhang, C. B. Liu, S. L. Luo, X. L. Xu, L. Chen and B. G. Wang, J. Hazard. Mater., 2013, 252–253, 115–122 CrossRef CAS PubMed.
- A. Kurniawan, H. Sutiono, N. Indraswati and S. Ismadji, Chem. Eng. J., 2012, 189–190, 264–274 CrossRef CAS PubMed.
- X. Z. Chu, Y. J. Zhao, Y. H. Kan, W. J. Zhang, S. Y. Zhou, Y. P. Zhou and L. Zhou, Chem. Eng. J., 2009, 152, 428–433 CrossRef CAS PubMed.
- M. Brdar, M. Sciban, A. Takaci and T. Dosenovic, Chem. Eng. J., 2012, 183, 108–111 CrossRef CAS PubMed.
- M. Chairat, S. W. Rattanaphani, J. B. Bremnerc and V. Rattanaphani, Dyes Pigm., 2008, 76, 435–439 CrossRef CAS PubMed.
- Y. S. Ho and G. Mc. Kay, Process Biochem., 1999, 34, 451–465 CrossRef CAS.
- S. Chusaksri, J. Lomda, T. Saleepochn and P. Sutthivaiyakit, J. Hazard. Mater., 2011, 190, 930–937 CrossRef CAS PubMed.
- F. T. Li, Y. Zhao, Y. Liu, Y. J. Hao, R. H. Liu and D. S. Zhao, Chem. Eng. J., 2011, 173, 750–759 CrossRef CAS PubMed.
- X. H. Wang, J. G. Li, H. Kamiyama, Y. Moriyoshi and T. Ishigaki, J. Phys. Chem. B, 2006, 110, 6804–6809 CrossRef CAS PubMed.
- N. Daneshvar, M. H. Rasoulifard, A. R. Khataee and F. Hosseinzadeh, J. Hazard. Mater., 2007, 143, 95–101 CrossRef CAS PubMed.
- T. Z. An, J. B. An, H. Yang, G. Y. Li, H. X. Feng and X. P. Ni, J. Hazard. Mater., 2011, 197, 229–236 CrossRef CAS PubMed.
- S. K. Kansal, M. Singh and D. Sud, J. Hazard. Mater., 2007, 141, 581–590 CrossRef CAS PubMed.
- L. Xu, H. M. Zang, Q. Zhang, Y. Chen, Y. G. Wei, J. H. Yan and Y. H. Zhao, Chem. Eng. J., 2013, 232, 174–182 CrossRef CAS PubMed.
- F. T. Li, Y. Zhao, Y. J. Hao, X. J. Wang, R. H. Liu, D. S. Zhao and D. M. Chen, J. Hazard. Mater., 2012, 239–240, 118–127 CrossRef CAS PubMed.
- L. M. Yang, L. Y. E. Yu and M. B. Ray, Water Res., 2008, 42, 3480–3488 CrossRef CAS PubMed.
- H. Y. Zhu, R. Jiang, Y. Q. Fu, Y. J. Guan, J. Yao, L. Xiao and G. M. Zeng, Desalination, 2012, 286, 41–48 CrossRef CAS PubMed.
- B. J. Li and H. Q. Cao, J. Mater. Chem., 2011, 21, 3346–3349 RSC.
- G. Zhu, L. K. Pan, T. Xu, Q. F. Zhao and Z. Sun, J. Alloys Compd., 2011, 509, 7814–7818 CrossRef CAS PubMed.
- X. Wang, L. Zhi and K. Müllen, Nano Lett., 2008, 8, 323–327 CrossRef CAS PubMed.
- W. Y. Teoh, J. A. Scott and R. Amal, J. Phys. Chem. Lett., 2012, 3, 629–639 CrossRef CAS.
- T. Arai, M. Yanagida, Y. Konishi, Y. Iwasaki, H. Sugihara and K. Sayama, J. Phys. Chem. C, 2007, 111C, 7574–7577 Search PubMed.
- T. Xian, H. Yang, L. J. Di, J. Y. Ma, H. M. Zhang and J. F. Dai, Nanoscale Res. Lett., 2014, 9, 327–335 CrossRef PubMed.
- L. M. Zhang, S. Diao, Y. F. Nei, K. Yan, N. Liu, B. Y. Dai, Q. Xie, A. Reina, J. Kong and Z. F. Liu, J. Am. Chem. Soc., 2011, 133, 2706–2713 CrossRef CAS PubMed.
- B. Jiang, C. Tian, Q. Pan, Z. Jiang, J. Q. Wang, W. Yan and H. Fu, J. Phys. Chem. C, 2001, 115, 23718–23725 CrossRef.
- K. X. Li, J. J. Xiong, T. Chen, L. S. Yan, Y. H. Dai, D. Y. Song, Y. Lv and Z. X. Zeng, J. Hazard. Mater., 2013, 250–251, 19–28 CrossRef CAS PubMed.
Footnote |
† Electronic supplementary information (ESI) available. See DOI: 10.1039/c4ra09227a |
|
This journal is © The Royal Society of Chemistry 2014 |
Click here to see how this site uses Cookies. View our privacy policy here.