Suppressing phase retraction and coalescence of co-continuous polymer blends: effect of nanoparticles and particle network

Xi-Qiang Liu, Qian-Yu Wang, Rui-Ying Bao, Wei Yang*, Bang-Hu Xie and Ming-Bo Yang
College of Polymer Science and Engineering, Sichuan University, State Key Laboratory of Polymer Materials Engineering, Chengdu, 610065, Sichuan, China. E-mail: weiyang@scu.edu.cn.

Received 23rd August 2014 , Accepted 26th September 2014

First published on 29th September 2014


Abstract

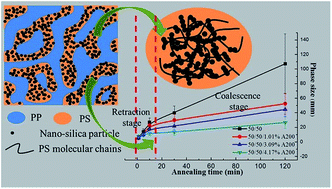
The morphologies of polymer blends generated during processing are usually unstable and morphology coarsening often occurs in the melt state, so suppressing the morphology coarsening is crucial to obtain polymer blends with tailored and stable structure and properties. Here, we report the morphology coarsening behavior of a co-continuous polypropylene/polystyrene (PP/PS) blend, with and without nano-silica particles, subjected to quiescent annealing in the melt state. The filled nano-silica particles were controlled to selectively distribute in the PS phase and formed a rheological particle network at a concentration of 8 wt% relative to the mass of the PS phase. A significant coarsening, which can be divided into two stages with different coarsening rates, was observed for the pure blend. Real-time monitoring of the coarsening process showed that the morphology coarsening process proceeded via retraction of elongated domains first and then coalescence of the retracted domains. The filled nano-silica particles were found to be able to suppress the coarsening process, which was demonstrated to be achieved by slowing down the retraction process of elongated domains. It was also found that the suppression effect of nano-silica particles heavily depended on the particle concentration and when a particle network formed, the suppression effect was more prominent. A stabilization mechanism, based on the phase deformation being closely related to the movement of polymer molecular chains, was proposed to expound the role of the introduced particles. When a particle network structure was formed, the movement of polymer molecular chains was significantly retarded and the corresponding phase deformation became difficult, leading to suppressed retraction process of the elongated domains and the whole phase coarsening phenomenon.


1. Introduction

Polymer blending is an easy and effective way to obtain new materials with desired properties. However, due to the huge difference in molecular structures and the huge molecular weight, most polymer pairs are immiscible. As a result, phase separation is easily observed and under processing conditions, e.g., shear and/or elongational stress field and thermal history, polymer blends often exhibit various morphologies.1–3 Two basic types of morphologies, i.e. dispersed phase/matrix morphology or sea-island morphology and co-continuous morphology, are often observed in immiscible polymer blends.4,5 The properties of immiscible polymer blends are highly dependent on the morphology formed during processing. For polymer blends, one of the challenges is that the generated morphologies during processing are usually in a non-equilibrium state. A lot of studies have shown that the phase morphology undergoes significant coarsening during thermal annealing in quiescent conditions or during secondary processing, which leads to a huge increase in phase size.6–11

The phase morphology of polymer blend coarsens via various patterns, viz. coalescence, and/or breakup, retraction and end-pinching.12–17 It has been revealed that the coarsening process is intensely dependent on the blend composition and blend morphology. For the blends with initial droplet/matrix morphology, phase coarsening takes place via coalescence of droplets through which the interfacial area is reduced and hence the free energy of the system is minimized.17–20

In polymer blends with a co-continuous morphology, Willemse et al.9 showed that significant coarsening can occur either by breakup or retraction of phase domains at a low concentration of the minor phase. Above a critical concentration (about 30 vol%) of the minor phase, breakup did not take place and coarsening was found to take place by retraction only, leading to that the co-continuous structure was maintained but the phase sizes increased under annealing. Veenstra et al.21–23 found that the co-continuous morphology showed a linear increase in phase size with annealing time, and the coarsening rate was dependent on the interfacial tension and the zero-shear viscosity of the blends. Yuan et al.24,25 also found that the phase size increased linearly with annealing time when studying the coarsening behavior of co-continuous polystyrene (PS)/poly(L-lactide) (PLLA) blends and PS/high-density polyethylene (HDPE) blends and proposed that the driving force for the coarsening process during quiescent annealing was a capillary pressure effect. By combining Tomotika's theory26 and McMaster's work,27 they proposed that the growth rate of the distortion amplitude could be directly related to the coarsening rate, which were found to be controlled by the interfacial tension, the zero shear viscosity of the surrounding medium and a dimensionless growth rate (Ω) from Tomotika theory.

The properties of polymer blends are highly dependent on phase morphologies.28–30 However, the coarsening phenomenon makes it difficult to control the morphology of polymer blends, and so, it is difficult to control the ultimate properties of polymer blends. As a consequence, to obtain polymer blends with tailored and stable properties, one of the prerequisites is to maintain the morphology stability. So suppressing the phase coarsening of polymer blends is worth to be investigated.

Many studies have reported that copolymers can suppress or slow down the coarsening of co-continuous polymer blends. Mekhilef et al.31 found that the addition of styrene–(hydrogenated butadiene)–styrene (SEBS) triblock copolymer slowed down the coarsening of co-continuous morphologies in PS/polyethylene (PE) (50/50) blend. Harrats et al.32 reported that polybutadiene-b-polystyrene block copolymer effectively stabilized the co-continuous morphology in a model PE/PS blend. They also compared the efficiency of a tapered diblock and a triblock copolymer in stabilizing co-continuous PS/LDPE blend against annealing and found that the tapered diblock copolymer exhibited a more efficient stabilization effect than the triblock copolymer.33 Yuan et al. also got a similar conclusion when studying the coarsening behavior of hydrogenated SEBS compatibilized co-continuous PS/HDPE blend.25 Omonov et al.34 found that the coarsening behavior of reactively compatibilized co-continuous polypropylene (PP)/PS blends with PP-graft-PS was significantly retarded during thermal annealing. In co-continuous PS/poly(ether-ester) thermoplastic elastomers (SEBS) blends, Veenstra et al.21,22 found that annealing of the blends above the order–disorder transition (ODT) temperature of the copolymer led to a significant increase of the phase size, but when the annealing was carried out below the ODT, the coarsening effect was severely limited or even totally stopped.

The basic strategy to suppress the phase coarsening in polymer blends in previous studies is to reduce the interfacial tension between the components by introducing copolymers. Veenstra's work indicates that probably physical cross-links in one component of co-continuous blend can also suppress the coarsening process. In their work, the cross-links were constructed with the residual crystals in the melt. It is curious that whether an analogous structure, such as the network constructed by inorganic particles, can play a similar role in polymer blends. In fact, similar effect of inorganic particles has been extensively reported in low viscosity emulsions. Ramsden and Pickering35,36 reported that insoluble particles effectively suppressed the coalescence process and stabilized the emulsion. In emulsion of two liquids, the interfacial tension between components was unaffected in the presence of particles.37,38 So, the most likely stabilization mechanism is that the particles located at the interface act as a mechanical barrier to prevent the coalescence process.39,40

For polymer blends, a lot of studies have reported that the sizes of dispersed domains can be reduced by the introduction of inorganic particles. It is generally attributed to the compatibilizing effect of inorganic particles due to their distribution at the interface, which could either reduce the interfacial tension of components or act as a solid barrier inhibiting the coalescence process.41–48 Based on these facts, the idea of using inorganic particles to stabilize the morphology of polymer blends seems to be probable. However, until now, the coarsening behavior of inorganic particles filled polymer blends, especially polymer blends with co-continuous morphology, has not caught enough attention although these materials have been widely investigated and industrially utilized.

Gubbels et al.49 reported that the co-continuous morphology of PE/PS was stabilized toward post-thermal treatment by carbon black (CB), owing to that the selective distribution of CB in PE phase increased the viscosity of PE phase and thus slowing down the phase coalescence process. Zhang et al.50 recently reported that the incorporation of silica nanoparticles into PS/PLLA blends effectively improved the morphology stability and also attributed it to the increased viscosity of PLLA phase. However, a comprehensive study of the role of nanoparticles played during the coarsening process is still lacking. In our previous study, we have showed that nanoparticles can suppress the phase coarsening of co-continuous PA6/ABS blends. However, the used hydrophobic nano-silica particles mainly distributed in ABS phase and at the interface between the two phases. So the phase stabilization effect of nano-silica particles came from not only their retardment towards the movement of molecular chains, but also their effective separation of the two phases.51 It is still hard for us to distinguish the effect of the two factors.

The objective of this work is to evaluate, in detail, the potential of using inorganic particles to suppress the coarsening behavior of polymer blends with a co-continuous morphology under quiescent melt annealing. PP/PS blend was adopted as a model polymer blend and the inorganic particles used were nano-silica particles. With an optical microscope equipped with a hot stage and a photographic camera, the phase changing during coarsening was directly observed in real-time. Also by other characterization methods, a deeper understanding of the stabilization mechanism of particles was proposed from the point view of molecular chain movement.

2. Experimental section

2.1. Materials and sample preparation

The materials used were two commercial polymers: isotactic polypropylene (iPP, T30 s, with a weight–average molecular weight of 387[thin space (1/6-em)]000 and a polydipersity of 3.6, Kunlun petrochemical co., LTD) and PS (PG-383M, with a weight–average molecular weight of 287[thin space (1/6-em)]000 and a polydipersity of 2.34, Zhenjiang chimei chemical co., LTD). The nano-silica particles used here were fumed silica, hydrophilic Aerosil A200, purchased from Evonik Degussa Corporation, Germany. The particles have an average diameter of 12 nm and a hydroxyl density of 2.5 –OH per nm2.

PP and PS were dried in a vacuum oven at 80 °C for 12 h before mixing. The melt compounding was conducted in a torque rheometer (XSS-300, Shanghai Kechuang Rubber Plastics Machinery Set Ltd., China) at 190 °C. To get a selective distribution of the nano-silica particles in PS phase, a two-step process was adopted. First, the nano-silica particles was mixed with PS at 30 rpm for 2 minutes, and then mixed with PP at 50 rpm for another 5 minutes. For all the filled PP/PS blends, the weight ratio of PP and PS was controlled to be 50/50, and the concentrations of filled nano-silica particles relative to the mass of PS phase were 1, 2, 4, 6 and 8 wt% (so the concentrations of filled nano-silica particles in the whole blends were 0.502, 1.01, 2.04, 3.09 and 4.17 wt%), respectively. PS composites filled with nano-silica particles were also prepared under the same processing conditions.

2.2. Rheological tests

Rheological measurements were performed on a stress controlled dynamic rheometer (AR2000ex, TA Instruments, USA) equipped with 25 mm parallel plates. Disk samples for rheological analysis were compression-molded at 190 °C and 10 MPa for 3 min. The thickness and diameter of samples were 2 and 25 mm, respectively. All the tests were carried out with a gap of 1.4 mm at 190 °C. Strain sweep was performed in the strain range of 0.1–100% at 1 Hz to determine the linear viscoelastic region of the samples, and the results showed that the linear viscoelastic region of all the blends up to 20%. Dynamic frequency sweep was performed from 0.00628 to 628 rad s−1 within the linear viscoelastic regime. Stress relaxation tests were performed at a given strain of 20% to measure the shear stress σ(t) as a function of time and the linear stress relaxation modulus G(t), which was obtained using G(t) = σ(t)/γ0.

2.3. Morphology observation

Annealing treatment was carried out on a compression molding machine. The samples obtained by melt compounding were annealed for various periods of time at 190 °C. To avoid morphology changing induced by press, no pressure was applied during the annealing process. After annealing, the samples were quenched with cold water. The annealed samples were cryo-fractured in liquid nitrogen. Contrast between the phases was achieved by immersing the samples in xylene for 6 h to selectively remove the PS phase. The obtained samples were sputtered with gold to avoid charge accumulation and then observed at 20 kV using a scanning electron microscopy (SEM, JEOL JSM-5900LV, Japan). The statistics of the phase size on SEM images was done by using Image-Pro Plus image analysis software. Here we took the diameter of the holes, formed due to the extraction of PS phase, as the phase size and at least 150 diameter values at different locations were counted to calculate the average phase size. Transmission electron microscopy (TEM, Philips CM120) was also used to reveal the distribution of nano-silica particles in the blends. Cross sections of the compression-molded blends were obtained by slicing the samples into thin films of about 50 nm in thickness.

The real-time monitoring of the coarsening process was conducted on an Olympus BX51 polarizing optical microscope (Olympus Co., Tokyo, Japan) equipped with a PixeLINK CCD camera and a hot stage (LINKAM THMS 600). Firstly the blends were compression-molded into thin films at 190 °C and 10 MPa. The films obtained were placed between two glasses fixed on the hot stage and quickly heated to 190 °C at a rate of 30 °C min−1. After holding at 190 °C for 1 min, the gap between two glasses was decreased to 100 μm. Then the morphology changing of the blends was recorded with a video camera.

3. Results

3.1. Distribution of nano-silica particles

The properties of inorganic particle filled polymer blends are greatly influenced by the distribution of inorganic particles. At the equilibrium state, thermodynamics governs the distribution of nano-silica particles. Elias et al.41 studied the distribution of hydrophilic A200 nano-silica particles in 70/30 PP/PS blend and found that when the three components were compounded at the same time, hydrophilic A200 silica particles were found essentially in PS droplets, but when the hydrophilic A200 silica was mixed with PP first and subsequently mixed with PS, a migration of silica particles from the PP phase toward the PS phase was found. Their results indicated that the hydrophilic A200 nano-silica particles showed more affinity towards the amorphous PS phase. In fact, in our previous study we also showed that in PP/PS blends with droplet/matrix morphology, the hydrophilic A200 nano-silica particles selectively distributed in the dispersed PS phase.52

To guarantee that the filled nano-silica particles were selectively distributed in only one phase and to prevent the migration of the filled nano-silica particles during processing, we mixed nano-silica particles with PS first and then with PP. Firstly, as shown in Fig. 1a and c, the 4.17 wt% nano-silica particle filled blend shows a co-continuous morphology, with strips or domains of two phases interpenetrating with each other. As to the distribution, from the magnified micrograph in Fig. 1b, it is found that the filled nano-silica particles are selectively distributed in only one phase. After extracting PS phase, Fig. 1d shows that most aggregates of nano-silica particles are located in the holes left by the extracted PS phase. In the remained PP phase, almost no particles are found. All of these results demonstrated that the nano-silica particles selectively in PS phase in PP/PS blends. What's more, from the TEM image in Fig. 1e, it is found that the nano-silica particles present in the form of aggregations rather than single particle in PS phase. The aggregations of particles are very easy to form a particle network structure, which will be discussed later.


image file: c4ra09138h-f1.tif
Fig. 1 SEM (a–d) and TEM (e) micrographs of 4.17 wt% nano-silica particle filled PP/PS (50/50) blend. (a) and (b) show the sample without extraction of PS phase while (c) and (d) show the sample after PS phase has been extracted.

3.2. Rheology

Melt rheology has been proved to be powerful to probe the dispersion of particles in polymer melt or the morphology of polymer blends, and the rheological responses of polymer blends are highly determined by the components, compositions, phase morphology and interfacial interactions.53–55 Due to the selective distribution of the filled nano-silica particles in PS phase, examining the rheological response of nano-silica particle filled PS composites is necessary. Fig. 2 shows the storage modulus (G′), loss modulus (G′′), loss tangent (tan[thin space (1/6-em)]δ) and complex viscosity (η*) as a function of frequency for PS and nano-silica particle filled PS composites at 190 °C.
image file: c4ra09138h-f2.tif
Fig. 2 (a) Storage modulus, (b) loss modulus, (c) tan[thin space (1/6-em)]δ and (d) complex viscosity as a function of frequency for PS and nano-silica particle filled PS composites.

At low frequencies, polymer melt usually exhibits a characteristic terminal behavior with G′ ∝ ω2 and G′′ ∝ ω.56–58 Here, the exponents of Gvs. ω and G′′ vs. ω are 1.35 and 0.88 for pure PS, lower than the theoretical values due to the polydispersity of commercial polymer.59 With the addition of nano-silica particles, as shown in Fig. 2a and b, G′ and G′′ increase at low frequencies, and the increase of G′ is more significant than that of G′′. With the increasing particle concentration, the slopes of the modulus curves decrease, showing a weakened frequency dependence. For 8 wt% nano-silica filled composite, a frequency independent G′ plateau is found at low frequencies, exhibiting a pseudo-solid-like behavior. This is usually attributed to the formation of a hydrodynamically percolated particle network of the filled particles.41,56–58,60–67

tan[thin space (1/6-em)]δ is also usually used to characterize the viscoelasticity of polymer melt. As shown in Fig. 2c, pure PS shows a typical behavior of viscoelastic liquid with tan[thin space (1/6-em)]δ decreasing with increasing frequency. With the particle concentration increasing, the tan[thin space (1/6-em)]δ values decrease prominently at low frequencies, indicating an increasing elastic response. When particle concentration reaches 8 wt%, the tan[thin space (1/6-em)]δ value is less than 1 at low frequencies and a tan[thin space (1/6-em)]δ peak appears on the curve, indicating elastic response dominates the melt. This reveals that the filled nano-silica particles percolated in the melt.

For the complex viscosity, pure PS shows a Newtonian plateau at low frequencies and a shear-thinning behavior at high frequencies. With the addition of nano-silica particles, the Newtonian region becomes increasingly weaker and an obvious shear-thinning behavior over the whole measured frequency range is shown at high particle concentration, indicating the existence of a yield stress.58,59,68–72 The development of a finite yield stress, which can also be manifested by a diverging in η* vs. G* plot, is often associated with the formation a percolated particle network, too.57,58 As shown in Fig. 3a, for 8 wt% nano-silica particle filled PS composite, a divergence in the value of η* is observed, consistent with the inferences of a percolated particle network from the frequency dependence of G′ and tan[thin space (1/6-em)]δ.


image file: c4ra09138h-f3.tif
Fig. 3 (a) Complex viscosity versus complex modulus and (b) weighted relaxation time spectra for PS and nano-silica particle filled PS composites.

The zero-shear viscosities (η0) of PS and PS composites are obtained by fitting the viscosity curve in Fig. 2d using Carreau–Yasuda-equation73,74 and the results are listed in Table 1. It should be pointed that the errors of the fitted results get bigger with increasing particle concentration. Obviously, a huge increase in the zero-shear viscosity is seen with the particle concentration increasing, especially when a particle network is formed at high particle concentration. The increase in viscosity due to the addition of particles often reflects a retarded movement or relaxation behavior of the polymer molecular chains, which can be well manifested in the weight relaxation time spectra75–77 (the H(λ)*λλ curve) as shown in Fig. 3b. With the addition of nano-silica particles, the relaxation peak shifts towards the direction with longer time. At high concentration of nano-silica particles, the relaxation peak cannot be detected in the measured time scale, indicating a much longer relaxation time, which definitely indicates that the relaxation of PS chains was significantly retarded when a particle network is formed.

Table 1 Zero-shear viscosities of pure PS and nano-silica particles filled PS composites
Sample PP PS PS/1% A200 PS/2% A200 PS/4% A200 PS/6% A200 PS/8% A200
η0 (Pa s) 1.42 × 10⁴ 7.85 × 10⁴ 8.83 × 10⁴ 9.91 × 10⁴ 2.42 × 10⁵ 8.32 × 10⁵ 2.74 × 10⁶


Fig. 4 shows the G′ and η* as a function of frequency for nano-silica particle filled PP/PS (50/50) blends. The zero-shear viscosities of the blends with and without nano-silica particles obtained from Fig. 4b according to Carreau–Yasuda-equation73,74 are listed in Table 2. The particle filled PP/PS blends show a similar rheological behavior to that of particle filled PS composites and the blend with 4.17 wt% nano-silica particles also exhibits a pseudo-solid-like behavior, indicating the presence of a particle network. According to foregoing microscopic observation, the filled nano-silica particles selectively distributed in PS phase, so for 4.17 wt% nano-silica particle filled blend, the concentration of nano-silica particles in PS phase is 8 wt%, at which the filled nano-silica particles percolate in PS phase. In fact, this is a typical double-percolation behavior as proposed by Sumita,78,79 according to whom there are two types of heterogeneous distributions of particles in filled polymer blends. One case is that the filled particles predominantly distribute in one phase of the blend matrix and the other is that the filled particles distribute concentratedly at the interface of the two polymers. Here, because of the co-continuous morphology, the percolation of the nano-silica particles in PS phase means that they are percolated in the whole PP/PS blend. So the rheological response about the particle network in the filled blends is the manifestation of the particle network in PS phase.80–82 The particle network in PS phase can be directly observed by the TEM micrographs in Fig. 1e, in which agglomerates of nano-silica particles are found and the nano-silica particles in the agglomerates are easy to form a particle network.


image file: c4ra09138h-f4.tif
Fig. 4 (a) Storage modulus and (b) complex viscosity as a function of frequency for nano-silica particle filled PP/PS (50/50) blends.
Table 2 Zero-shear viscosities of pure and nano-silica particles filled PP/PS (50/50) blends
Sample 50/50 (50/50)/0.502% A200 (50/50)/1.01% A200 (50/50)/2.04% A200 (50/50)/3.09% A200 (50/50)/4.17% A200
η0 (Pa s) 4.24 × 10⁴ 7.28 × 10⁴ 1 × 10⁵ 2.4 × 10⁵ 2.9 × 10⁵ 6.19 × 10⁵


3.3. Effects of nano-silica particles on the phase coarsening

Fig. 5 shows the morphology of PP/PS (50/50) blends filled with 0, 1.01, 3.09 and 4.17 wt% nano-silica particles after annealing at 190 °C for various time. The SEM micrographs show only PP phase after PS phase has been extracted by xylene. For pure blend, upon annealing, the phase size increases significantly with increasing annealing time. However, the initial co-continuous morphology is preserved and both phases are continuous throughout the annealing process. This coarsening process has been reported for many 50/50 polymer blends.21–25,32–34 The difference is in the rate of the coarsening process, which is thought to be determined by the interfacial tension and the zero shear rate viscosities.21–23 A similar coarsening process is also observed for 1.01 wt% and 3.09 wt% nano-silica particle filled PP/PS (50/50) blends, but the phase size increasing is slowed down compared with pure blend. When the nano-silica concentration is as high as 4.17 wt%, the coarsening process is greatly suppressed and the morphology stability is greatly improved.
image file: c4ra09138h-f5.tif
Fig. 5 SEM micrographs of pure PP/PS (50/50) blends and 1.01, 3.09, 4.17 wt% nano-silica particle filled blends annealed for various time at 190 °C.

Fig. 6 shows the statistics of phase sizes for pure and nano-silica filled PP/PS (50/50) blends after annealing at 190 °C for various time. For pure blend, the phase size increases from initial 6.7 μm to 107.3 μm after annealing for 120 min, showing a severe phase coarsening. The coarsening curve can be divided into two stages with different coarsening rates: a fast coarsening process before 10 min and a relatively slow coarsening process after that. Such a two-stage coarsening has been reported in co-continuous PP/PS blend34 and other co-continuous polymer blends83–85 even though it is reported by some researchers that there exists only one stage of coarsening with the phase size increasing linearly with time.21–25,32,33 López-Barrón and Macosko85 proposed that the decrease in coarsening rate in the second stage was due to a continuous reduction of the global curvature of the interface. The addition of nano-silica particles slowed down the coarsening process, leading to a smaller coarsening rate. For 4.17 wt% nano-silica filled 50/50 PP/PS blend, the change in phase size is small during melt annealing, indicating that the coarsening process is significantly suppressed. By fitting the phase size with annealing time, the coarsening rates of all the blends in the first stage are obtained and listed in Table 3. The results assuredly show that the coarsening process can be significantly suppressed by the filled nano-silica particles, which selectively distributed in PS phase, and the efficiency in suppressing coarsening process is greatly dependent on the concentration of the filled nano-silica particles.


image file: c4ra09138h-f6.tif
Fig. 6 Phase sizes of pure and nano-silica particle filled PP/PS (50/50) blends after annealing at 190 °C.
Table 3 Coarsening rates determined experimentally (kex) compared with the calculated theoretical values (kYuan and kVeenstra)a
Sample 50/50 (50/50)/1.01 wt% A200 (50/50)/3.09 wt% A200 (50/50)/4.17 wt% A200
a The theoretical values are calculated according to eqn (1) and (2). The interfacial tension values are chosen according to our previous study52 and the used viscosity values of components or the blends are from Tables 1 and 2. The ratios between the theoretical values and the experimental are also shown.
kex (m s−1) 3.78 × 10⁻⁸ 3.32 × 10⁻⁸ 2.34 × 10⁻⁸ 7.68 × 10⁻⁹
kYuan (m s−1) 4.44 × 10⁻⁹ 2.5 × 10⁻⁹ 5.69 × 10⁻¹⁰ 2.75 × 10⁻¹⁰
kVeenstra (m s−1) 2.48 × 10⁻⁹ 1.75 × 10⁻⁹ 8.0 × 10⁻¹⁰ 3.84 × 10⁻¹⁰


By combining Tomotika's theory26 and McMaster's study,27 Yuan et al.24 proposed that the driving force for the coarsening process during quiescent annealing was a capillary pressure effect. The growth rate of the distortion amplitude, dα/dt taken from Tomotika's analysis for capillary instabilities, can be directly related to the phase size growth, dR/dt. The coarsening rate k can be calculated as follows:

 
image file: c4ra09138h-t1.tif(1)
in which α0/R0 is the ratio of the original amplitude to the fiber radius and ηC the viscosity of the blend. McMaster27 considered α0/R0 as a constant and an average value about 0.5 was reported by many researchers. According to the viscosity ratio, the Ω values are taken as 0.5, 0.4, 0.2 and 0.2 for pure, 1.01, 3.09 and 4.17 wt% nano-silica filled blends, respectively. The calculated coarsening rates for all the blends are listed in Table 3, and they are compared with the experimental coarsening rate values obtained from Fig. 7.


image file: c4ra09138h-f7.tif
Fig. 7 Morphology evolution of pure PP/PS (50/50) blend observed by an optical microscope during annealing at 190 °C.

Veenstra et al.23 adopted a simplified equation to calculate the coarsening rate with the assumption that the rate of the coarsening process was proportional to the interfacial tension and inversely proportional to the viscosity, that is,

 
image file: c4ra09138h-t2.tif(2)
where ηe is the effective viscosity of the blends and c a dimensionless factor. They found that a selected value of c = 0.07 for the calculations was able to obtain an agreement with experimental data.

The calculated coarsening rate values for all the blends are also showed in Table 3. In all the cases, the experimental coarsening rate values are larger than the theoretical coarsening rates obtained either from Yuan's equation or Veenstra's equation. This is because in their studies, the coarsening process was regarded as a one-stage process and the coarsening rate was calculated based on the phase size increasing during the whole annealing time. Here, however, we found that the coarsening process can be divided into two stages corresponding to different coarsening mechanism and the first stage of coarsening process was apparently quicker than the second stage. So the coarsening rates calculated in the first stage are found to be much larger.

3.4. Real-time monitoring of the coarsening process

By annealing the blends at high temperature and then observing the morphologies by SEM, a significant coarsening process is found for pure blend and the coarsening process is markedly suppressed for the filled blends. However, in this way, we can only observe the final morphology formed after annealing, but cannot give the detail morphology changing process during annealing. With an optical microscope equipped with a hot stage, we are able to observe the real-time coarsening process during annealing.

Fig. 7 shows the real-time coarsening process of pure PP/PS (50/50) blends observed with an optical microscope when annealing at 190 °C. In all the micrographs, a phase-separated structure is observed. In the beginning, the two phases with varied phase sizes are interpenetrating and are hard to distinguish due to the very small initial phase size. In a short time, the highly elongated domains retract into domains with smaller aspect ratios. After that, the retraction process becomes slow and almost all the elongated domains are retracted completely within 1 h. Coalescence is also found throughout the coarsening process. But before 30 min, the coalescence is less prominent since the size of elongated domains is small and the space between the domains is relatively big. Only numerous tiny droplets between the domains are found to constantly fuse into big domains, leading to a continuous growth of the domain size. After 30 min, with the increasing of domain size, the space between the domains decreases. The coalescence becomes prominent due to that the big domains approach and merge together. As a result, a co-continuous morphology with big phase size is formed. From the real-time observation, we can get a better understanding of the two-stage coarsening shown in Fig. 6. The two stages of coarsening process probably reflect two kinds of coarsening patterns. The initial retraction of elongated domains is a very quick process, due to which the phase size increases significantly in a short time. After that, the retraction becomes slow, and since most elongated domains have retracted, the phase morphology coarsens mainly by the coalescence of the retracted domains. This is a relatively slow process and as a result, the increase of phase size becomes less significant.

A similar coarsening process is also found for the blends filled with low concentration of nano-silica particles (not shown here) but with slower coarsening rate due to the suppression effect of the filled nano-silica particles. This suppression effect becomes prominent for 4.17 wt% nano-silica filled PP/PS (50/50) blend, as shown in Fig. 8. The size of the elongated domains is found to be little changed even after annealing for 2 hours. In this process, the elongated domains just become a little thicker via weak retraction and coalescence of tiny droplets. However, the retraction of the elongated domains is limited during melt annealing and the later coalescence of big retracted domains does not occur. As a result, the coarsening process is significantly suppressed. The real-time observation clearly shows that the coarsening process of the filled blend is suppressed and it is achieved by suppressing the retraction of the elongated domains and the later coalescence of big domains.


image file: c4ra09138h-f8.tif
Fig. 8 Morphology evolution of 4.17 wt% nano-silica particle filled PP/PS (50/50) blend observed on an optical microscope when annealing at 190 °C.

4. Discussion

For polymer blends with co-continuous morphology, both phases are continuous and form an interpenetrating structure. In this case, each phase can be regarded as fibers with various lengths and thicknesses. Willemse showed that for polymer blends with fibrillar morphologies, depending on the aspect ratio, the fibres coarsen via breakup or retraction.8 Stone et al.15 reported that breakup of fibres via sinusoidal distortions only occurs in the case of highly extended fibers. The critical length of the fibres above which breakup occurs has been found to be closely related to the viscosity ratio (p) of the two phases.15,16 The existence of such a critical length can be understood by Tomotika theory for the breakup of cylindrical threads surrounded by a second fluid under the action of the interfacial tension and viscous forces.26 For cylindrical thread with an initial diameter of D and a length of L, from calculations of surface area of the sinusoidally disturbances only when the wavelength of the disturbance (λ) is larger than the original circumference (πD), the interfacial area decreases with the amplitude of the disturbance increasing.74 The disturbances grow exponentially with time and the growth rate is proportional to the dimensionless growth rate, Ωλ,p.26 Ωλ,p shows a maximum (Ωm) for a certain λm, which is the dominant wavelength where the disturbance grows fastest. The dominant wavelength is usually expressed as a dominant wave number, Xm = πD/λm. It is asserted that breakup occurs only when the length of a fiber exceeds this dominant wavelength. In this case, the critical aspect ratio, image file: c4ra09138h-t3.tif, below which a fiber cannot breakup is given by:86
 
image file: c4ra09138h-t4.tif(3)

The time necessary for breakup of a fiber can be calculated as:

 
image file: c4ra09138h-t5.tif(4)
in which ηm is the viscosity of the matrix phase, σ the interfacial tension, Ω the dominant wave number and α0 the initial disturbance on the surface of the fiber. According to Table 1, the viscosity ratio of PP and PS is 5.5. In this case, the dominant wave number is about 0.5 and the critical aspect ratio is about 6.3 for pure blend according to eqn (1). The α0 normally has a theoretical value of 10−9 m. The interfacial tension between PP and PS at 190 °C has been found to be 1.4 mN m−1 in our previous study.52 So for a fiber with an initial diameter of 5 μm, the complete breakup can be achieved within 71 s. During real-time monitoring, however, breakup of the elongated domains can hardly be observed. The reasons may lie in two aspects. Firstly, before the real-time monitoring of the coarsening process, the samples must be compressed into thin films to facilitate observation, and on the hot stage, they were subjected to a second compression to become thinner, during which the samples were held in the melt state for several minutes and the breakup process may has completed. Secondly, the required critical aspect ratio of fibres for breakup should be higher than 6.3 according to eqn (1) at a viscosity ratio of 5.5. However, a co-continuous structure contains a large number of interpenetrating fibers with various lengths and thicknesses, which provide numerous branch points along the “cylindrical thread”. Under this circumstance, the average distance between two adjacent branch points is generally smaller than the dominant wavelength. As a result, most fibers do not break up during annealing. With the addition of nano-silica particles, the viscosity ratio increases, and the required critical dominant wavelength increases significantly, which makes it more difficult for the fibers to break up.

For moderately extended fibers, retraction occurs. The time necessary for the complete retraction of a fiber into a sphere can be calculated with:87

 
image file: c4ra09138h-t6.tif(5)

The retraction time for a fiber with an initial diameter of 5 μm and the critical aspect ratio of 6.3 in each blend is calculated according to eqn (5) and the results are listed in Table 4. For pure PP/PS blend, the complete retraction time is about 2800 s. This corresponds well with the results of optical observation, where the retraction process of the elongated domains had been found to be completed within 1 h. With the addition of nano-silica particles, the interfacial tension is less affected due to their selective distribution in PS phase. Since the viscosity of PP phase is constant, the retraction time of the filled blends will be only dependent on the viscosity of PS phase according to eqn (5). With the concentration of filled nano-silica particles increasing, the viscosity of PS phase increases and then the retraction time increases. For 4.17 wt% nano-silica particle filled blend, the complete retraction time is as long as 20.3 h. This explains why the retraction of fibers for 4.17 wt% nano-silica particle filled blend cannot be observed during real-time monitoring. In other words, the retraction process was significantly slowed down or suppressed.

Table 4 The retraction time for all the blends calculated by eqn (3)
Sample 50/50 (50/50)/1.01 wt% A200 (50/50)/2.04 wt% A200 (50/50)/3.09 wt% A200 (50/50)/4.17 wt% A200
Retraction time (s) 2800 3400 77[thin space (1/6-em)]100 25[thin space (1/6-em)]500 83[thin space (1/6-em)]000


The retraction process of the elongated domains plays an important role during coarsening process and it can be regarded as a relaxation process. It has been shown that stress relaxation experiments can act as a microstructural probe for immiscible polymer blends.88–93 Fig. 9a shows the typical curves of the stress relaxation modulus G(t,γ) as a function of time for the two components, pure and nano-silica particles filled PP/PS (50/50) blends at 190 °C. It is found that the two components, PP and PS, present a one-stage relaxation and the relaxation time of PS is longer than PP. For pure 50/50 PP/PS blend, the relaxation curve contains three stages: a first fast relaxation due to the relaxation of the pure components; a second slower relaxation, evidenced by the presence of a plateau, which corresponds to the interface relaxation due to the deformed phases;88,92–95 and a third faster one. With the addition of nano-silica particles, the relaxation modulus increases and the slope of the relaxation curve decreases, indicating that the applied strain becomes more difficult to relax. As shown in Table 5, the time needed when the stress relaxed to 1 Pa increases from 4130 s for pure blend to 45[thin space (1/6-em)]900 s for 4.17 wt% nano-silica particle filled blend. It is also found that the blend only shows one stage relaxation when the particle concentration is high. The disappearance of the second relaxation does not mean the disappearance of interface relaxation. It is because the modulus contribution from the interface becomes negligible compared with the modulus contribution from the polymer components. Due to the selective distribution of the filled nano-silica particles in PS phase, the increase in modulus contribution from the components most likely comes from PS phase.


image file: c4ra09138h-f9.tif
Fig. 9 Stress relaxation modulus G(t,γ) as a function of time for nano-silica particles filled (a) 50/50 PP/PS blends and (b) PS composites at a temperature of 190 °C.
Table 5 Relaxation time of PP, PS, pure and nano-silica particles filled PP/PS (50/50) blends
Sample PP PS 50/50 (50/50)/1.01 wt% A200 (50/50)/3.09 wt% A200 (50/50)/4.17 wt% A200
Relaxation time (s) 224 981 4130 1660 9570 45[thin space (1/6-em)]900


Fig. 9b shows the stress relaxation modulus G(t,γ) as a function of time for pure PS and nano-silica particle filled PS composites at 190 °C. In all cases, only one stage relaxation is found. With the addition of nano-silica particles, the relaxation modulus increases and the slope of the relaxation curve decreases, showing a slowed relaxation of PS phase, which indicates that the relaxation of the applied strain becomes difficult. The slowed relaxation of PS phase can be understood from two aspects: firstly, the addition of nano-silica particles increases the modulus of PS melt; secondly, the movement of PS molecular chains is significantly retarded, especially at high concentration when the particles form a particle network. According to Table 6, the time needed when the stress relaxed to 1 Pa for 8 wt% particle filled PS composite is 4 orders higher than that of pure PS. Considering that the relaxation of PP phase is not affected, it is concluded that the slowed relaxation of nano-silica particles filled blends results from the slowed relaxation of PS phase.

Table 6 Relaxation time of nano-silica particles filled PS composites
Sample PS PS/1% A200 PS/2% A200 PS/4% A200 PS/6% A200 PS/8% A200
Relaxation time (s) 981 814 1660 1830 95[thin space (1/6-em)]800 1.96 × 10⁷


Fig. 10 presents a schematic diagram of the suppression effect of nano-silica particles towards the morphology coarsening in a co-continuous PP/PS blend. According to previous analysis, the filled nano-silica particles form a network at a concentration of 8 wt% in PS. In this case, the movement of PS molecular chains is highly retarded, and the relaxation of the PS molecular chains becomes difficult when subjected to deformation. Since the deformation of the phases involves the movement of molecular chains at the micro-scale, the retarded movement of molecular chains makes it difficult for the phases to deform at the macro-scale. For PP/PS blends with co-continuous morphology, the morphology coarsening can be divided into two stages: the retraction of elongated domains at first and the later coalescence of the retracted domains, in which the first stage is more closely related to the movement of the molecular chains. The retraction process of the elongated domains is essentially a relaxation process of the molecular chains. In pure blend, the relaxation of the PS molecular is easy when subjected to deformation, leading to a quick retraction process of the elongated domains. However, when the introduced nano-silica particles form a network structure, the movement of PS molecular is significantly retarded, leading to that the relaxation of the elongated PS domains becomes difficult. That is, the retraction of elongated PS domains is suppressed. Due to the interpenetrating structure of two phases, the suppressed retraction of PS domains causes an overall suppression of the morphology coarsening of the blend.


image file: c4ra09138h-f10.tif
Fig. 10 Schematic diagram of the suppression effect of nano-silica particles towards the morphology coarsening in co-continuous PP/PS blends.

5. Conclusions

This paper reported a detailed study on the suppression effect of nano-silica particles on the coarsening behavior of co-continuous PP/PS blend under annealing in melt state. A significant coarsening process was observed for pure blend and a suppressed coarsening process was found for nano-silica particles filled blends. Real-time monitoring indicated that the coarsening occurred mainly by the initial retraction of the elongated domains and the later coalescence of the retracted domains, leading to a two stages of coarsening process. The nano-silica particles can suppress the coarsening process and the suppression effect was found to be prominent at high nano-silica concentration when they formed a particles network. It is found that the nano-silica particles can effectively slow the retraction process of the elongated domains, and thus suppress the whole coarsening process. Considering that the filled nano-silica particles selectively distributed in PS phase and formed a particles network at high concentration, it is proposed that the retarded movement of PS molecular chains due to the particles network structure leads to that the relaxation of the elongated PS domains becomes difficult, that is, the retraction process is suppressed.

Acknowledgements

The authors are grateful to the National Natural Science Foundation of China (Grant nos 51422305 and 51121001), the MOST (Grant no 2012CB025902) and the Innovation Team Program of Science & Technology Department of Sichuan Province (Grant 2013TD0013). Mr Chao-liang Zhang, working at the State Key Laboratory of Oral Medicine of China, was also acknowledged for his kind help in FE-SEM observations.

References

  1. K. Binder and D. Stauffer, Phys. Rev. Lett., 1974, 33, 1006–1009 CrossRef.
  2. I. S. Polios, M. Soliman, C. Lee, S. P. Gido, K. Schmidt-Rohr and H. H. Winter, Macromolecules, 1997, 30, 4470–4480 CrossRef CAS.
  3. G. Sato, S. Nishitsuji and J. J. Kumaki, J. Phys. Chem. B, 2013, 117, 9067–9072 CrossRef CAS PubMed.
  4. S. Chaput, C. Carrot, M. Castro and F. Prochazka, Rheol. Acta, 2004, 43, 417–426 CrossRef CAS.
  5. J. M. Li and B. D. Favis, Macromolecules, 2002, 35, 2005–2016 CrossRef CAS.
  6. Y. Y. Shi, W. B. Zhang, J. H. Yang, T. Huang, N. Zhang, Y. Wang, G. P. Yuan and C. L. Zhang, RSC Adv., 2013, 3, 26271–26282 RSC.
  7. A. G. C. Machiels, K. F. J. Denys, J. Van Dam and A. Posthuma de Boe, Polym. Eng. Sci., 1996, 36, 2451–2466 CAS.
  8. R. C. Willemse, E. J. J. Ramaker, J. Van Dam and A. Posthuma de Boe, Polymer, 1999, 40, 6651–6659 CrossRef CAS.
  9. R. C. Willemse, E. J. J. Ramaker, J. Van Dam and A. Posthuma de Boe, Polym. Eng. Sci., 1999, 39, 1717–1725 CAS.
  10. J. J. Elmendorp and A. K. van der Vegt, Polym. Eng. Sci., 1986, 26, 1332–1338 CAS.
  11. U. Sundararaj and C. W. Macosko, Macromolecules, 1995, 28, 2647–2657 CrossRef CAS.
  12. I. Fortelný and A. Živný, Polymer, 1995, 36, 4113–4118 CrossRef.
  13. I. Fortelný and J. Kovar, Polym. Compos., 1988, 9, 119–124 CrossRef.
  14. I. Fortelný, Chem. Listy, 2013, 107, 791–797 Search PubMed.
  15. H. A. Stone, B. J. Bentley and L. G. Leal, J. Fluid Mech., 1986, 173, 131–158 CrossRef CAS.
  16. H. A. Stone and L. G. Leal, J. Fluid Mech., 1989, 198, 399–427 CrossRef CAS.
  17. I. M. Lifshitz and V. V. Slyozov, J. Phys. Chem. Solids, 1961, 19, 35–50 CrossRef.
  18. E. D. Siggia, Phys. Rev. A, 1979, 20, 595–605 CrossRef CAS.
  19. I. Forteln, A. Živný and J. Juza, J. Polym. Sci., Part B: Polym. Phys., 1999, 37, 181–187 CrossRef.
  20. W. Yu, C. X. Zhou and T. Inoue, J. Polym. Sci., Part B: Polym. Phys., 2000, 38, 2378–2389 CrossRef CAS.
  21. H. Veenstra, J. Barbara, J. Van Dam and A. Posthuma de Boer, Polymer, 1999, 40, 6661–6672 CrossRef CAS.
  22. H. Veenstra, J. Van Dam and A. Posthuma de Boer, Polymer, 1999, 40, 1119–1130 CrossRef CAS.
  23. H. Veenstra, J. Van Dam and A. Posthuma de Boer, Polymer, 2000, 41, 3037–3045 CrossRef CAS.
  24. Z. H. Yuan and B. D. Favis, AIChE J., 2005, 51, 271–280 CrossRef CAS.
  25. Z. H. Yuan and B. D. Favis, J. Polym. Sci., Part B: Polym. Phys., 2006, 44, 711–721 CrossRef CAS.
  26. S. Tomotika, Proc. R. Soc. London, Ser. A, 1935, 150, 322–337 CrossRef.
  27. L. P. McMaster, Adv. Chem. Ser., 1975, 142, 43–65 CrossRef CAS.
  28. D. R. Paul and J. W. Barlow, Polymer, 1984, 25, 487–494 CrossRef CAS.
  29. L. A. Utracki, Polym. Eng. Sci., 1995, 35, 2–17 CAS.
  30. M. Gao, Z. J. Ren and S. K. Yan, J. Phys. Chem. B, 2012, 116, 9832–9837 CrossRef CAS PubMed.
  31. N. Mekhilef, B. D. Favis and P. J. Carreau, J. Polym. Sci., Part B: Polym. Phys., 1997, 35, 297–308 CrossRef.
  32. C. Harrats, S. Blacher, R. Fayt, R. Jermôe and Ph. Teyssié, J. Polym. Sci., Part B: Polym. Phys., 1995, 33, 801–811 CrossRef CAS.
  33. C. Harrats, R. Fayt, R. Jermôe and S. Blacher, J. Polym. Sci., Part B: Polym. Phys., 2003, 41, 202–216 CrossRef CAS.
  34. T. S. Omonov, C. Harrats, G. Groeninckx and P. Moldenaers, Polymer, 2007, 48, 5289–5302 CrossRef CAS.
  35. W. Ramsden, Proc. R. Soc. London, Ser. A, 1903, 72, 156–164 CrossRef CAS.
  36. S. U. Pickering, J. Chem. Soc., Abstr., 1908, 91–92, 2001–2021 Search PubMed.
  37. T. Okubo, J. Colloid Interface Sci., 1995, 171, 55–62 CrossRef CAS.
  38. E. Vignati and P. Piazza, Langmuir, 2003, 19, 6650–6656 CrossRef CAS.
  39. B. P. Binks, Curr. Opin. Colloid Interface Sci., 2002, 7, 21–41 CrossRef CAS.
  40. E. J. Stancik, M. Kouhkan and G. G. Fuller, Langmuir, 2004, 20, 90–94 CrossRef CAS PubMed.
  41. L. Elias, F. Fenouillot, J. C. Majeste and Ph. Cassagnau, Polymer, 2007, 48, 6029–6040 CrossRef CAS.
  42. L. Elias, F. Fenouillot, J. C. Majeste, P. Alcouffe and Ph. Cassagnau, Polymer, 2008, 49, 4378–4385 CrossRef CAS.
  43. S. S. Ray, S. Pouliot, M. Bousmina and L. A. Utracki, Polymer, 2004, 45, 8403–8413 CrossRef CAS.
  44. Q. Zhang, H. Yang and Q. Fu, Polymer, 2004, 45, 1913–1922 CrossRef CAS.
  45. R. Jeremy, J. R. Austin and M. Kontopolou, Polym. Eng. Sci., 2006, 46, 1491–1501 Search PubMed.
  46. M. Si, T. Araki, H. Ade, A. L. D. Kilcoyne, R. Fisher, J. C. Sokolov and M. H. Rafailovich, Macromolecules, 2006, 39, 4793–4801 CrossRef CAS.
  47. J. S. Hong, H. Namkung, K. H. Ahn, S. J. Lee and C. Kim, Polymer, 2006, 47, 3967–3975 CrossRef CAS.
  48. X. Q. Liu, Y. Wang, W. Yang, Z. Y. Liu, Y. Luo, B. H. Xie and M. B. Yang, J. Mater. Sci., 2012, 47, 4620–4631 CrossRef CAS.
  49. F. Gubbels, S. Blacher, E. Vanlathem, R. Jérôme, J. R. Deltour, O. F. Brouers and Ph. Teyssibé, Macromolecules, 1996, 28, 1559–1566 CrossRef.
  50. M. Z. Zhang, Y. J. Huang, M. Q. Kong, H. Zhu, G. L. Chen and Q. Yang, J. Mater. Sci., 2012, 47, 1339–1347 CrossRef CAS.
  51. X. Q. Liu, R. H. Li, R. Y. Bao, W. R. Jiang, W. Yang, B. H. Xie and M. B. Yang, Soft Matter, 2014, 10, 3587–3596 RSC.
  52. X. Q. Liu, Z. Y. Sun, G. Q. Qi, R. Y. Bao, W. Yang, B. H. Xie and M. B. Yang, RSC Adv., 2014, 4, 41059–41068 RSC.
  53. J. F. Palierne, Rheol. Acta, 1990, 129, 204–214 CrossRef.
  54. D. Graebling, R. Muller and J. F. Palierne, Macromolecules, 1993, 26, 320–329 CrossRef CAS.
  55. S. Steinmann, W. Gronski and C. Friedrich, Rheol. Acta, 2002, 41, 77–86 CrossRef CAS.
  56. R. V. Krishnamoorti, R. A. Vaia and E. P. Giannelis, Chem. Mater., 1996, 8, 1728–1734 CrossRef CAS.
  57. C. A. Mitchell, J. L. Bahr, S. Arepalli, J. M. Tour and R. Krishnamoorti, Macromolecules, 2002, 35, 8825–8830 CrossRef CAS.
  58. C. A. Mitchell and R. Krishnamoorti, Macromolecules, 2007, 40, 1538–1545 CrossRef CAS.
  59. P. Pötschke, M. Abdel-Goad, I. Alig, S. Dudkin and D. Lellinger, Polymer, 2004, 45, 8863–8870 CrossRef.
  60. R. V. Krishnamoorti and E. P. Giannelis, Macromolecules, 1997, 30, 4097–4102 CrossRef CAS.
  61. P. Pötschke, T. D. Fornes and D. R. Pau, Polymer, 2002, 43, 3247–3255 CrossRef.
  62. Y. H. Song and Q. Zheng, Polymer, 2010, 51, 3262–3268 CrossRef CAS.
  63. N. Jouault, P. Vallat, F. Dalmas, S. Said, J. Jestin and F. Boué, Macromolecules, 2009, 42, 2031–2340 CrossRef CAS.
  64. V. Geiser, Y. Leterrier and J. A. E. Månson, Macromolecules, 2010, 43, 7705–7712 CrossRef CAS.
  65. K. Ke, Y. Wang, X. Q. Liu, J. Cao, Y. Luo, W. Yang, B. H. Xie and M. B Yang, Composites, Part B, 2012, 43, 1425–1432 CrossRef CAS.
  66. X. Huang, M. N. Feng and X. B. Liu, RSC Adv., 2014, 4, 4985–4992 RSC.
  67. J. N. Martins, T. S. Bassani, G. M. Barra and R. V. B. Oliveira, Polym. Int., 2011, 60, 430–435 CrossRef CAS.
  68. D. C. H. Cheng, Rheol. Acta, 1986, 25, 542–554 CrossRef CAS.
  69. A. Guimont, E. Beyou, G. Martin, P. Sonntag and P. Cassagnau, Macromolecules, 2011, 44, 3893–3900 CrossRef CAS.
  70. S. A. Khan and R. K. Prud'homme, Rev. Chem. Eng., 1987, 4, 205–270 CAS.
  71. N. S. Enikolopyan, M. L. Fridman, I. O. Stalnova and V. L. Popov, Adv. Polym. Sci., 1990, 96, 1–67 CrossRef CAS.
  72. T. McNally, P. Pötschke, P. Halley, M. Murphy, D. Martin, S. E. J. Bell, G. P. Brennan, D. Bein, P. Lemoine and J. P. Quinn, Polymer, 2005, 46, 8222–8232 CrossRef CAS.
  73. P. Carreau, Trans. Soc. Rheol., 1972, 16, 99–127 CrossRef CAS.
  74. K. Yasuda, R. C. Armstrong and R. E. Cohen, Rheol. Acta, 1981, 20, 163–178 CrossRef CAS.
  75. A. R. Davies and R. S. Anderssen, J. Non-Newtonian Fluid Mech., 1997, 73, 163–179 CrossRef CAS.
  76. H. H. Winter, J. Non-Newtonian Fluid Mech., 1997, 68, 225–239 CrossRef CAS.
  77. P. H. P. Macaúbas and N. R. Demarquette, Polymer, 2001, 42, 2543–2554 CrossRef.
  78. M. Sumita, K. Sakata, S. Asai, K. Miyasaka and H. Nakagawa, Polym. Bull., 1991, 25, 265–271 CrossRef CAS.
  79. M. Sumita, K. Sakata, Y. Hayakawa, S. Asai, K. Miyasaka and M. Tanemura, Colloid Polym. Sci., 1992, 270, 134–139 CAS.
  80. Y. J. Li and H. Shimizu, Macromolecules, 2008, 41, 5339–5344 CrossRef CAS.
  81. S. Bose, A. R. Bhattacharyya, A. R. Kulkarni and P. Pötschke, Compos. Sci. Technol., 2009, 69, 365–372 CrossRef CAS.
  82. C. G. Ma, D. Y. Xi and M. Liu, J. Compos. Mater., 2013, 47, 1153–1160 CrossRef CAS.
  83. A. Pyun, J. R. Bell, K. H. Won, B. M. Weon, S. K. Seol, J. H. Je and C. W. Macosko, Macromolecules, 2007, 40, 2029–2035 CrossRef CAS.
  84. C. R. López-Barrón and C. W. Macosko, Langmuir, 2009, 25, 9392–9404 CrossRef PubMed.
  85. C. R. López-Barrón and C. W. Macosko, Soft Matter, 2010, 6, 2637–2647 RSC.
  86. R. C. Willemse, Polymer, 1999, 40, 2175–2178 CrossRef CAS.
  87. C. J. Carriere, A. Cohen and C. B. Arends, J. Rheol., 1989, 33, 681–689 CrossRef CAS.
  88. I. Vinckier, P. Moldenaers and J. Mewis, J. Rheol., 1996, 40, 613–631 CrossRef CAS.
  89. I. Vinckier, J. Mewis and P. Moldenaers, Rheol. Acta, 1997, 36, 513–523 CrossRef CAS.
  90. K. Okamoto, M. Takahashi, H. Yamane, H. Kashihara, H. Watanabe and T. Masuda, J. Rheol., 1999, 43, 951–965 CrossRef CAS.
  91. M. Iza and M. Bousmina, J. Rheol., 2000, 44, 1363–1384 CrossRef CAS.
  92. M. Yee, A. M. C. Souza, T. S. Valera and N. R. Demarquette, Rheol. Acta, 2009, 48, 527–541 CrossRef CAS.
  93. K. Okamoto, M. Takahashi, H. Yamane, H. Kashihara, H. Watanabe and T. Masuda, J. Rheol., 1999, 43, 951–965 CrossRef CAS.
  94. P. H. P. Macaúbas, H. Kawamoto, M. Takahashi, K. Okamoto and T. Takigawa, Rheol. Acta, 2007, 46, 921–932 CrossRef.
  95. Y. D. Lv, Y. J. Huang, M. Q. Kong, H. Zhu, Q. Yang and G. X. Li, Rheol. Acta, 2013, 52, 355–367 CrossRef CAS.

This journal is © The Royal Society of Chemistry 2014
Click here to see how this site uses Cookies. View our privacy policy here.