Capillarity-driven (self-powered) one-dimensional photonic crystals for refractometry and (bio)sensing applications

S. Surdoa, F. Carpignanob, L. M. Strambinia, S. Merlob and G. Barillaro*a
aDipartimento di Ingegneria dell'Informazione, Università di Pisa, via G. Caruso 16, 56122 Pisa, Italy. E-mail: g.barillaro@iet.unipi.it; Fax: +39 050 2217 522; Tel: +39 050 2217 601
bDipartimento di Ingegneria Industriale e dell'Informazione, Università di Pavia, via Ferrata 1, 27100 Pavia, Italy

Received 21st August 2014 , Accepted 25th September 2014

First published on 26th September 2014


Abstract

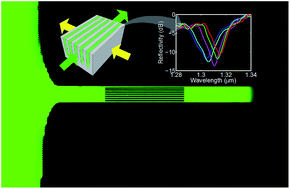
In this work, we advance the state-of-the-art knowledge on photonic crystals by demonstrating the effective and reliable operation of vertical one-dimensional photonic crystals by capillarity, i.e. without the use of external pumps, for self-powered refractometry and label-free (bio)sensing applications. As a proof-of-concept, an all-silicon self-powered drop-and-measure platform exploiting a vertical one-dimensional photonic crystal as a sensing element is fabricated and tested by the capillary infiltration of both ethanol–water mixtures (used as the benchmark for refractometry) and Bovine Serum Albumin (BSA) aqueous solutions at different BSA concentrations (used as the benchmark for biosensing). Excellent analytical performance is achieved for both refractometry and biosensing, in terms of reproducibility and linearity, as well as sensitivity and limit of detection, thus paving the way towards a novel class of self-powered drop-and-measure platforms for chemical/biochemical point-of-care analysis by exploiting the photonic crystals operating under capillary action as label-free transducers.


Introduction

One-dimensional (1D) photonic crystals (PhCs), as well as 2D and 3D PhC structures, have been largely and successfully used for label-free chemical and biochemical sensing,1 due to their high-sensitivity to small changes in both the dielectric constant and thickness of the materials composing the PhC structure itself.2–4 In spite of their high-sensitivity, the delivery of liquids either over2 or through3,5 the PhC structure has so far been carried out by the use of external pumps (pressure-driven operation), which has limited the applications of PhCs as sensing elements in self-powered platforms for a point-of-care analysis.

Capillary microfluidics, which exploits surface tension to handle/move liquids, is a powerful approach enabling the realization of self-powered fluidic platforms for a wide range of applications, from optofluidics, e.g. optical device tuning, to lab-on-chip, e.g. biochemical analysis.6,7 Drop-and-measure optofluidic platforms exploit capillary microfluidics to bring the liquid of interest to the optical transducer, thus enabling either optical measurement of peculiar liquid parameters, e.g. the refractive index, or optical detection of specific biological analytes, e.g. C-Reactive Protein (CRP), without any connection to the fluidic peripheral equipment.8–12 The drop-and-measure concept also allows the reduction of volume and waste of biological samples, power dissipation and size of the device, while increasing portability and enabling a true point-of-care operation.

In this work, the synergistic use of capillarity and photonic crystals for both refractometry and label-free biosensing applications is successfully demonstrated, both from a theoretical and experimental point of view. This bridges the gap between pressure-driven photonic crystal structures and capillary-driven sensing platforms by successfully combining high-sensitivity PhCs with self-powering capillary networks, thus advancing the state-of-the-art knowledge on both the fields, and also with respect to our former work on this subject,3 which mainly addressed the pressure-driven operation of vertical 1D PhCs for (bio)sensing.

As a proof-of-concept, a capillary-driven drop-and-measure platform, integrating a vertical one-dimensional photonic crystal as label-free sensing element, is both fabricated and tested. The fabrication is performed by the deep-etching of silicon through electrochemical micromachining technology. The capillary-flow of liquids over time is investigated through time-resolved measurements and validated through analytical modeling. Optical characterization is carried out by monitoring changes in the reflection spectrum of 1D PhC upon capillary infiltration with ethanol–water mixtures (used as the benchmark for refractometry) and Bovine Serum Albumin (BSA) aqueous solutions at different BSA concentrations (used as the benchmark for biosensing). Excellent analytical performance of the platform is demonstrated under the capillary-action operation for both the refractometry and biosensing applications in terms of reproducibility and linearity, as well as sensitivity and limit of detection.

Design of 1D PhC drop-and-measure platform

Vertical silicon/air 1D PhCs consist of a spatial repetition (in the micrometer scale, when operated in the near-infrared region) of high-aspect-ratio silicon walls and air-gaps (Fig. 1a). The pressure-driven flow of liquids in the air-gaps (fluidic path) is commonly used to induce the modification of the PhC optical properties, which is exploited for both refractometry and label-free (bio)sensing purposes through the measurement of the reflection or transmission signals perpendicular to the silicon wall surface (optical path). The spontaneous (pump-free) flow of liquids into PhC air-gaps can be also achieved by capillarity, once the 1D PhC structure is integrated into a larger microfluidic channel. Each single air-gap of the 1D PhC behaves as an independent rectangular channel with a smaller width and in turn, a higher (negative, if referred to the atmospheric pressure) capillary pressure with respect to the main microchannel, which enables the spontaneous motion of liquids from the main microchannel to the PhC air-gaps (for wettable silicon surfaces with contact angle <90°).
image file: c4ra09056j-f1.tif
Fig. 1 1D PhC self-powered drop-and-measure platform. (a) Schematic representation of a vertical silicon/air 1D PhC in which the fluidic path through the air gaps and optical path perpendicular to silicon walls are highlighted. (b) Drop-and-measure platform exploiting a 1D PhC operating under capillary-action as a label-free sensing element.

Fig. 1b sketches a self-powered drop-and-measure platform in which a 1D PhC is exploited as a label-free sensing element. The 1D PhC is connected to two large reservoirs by two microfluidic channels that are used to effectively infiltrate the 1D PhC air-gaps with liquid by capillary action. The optical path is perpendicular to the fluidic path and allows for the free-space interrogation of the 1D PhC structure (as well as for the positioning/alignment of readout fibers in front of the 1D PhC, if needed3). Either a glass or polymer slab with inlet/outlet ports is used as the cover. The platform makes use of a very simple though functional capillary microfluidic network in which the liquid experiences abrupt changes in the channel cross-section and, in turn, in the capillary pressure that controls the liquid flow. Specifically, the capillary pressure abruptly decreases from the reservoir (at the atmospheric pressure) to the inlet microchannel and to the air-gaps of the 1D PhC, and then it rapidly increases in the output microchannel and returns to the atmospheric pressure in the output reservoir.13,14 Such a capillary pressure profile allows the spontaneous infiltration of the liquid dropped in the reservoir to the inlet microchannel, the PhC structure, and then to the outlet microchannel. Eventually, the liquid flow ceases at the end of the output microchannel, which works as a capillary retention-valve owing to its 90-degrees end-corners,15 thus allowing liquid retention in the PhC air-gaps for periods long enough to allow the incubation of biomolecules in the PhC as well as to carry out the optical measurements of PhC reflection/transmission properties upon infiltration.

The platform is designed to be symmetric with respect to the 1D PhC structure, and therefore it can operate under capillarity in both the directions, left-to-right and right-to-left.

Fabrication and characterization of the 1D PhC drop-and-measure platform

Two 1D PhC drop-and-measure platforms of the type reported in Fig. 1b are simultaneously integrated on the same chip. The two platforms feature a 1D PhC with the same spatial period 8 μm, air-gap width 5 μm, length 300 μm, and height 90 μm, but with different number of air-gaps n, namely, 8 and 12. The 1D PhC is connected to two large reservoirs (2000 μm × 2000 μm) by two microfluidic channels with the same length 250 μm, height 90 μm, but with different widths w, namely, 61 and 101 μm for the two platforms. The optical path has a width of 300 μm and height of 90 μm for both the platforms.

The fabrication of the platforms is carried out by electrochemical micromachining (ECM) technology,16 according to the technological process detailed in ref. 3. The starting material is n-type silicon of orientation (100), with a thin (100 nm thick) silicon dioxide layer on top. The layout of the platform to be fabricated is patterned on a photoresist layer by standard lithography, transferred to the silicon dioxide layer by buffered HF (BHF) etching through the photoresist mask, replicated into the silicon surface by potassium hydroxide (KOH) etching through the oxide mask, and finally grooved into the silicon bulk by back-side illumination electrochemical etching (BIEE) in aqueous electrolytes containing traces (5% by vol.) of HF. A sketch of the main technological steps of the fabrication process is reported in Fig. S1 (ESI). Fig. 2 shows the scanning electron microscopy (SEM) images of the 1D PhC drop-and-measure platform with n = 12, at different magnifications. In Fig. 2a, the top-view of the whole platform is shown, in which it is possible to discriminate the 1D PhC integrated in the middle of optical and fluidic paths. Fig. 2b (top-view) and 2c (bird-eye-view) show magnifications of the 1D PhC, in which it is possible to realize the high accuracy in microfabrication and the high quality of the silicon surfaces.


image file: c4ra09056j-f2.tif
Fig. 2 SEM images of the 1D PhC self-powered drop-and-measure platform. (a) Top-view of the whole platform showing the 1D PhC, which is exploited as a label-free sensing element operating under capillary-action, in the middle between the optical and fluidic paths. (b and c) Top-view (b) and bird-eye-view (c) magnifications of the 1D PhC structure.

After fabrication, the platform is subjected to Piranha treatment (H2SO4 (95–98%)–H2O2 (30%) = 3[thin space (1/6-em)]:[thin space (1/6-em)]1 (by vol) for 15 minutes at room temperature) in order to modify the chemistry of the silicon surfaces from Si–H to Si–OH, thus switching from hydrophobic to hydrophilic surfaces.17 The effectiveness of the Piranha treatment is verified by measuring the contact angles of flat silicon surfaces after both HF and Piranha treatments by the standard static sessile drop method, which yields contact angles of 58.4° ± 4.3° and 3.2° ± 0.3°, respectively.

Mixtures of water and ethanol at different concentrations (ethanol from 0% to 80% (by vol) with step 20%) containing 0.15 mg ml−1 of fluorescein are used to investigate the capillary flow of liquids in the platform through the use of a fluorescence microscope equipped with a high-speed (36 fps) camera. For all the tested mixtures, a calibrated volume of 0.4 μl of liquid is dropped into one of the reservoirs. The liquid quickly infiltrates the first microchannel (about 1 s for water) connecting the reservoir with the 1D PhC, and then the 1D PhC (about 0.2 s for water) and the second microchannel (about 3 s for water). Eventually, the liquid flow ceases at the end of the second microchannel, thus retaining the liquid in the 1D PhC structure for optical measurements (>30 min for water). An average time of 4.2 s is required to fully infiltrate the platform with water. A typical time-resolved sequence of fluorescence microscopy images, showing the capillary flow of water in the platform, is reported in Fig. 3. The capillary pressure, speed, and position of the liquid/air meniscus along both the main microchannel and the PhC integrated within it can be analytically calculated starting from the basic equations on capillarity,13–15 once the geometrical dimension of the channel, chemistry termination of silicon surfaces, and liquid to be injected are defined. The experimental capillary infiltration dynamics of the platform well agrees with theoretical capillary infiltration dynamics when the dimension, surface roughness, and surface chemistry of both the microchannels connecting the 1D PhC to the reservoirs and the PhC structure itself are taken into account, as detailed in the next section “Modeling of capillary infiltration of the 1D PhC drop-and-measure platform” ESI.


image file: c4ra09056j-f3.tif
Fig. 3 Time-resolved capillary infiltration of the 1D PhC self-powered drop-and-measure platform. (a) Bright-field microscopy image and (b–f) fluorescence microscopy images before (a) and after (b–f) dropping 0.4 μl of water containing 0.15 mg ml−1 of fluorescein in the left-hand-side reservoir, at different times. Images (b–f) clearly highlight capillary flow of water within the platform: infiltration of the microchannel on the left (b and c); infiltration of the 1D PhC structure (d); infiltration of the microchannel on the right and stop of the liquid flow at the microchannel end (e and f).

The optical characterization of the drop-and-measure platform is carried out by measuring the reflection spectra of the 1D PhC structure upon capillary infiltration with different liquid solutions. Specifically, ethanol–water mixtures with different concentrations of ethanol are used as the benchmark for refractometry applications; Bovine Serum Albumin (BSA) solutions in water at different BSA concentrations are used as the benchmark for (bio)sensing applications.

A bidirectional 2 × 2 single mode fiberoptic coupler with a 50[thin space (1/6-em)]:[thin space (1/6-em)]50 coupling ratio is used to carry broadband radiation toward the 1D PhC and to redirect the back reflected light toward the monochromator input of an optical spectrum analyser. A pigtail style focuser with aspheric lens connected at the output port of the coupler is used as readout termination to generate a low divergence beam yielding a 50 μm diameter spot (area under investigation) on the 1D PhC at a working distance of about 23.5 mm. All of the employed components use standard telecommunication optical fibers (9/125 core/cladding diameter) with FC connectors. The unused output port of the coupler is terminated with an APC/FC connector to avoid spurious back reflections. The drop-and-measure platform is placed on an xyz precision micropositioner, whereas the readout lens is secured on a kinematic mount for optics. A white light source (WLS, Tungsten lamp) with approximately constant power density in the wavelength range 1.0–1.7 μm is preliminary used to measure the reflection spectrum of the 1D PhC in water over a large wavelength interval (resolution bandwidth RB = 10 nm). A superluminescent diode (SLED) with a Gaussian emission spectrum centred at about 1.3 μm (full width half maximum FWHM = 75 nm), for which the fabricated 1D PhC structure filled with water-based solutions features a reflectivity notch, is used to finely investigate (RB = 70 pm) the reflection properties of the 1D PhC upon capillary infiltration with different liquid mixtures. A schematic of the fiber-optic setup used for carrying out the reflectivity measurements on the drop-and-measure platform is shown in Fig. S2 (ESI).

For all the tested mixtures, a calibrated volume of 0.4 μl of liquid is dropped into one of the reservoirs, and then the liquid readily infiltrates the 1D PhC structure and the reflectivity spectrum of the 1D PhC is acquired at several sampling times. For each mixture, the procedure is repeated several times such as to infer on both the single-drop and drop-to-drop reproducibility of the measurements.

Benchmark tests for refractometry applications are carried out using ethanol–water mixtures with ethanol concentrations ranging from 0% to 80% with a step of 20%. Fig. 4a shows the typical reflectivity spectra, upon SLED excitation, of the 1D PhC of the platform after capillary infiltration with different ethanol–water mixtures. A red shift of the notch wavelength position is apparent, which can be explained in terms of the increased refractive indices of the mixtures as the ethanol concentration increases. Fig. 4b reports the calibration curve of the platform for the ethanol–water mixtures, which is the notch wavelength position (mean value and standard deviation) versus the refractive index of the mixtures infiltrated in the PhC structure. Each point represents the notch wavelength of a Lorentzian fit of the experimental reflectivity spectra. The refractive index values of the different water–ethanol mixtures are estimated using the Lorentz–Lorentz law.18 The analytical performance of the platform is evaluated in terms of reproducibility, linearity, sensitivity, and resolution. Reproducibility is evaluated in terms of the coefficient of variation %CV = σ/μ × 100 with σ standard deviation and μ mean value of the experimental data. Linearity is evaluated in terms of the squared correlation coefficient R2 of the linear regression curve best-fitting the experimental data. Sensitivity S is evaluated in terms of the slope of the linear regression curve best-fitting the experimental data. Resolution is evaluated in terms of the limit of detection LoD = 3σ/S with σ standard deviation value of the experimental notch position in water, which is used as the reference solution. An excellent reproducibility (%CV < 0.02%) and linearity (R2 > 0.98), as well as high sensitivity (S = 430 nm per RIU) and good limit of detection (LoD = 1.4 × 10⁻⁵ RIU) are achieved. The analytical performance of the platform is either comparable to (e.g., capillary ring resonators) or better than (e.g., 2-D PhCs, planar ring resonators, microsphere ring resonators) the integrated state-of-the-art refractometers under a pressure-driven operation.19


image file: c4ra09056j-f4.tif
Fig. 4 Optical characterization of the 1D PhC self-powered drop-and-measure platform. (a and c) Typical reflectivity spectra (around 1.3 μm) of the 1D PhC upon capillary infiltration with ethanol–water mixtures (a) and BSA solutions (c). (b and d) Calibration curves of the 1D PhC upon capillary infiltration with ethanol–water mixtures (b) and BSA solutions (d).

The benchmark tests for the label-free biosensing applications are carried out using BSA aqueous solutions at different BSA concentrations in the range of 0.1–7%. An average incubation time of 5 minutes is used for all BSA solutions, which is compatible with the evaporation of solution from the 1D PhC structure. Fig. 4c shows the typical reflectivity spectra of the 1D PhC of the platform upon capillary infiltration with the different BSA solutions. A red shift of the notch wavelength position is evident as the BSA concentration increases, which can be explained in terms of both the modification of the PhC structure by BSA adsorption on the xz plane of the PhC silicon walls (surface effect) and the increased refractive index of the mixtures flowing in the PhC air-gaps (volume effect). Fig. 4d reports the calibration curve of the platform for the BSA solutions, which is the notch wavelength position (mean value and standard deviation) versus both the BSA concentration (top x-axis) and refractive index (bottom x-axis) of the BSA–water mixtures20 infiltrated into the 1D PhC structure. Each point represents the notch wavelength of a Lorentzian fit of the experimental reflectivity spectra. Two different linear regimes are evident in Fig. 4d as the BSA concentration increases from 0.1% to 7%. A higher-sensitivity regime (either S = 3000 nm per RIU or S = 5.5 nm per %) occurs for lower BSA concentrations (below 1%); a lower-sensitivity regime (either S = 490 nm per RIU or S = 0.9 nm per %) occurs for higher BSA concentrations (above 1%). These two regimes can be explained in terms of the surface and bulk effects due to the non-specific adsorption of BSA on the PhC silicon surfaces (xz plane) and to the refractive index variation of the BSA solutions flowing in the PhC air-gaps, respectively. It is well known that surface coverage is dependent on the BSA concentration in solution and can be modeled by the Langmuir equation.21 At lower BSA concentrations, both the surface and volume effects influence the PhC reflection properties. Nonetheless, the formation of an adsorbed BSA layer on the silicon surfaces, with the surface coverage increasing with the BSA concentration of the solutions flowing in the PhC air-gaps, produces structural changes on the 1D PhC, which dominate the PhC reflection properties at lower BSA concentrations. At higher BSA concentrations, the surface coverage due to BSA adsorption on the silicon surfaces tends to saturate such that the variation of the refractive index of the BSA solutions infiltrating the PhC air-gaps dominates the PhC reflection properties.22–24 Note that at higher BSA concentrations the sensitivity value is 490 nm per RIU, as calculated through best-fitting of the experimental data, which is consistent with the sensitivity value obtained for the ethanol–water mixtures (430 nm per RIU) and explainable in terms of the volume effects due to the refractive index variations. By assuming the volume effects to be constant over the entire range of investigated BSA concentrations, surface sensitivity due to only BSA adsorption on the PhC silicon surfaces can be achieved by depurating the sensitivity values at lower BSA concentrations from the volume effects, thus obtaining S = 2510 nm per RIU (S = 4.6 nm per %). An excellent reproducibility (%CV < 0.05%) and linearity (R2 > 0.98), as well as good limit of detection (LoD either 2 × 10⁻⁶ RIU or 0.001%) are achieved, which is either comparable to or better than most of the state-of-the-art pressure-driven biosensors.

Modeling of capillary infiltration of the 1D PhC drop-and-measure platform

The fluidic path of the drop-and-measure platform tested in this work consists of a series of three components: (1) an inlet microchannel Ch1 (width w1 = 61 μm, height h1 = 90 μm, length l1 = 250 μm) connecting the inlet reservoir to the 1D PhC; (2) a 1D PhC consisting (from a fluidic point of view) of n independent microchannels (width w2 = 5 μm, height h2 = 90 μm, length l2 = 300 μm, n = 8); (3) an output microchannel Ch2 (width w3 = 61 μm, height h3 = 90 μm, length l3 = 250 μm) connecting the 1D PhC to the outlet reservoir. All these fluidic components are simultaneously fabricated in a silicon substrate by ECM technology,16 and then the platform is provided with either a glass or polymeric cover on top. Both the microfabricated silicon substrate and cover are treated in Piranha solutions such as to have the same OH termination of the surfaces and in turn, the same contact angle θ. It must be noted that ECM makes use of both functional and sacrificial structures for the fabrication of complex microsystems, which are functional to the microsystem operation and sacrificed for the microsystem fabrication, respectively. In the specific case of the platform reported in this work, the sacrificial structures are used for the fabrication of optical and fluidic paths, and their removal gives rise to an artificial periodic ripple (peak-to-peak amplitude of about 100 nm) at the bottom and side surfaces of both the fluidic and optical paths. Such an artificial ripple, which can be clearly seen in Fig. S3 (ESI), works as surface roughness in the fluidic paths, thus increasing the fluidic losses of channels Ch1 and Ch2 with respect to 1D PhC, which is fabricated without the use of the sacrificial structures and has a surface roughness as low as 10 nm.3,16 Such a difference in surface finishing between fluidic channels Ch1 and Ch2 and the 1D PhC cannot be neglected for the correct fluidic modeling of the platform in this work. Therefore, a non-dimensional coefficient μ is introduced into the capillarity equations to take into account the different viscous losses due to the different roughness of the surfaces, as described below.

For the capillary flow of the liquid within the inlet microchannel Ch1 (0 < x < l1), which is opened at both ends, the capillary pressure Pc1 at the liquid/air meniscus can be expressed as follows:

 
image file: c4ra09056j-t1.tif(1)
where x is the meniscus position along the channel, θ is the contact angle at the liquid–solid interface, which is supposed to be roughness-free, γ is the surface tension of the liquid, p1 = 2(w1 + h1) and S = w1h1 are perimeter and section area of Ch1, respectively. For contact angles 0° ≤ θ < 90°, the pressure drop ΔP across the liquid in the microchannel is ΔP = |Pc1| > 0, which highlights that the capillary pressure is responsible for the capillary motion of the liquid within the microchannel.

The mean speed vc1 of the liquid/air meniscus at the generic x position within the inlet microchannel Ch1 can be expressed, under the assumption of laminar flow, as follows:

 
image file: c4ra09056j-t2.tif(2)
where η is the dynamic viscosity of the liquid, and C1 = S12/2μ1p12 is a constant value, also known as the dissipation factor, where μ1 is the non-dimensional coefficient introduced to take into account the viscous losses due to the surface roughness in Ch1.

The time needed by the liquid/air meniscus to reach the generic x position within the microchannel Ch1 is obtained through integration of eqn (2):

 
image file: c4ra09056j-t3.tif(3)

As for the capillary flow in the 1D PhC and in the output microchannel Ch2, on the one hand, eqn (1) also describes capillary pressure in each single air gap of the 1D PhC (l1 < x < l1 + l2), as well as in the output microchannel Ch2 (l1 + l2 < x < l1 + l2 + l3), when suitable values for p and S are used.

On the other hand, application of the equation of continuity for the liquid mass flow rate in the net of channels of the platform, namely, between Ch1, air-gaps of 1D PhC and Ch2, allows the mean speeds vc2 and vc3 at the generic x position within the 1D PhC and the output channel Ch2, respectively, to be calculated from eqn (2):

 
image file: c4ra09056j-t4.tif(4)
 
image file: c4ra09056j-t5.tif(5)
where C2 = S22/2μ2p22 and C3 = S32/2μ3p32 are the dissipation factors, and μ2 and μ3 are the non-dimensional coefficients taking into account the viscous losses due to the surface roughness within the 1D PhC and Ch2, respectively.

By properly integrating vc2 and vc3, it is feasible to get the times tc2 and tc3 needed by the liquid/air meniscus to reach the generic x position within the 1D PhC (l1 < x < l1 + l2) and Ch2 (l1 + l2 < x < l1 + l2 + l3), respectively:

 
image file: c4ra09056j-t6.tif(6)
 
image file: c4ra09056j-t7.tif(7)
where t1 = tc1(l1), α2 = 2l1(nw2C2/w1C1) − 2l1, β2 = l1(α2 + l1), and t2 = tc2(l1 + l2), α3 = 2l2(w3C3/nw2C2) − 2l2, β3 = (l1 + l2)(α3 + l1 + l2).

By assuming that water is infiltrating the platform (η = 1 × 10⁻³ Pa s, γ = 73 × 10−3 N m−2, contact angle θ = 3.2°), the experimental time-resolved data are best-fitted with μ1 = μ3 = 20.8 × 10³ and μ2 = 12.

Fig. 5 shows the theoretical capillary pressure Pc(x), mean speed vc(x) and time tc(x) of the liquid/air meniscus versus the generic x position along the whole fluidic path of the drop-and-measure platform calculated for the case of water, which are in good agreement with the experimental results of the platform infiltration kinetics.


image file: c4ra09056j-f5.tif
Fig. 5 Theoretical capillary pressure Pc(x), mean speed vc(x) and time tc(x) of the liquid/air meniscus versus x position along the whole fluidic path of the self-powered drop-and-measure platform reported in this work, calculated for the case of water.

Conclusions

In this work, the effective and reliable operation of vertical one-dimensional photonic crystals by capillarity, i.e., without the use of external pumps, for self-powered refractometry and label-free (bio)sensing applications is demonstrated by the fabrication and testing of an autonomous drop-and-measure platform. The integrated platform is benchmarked for both refractometry and (bio)sensing applications, and shows high sensitivity and good limit of detection, as well as excellent reproducibility and linearity, which are comparable to the best stand-alone state-of-the-art pressure-driven devices. A breakthrough in point-of-care applications is envisaged by building on the synergistic use of photonic crystals and capillarity.

Acknowledgements

This research was partially funded by the Fondazione CARIPLO, Grant no. 2011-0308, and by the Italian Minister for University and Research (MIUR) Futuro in Ricerca (FIR) programme, Grant No. RBFR122KL1 (SENS4BIO). The authors wish to thank Dr G. Mazzini for providing BSA solutions and for fruitful discussions.

References

  1. Y. Zhao, X. Zhao and Z. Gu, Adv. Funct. Mater., 2010, 20, 2970 CrossRef CAS.
  2. S. Mandal, J. M. Goddard and D. Erickson, Lab Chip, 2009, 9, 2924 RSC.
  3. S. Surdo, S. Merlo, F. Carpignano, L. M. Strambini, C. Trono, A. Giannetti, F. Baldini and G. Barillaro, Lab Chip, 2012, 12, 4403 RSC.
  4. W. Shen, M. Li, B. Wang, J. Liu, Z. Li, L. Jiang and Y. Song, J. Mater. Chem., 2012, 22, 8127 RSC.
  5. Y. Guo, H. Li, K. Reddy, H. S. Shelar, V. R. Nittoor and X. Fan, Appl. Phys. Lett., 2011, 98, 041104 CrossRef.
  6. S. Haeberle and Z. R. Zengerle, Lab Chip, 2007, 7, 1081 RSC.
  7. L. Gervais, N. de Rooij and E. Delamarche, Adv. Mater., 2011, 23, H151 CrossRef CAS PubMed.
  8. E. Delamarche, A. Bernard, H. Schmid, B. Michel and H. Biebuyck, Science, 1997, 276, 779 CrossRef CAS PubMed.
  9. R. Safavieh and D. Juncker, Lab Chip, 2013, 13, 4180 RSC.
  10. G. Zhou, X. Mao and D. Juncker, Anal. Chem., 2012, 84, 7736 CrossRef CAS PubMed.
  11. L. Gervais, M. Hitzbleck and E. Delamarche, Biosens. Bioelectron., 2011, 27, 64 CrossRef CAS PubMed.
  12. D. Juncker, H. Schmid, U. Drechsler, H. Wolf, M. Wolf, B. Michel, N. de Rooij and E. Delamarche, Anal. Chem., 2002, 74, 6139 CrossRef CAS PubMed.
  13. L.-J. Yang, T.-J. Yao and Y.-C. Tai, J. Micromech. Microeng., 2004, 14, 220 CrossRef.
  14. M. Zimmermann, H. Schmid, P. Hunziker and E. Delamarche, Lab Chip, 2007, 7, 119 RSC.
  15. M. Zimmermann, P. Hunziker and E. Delamarche, Microfluid. Nanofluid., 2008, 5, 395 CrossRef.
  16. M. Bassu, S. Surdo and L. M. Strambini, Adv. Funct. Mater., 2012, 22, 1222 CrossRef CAS.
  17. X. Li, Y. He and M. T. Swihart, Langmuir, 2004, 20, 4720 CrossRef CAS PubMed.
  18. J. V. Herráez and R. Belda, J. Solution Chem., 2006, 35, 1315 CrossRef.
  19. I. M. White and X. Fan, Opt. Express, 2008, 16, 1021 Search PubMed.
  20. T. Tumolo, L. Angnes and M. S. Baptista, Anal. Biochem., 2004, 333, 273 CrossRef CAS PubMed.
  21. H.-J. Butt, K. Graf and M. Kappl, Physic and Chemistry of Interfaces, WILEY-VCH, Weinheim, 2003 Search PubMed.
  22. D. Dorfner, T. Zabel, T. Hurlimann, N. Hauke, L. Frandsen, U. Rant, G. Abstreiter and J. Finley, Biosens. Bioelectron., 2009, 24, 3688 CrossRef CAS PubMed.
  23. S. Kita, S. Hachuda, S. Otsuka, T. Endo, Y. Imai, Y. Nishijima, H. Misawa and T. Baba, Opt. Express, 2011, 19, 17683 CrossRef CAS PubMed.
  24. M. I. Lapsley, I.-K. Chiang, Y. B. Zheng, X. Ding, X. Mao and T. J. Huang, Lab Chip, 2011, 11, 1795 RSC.

Footnote

Electronic supplementary information (ESI) available. See DOI: 10.1039/c4ra09056j

This journal is © The Royal Society of Chemistry 2014
Click here to see how this site uses Cookies. View our privacy policy here.