DOI:
10.1039/C4RA08952A
(Paper)
RSC Adv., 2014,
4, 62793-62801
Enhanced electrocatalytic performance of cobalt oxide nanocubes incorporating reduced graphene oxide as a modified platinum electrode for methanol oxidation†
Received
20th August 2014
, Accepted 13th November 2014
First published on 13th November 2014
Abstract
Herein, we report a facile hydrothermal method for the preparation of cobalt oxide nanocubes incorporating reduced graphene oxide (rGO–Co3O4 nanocubes) for electrocatalytic oxidation of methanol. The synthesized rGO–Co3O4 nanocubes were characterized using transmission electron microscopy (TEM), field emission scanning electron microscopy (FESEM), X-ray diffraction (XRD), and Raman techniques. The electrochemical behavior of an rGO–Co3O4 nanocube modified electrode was studied using cyclic voltammetry (CV) and electrochemical impedance spectroscopy (EIS) techniques. The electrocatalytic performances of rGO–Co3O4 nanocube-modified electrodes with different wt% of GO were investigated in relation to methanol oxidation in an alkaline medium. The rGO–Co3O4 nanocube modified electrode showed enhanced current density due to oxidation of methanol when compared to the bare Pt, rGO, and Co3O4 nanocube modified electrodes. The optimal GO content for an rGO–Co3O4 nanocube-modified electrode to achieve a high electrocatalytic oxidation of methanol was 2 wt%, and it showed an anodic peak current density of 362 μA cm−2.
Introduction
The constantly increasing energy demand due to the depletion of conventional fossil fuel reserves and the rapid growth of environmental issues have led to the search for alternative power sources.1,2 These include direct methanol fuel cells (DMFCs) as alternative green, environmentally friendly, and sustainable power sources that can directly convert the chemical energy of methanol into electrical energy.3,4 A polycrystalline Pt electrode is the most commonly used electrode material in DMFCs. However, its high cost, scarcity, low power density, and poor CO-poisoning tolerance significantly hinder its commercialization and practical application.5,6 In order to reach a high power density and low production cost for DMFCs, well-designed and fabricated high-performance electrocatalysts with controlled compositions and morphologies have emerged as suitable for realizing high device performance.5,6
In this area, carbon-based nanomaterials, including activated carbon, carbon nanotubes (SWCNT, DWCNT, MWCNT), GO, and rGO have enormous potential to boost the performance of DMFCs.3,7,8 Among these, graphene plays a crucial role in the fabrication of advanced composite/hybrid electrocatalysts for high performance DMFCs because of its unique physicochemical properties, including a high specific surface area, superior electronic conductivity, and excellent stability.8–13 Several attempts have been made to apply metal and metal oxide nanomaterials incorporating graphene modified electrodes in DMFC applications to attain a high power density.14,15
Metal oxide incorporating graphene composites have gained tremendous attention because of their low-cost, facile synthesis, high electrocatalytic activity, and durability in DMFC applications.4,8,11,14,15 Currently, cobalt oxide (Co3O4) nanomaterials are more attractive due to their simple preparation method, diverse morphology, high catalytic activity, and applicability in electrocatalysis.16 Recently, Co3O4 nanomaterials combined with graphene have shown excellent electrocatalytic activities. Hence, these have been applied in the field of electrochemical energy conversion and storage.17 Xiao et al. reported the influence of the surface structure on the electrocatalytic activity of Co3O4 anchored graphene sheets toward an oxygen reduction reaction for a fuel cell application.18
In the present investigation, cobalt oxide nanocubes incorporated reduced graphene oxide (rGO–Co3O4 nanocubes) were prepared using GO (simplified Hummer's method19) with Co(II) ions by a simple hydrothermal method and used for electrocatalytic methanol oxidation. The as-prepared rGO–Co3O4 nanocubes were characterized using TEM, FESEM, XRD, and Raman techniques. The electrochemical behavior of rGO–Co3O4 nanocubes modified electrode was investigated using the CV and EIS techniques with a [Fe3(CN)6] redox couple as an electrochemical probe. The electrocatalytic performance toward methanol oxidation was investigated in an alkaline medium for rGO–Co3O4 nanocubes modified electrodes with different wt% of GO content and the optimized GO content for high performance was found to be 2 wt%, with a high peak current density of 362 μA cm−2 during a forward scan. The high electrochemical performance, low-cost, and ease of fabrication make these rGO–Co3O4 nanocubes modified electrode a potential candidate for direct methanol fuel cell applications.
Experimental methods
Materials
Graphite flakes were purchased from Asbury Inc. (USA). Sulfuric acid (H2SO4, 98%), potassium permanganate (KMnO4, >99%), hydrochloric acid (HCl, 35%), and ammonia solution (NH3, 25%) were purchased from R & M Chemicals. Cobalt acetate tetrahydrate (Co(CH3COO)2·4H2O) was purchased from Sigma Aldrich. Hydrogen peroxide (H2O2, 35%) and methanol (CH3OH) were obtained from Systerm, Malaysia. Distilled water was used throughout the experimental work.
Synthesis of rGO–Co3O4 nanocubes
In the typical process for the preparation of rGO–Co3O4 nanocubes, the graphene oxide (GO) was prepared by using a simplified Hummer's method.19 A 12 mL of Co(CH3COO)2·4H2O (83 mM) was mixed with different wt% of GO (1, 2, 4, 8, and 12 wt%) and stirred for 2 h to obtain a homogeneous solution. After that, 15 mL of 6% ammonia was slowly added drop-wise into the above reaction mixture under vigorous stirring. Then, 75 mL of the reaction mixture was transferred to a 100 mL Teflon-lined stainless steel autoclave and subjected to hydrothermal treatment at 180 °C for 12 h. Finally, the obtained precipitate of rGO–Co3O4 nanocubes was washed five times with DI water and ethanol and dried in a hot air oven at 60 °C. For comparison, Co3O4 and rGO were prepared using a similar method without using GO and (Co(CH3COO)2·4H2O), respectively.
Preparation of modified electrode
An rGO–Co3O4 nanocubes modified electrode was fabricated by dispersing 1 mg of the synthesized rGO–Co3O4 nanocubes in 1 mL of deionized water and then sonicating it for 30 min to ensure a homogeneous dispersion. A 5 μL of the colloidal rGO–Co3O4 nanocubes solution was cast on a polycrystalline Pt electrode and then dried in a hot air oven at 65 °C for 1 h. This Pt/rGO–Co3O4 nanocubes modified electrode was used for the electrocatalytic oxidation of methanol.
Characterization techniques
The size and shape of the rGO–Co3O4 nanocubes were studied using a JEOL JEM-2100F high-resolution transmission electron microscope. The surface morphology and elemental composition were examined using a JEOL JSM-7600F field emission scanning electron microscope. Raman spectra were acquired from a Renishaw inVia 2000 system with a green laser emitting at 532 nm. The crystalline nature and phase identification of the rGO–Co3O4 nanocubes were recorded using a Philips X'pert X-ray diffractometer with copper Kα radiation (λ = 1.5418 Å) at a scan rate of 0.02° sec−1. All the electrochemical measurements were carried out using a VersaSTAT-3 electrochemical analyzer (Princeton Applied Research, USA) with a conventional three-electrode system under a nitrogen atmosphere at room temperature (27 °C). The rGO–Co3O4 nanocubes modified electrode was used as a working electrode, a platinum wire served as a counter electrode, and a Ag/AgCl electrode was the reference electrode. The supporting electrolyte and target substrate were composed of 0.1 M KOH and 0.1 M CH3OH, respectively. All the potentials are quoted against the Ag/AgCl electrode unless otherwise mentioned.
Results and discussion
Formation of rGO–Co3O4 nanocubes
Fig. 1 shows a schematic illustration of the formation of Co3O4 nanocubes incorporated rGO sheets fabricated using a hydrothermal method. In this typical synthetic process, a Co(II) precursor was added to the preformed GO solution, and the medium was changed to basic with the help of an NH3·H2O solution. Upon the hydrothermal process, the GO–Co(OH)2 transformed into rGO–Co3O4 nanocubes. The Co3O4 nanocubes were incorporated like spacers between the disorderedly stacked graphene sheets.
 |
| | Fig. 1 Schematic representation for the preparation of rGO–Co3O4 nanocubes. | |
Morphological studies of rGO–Co3O4 nanocubes
The FESEM images of the rGO–Co3O4 nanocubes show that the Co3O4 nanocubes are incorporated onto the surfaces of graphene sheets. As can clearly be seen in Fig. 2(c), the rGO–Co3O4 nanocubes with 2 wt% of GO lacked sufficient graphene sheet surfaces to anchor the Co3O4 nanocubes, which resulted in a large number of Co3O4 nanocubes being exposed on the surface. When the GO content was increased to 12 wt% in the rGO–Co3O4 nanocubes (Fig. 2(d)) many of the Co3O4 nanocubes were sandwiched between the disorderly stacked graphene sheets, and few of the Co3O4 nanocubes were exposed on the surface. For comparison, the disorderly stacked graphene sheets and Co3O4 nanocubes prepared using the hydrothermal method are shown in Fig. 2(a and b).
 |
| | Fig. 2 FESEM images of (a) rGO, (b) Co3O4 nanocubes, and (c and d) rGO–Co3O4 nanocubes with 2 and 12 wt% of GO. | |
TEM images of the Co3O4 nanocubes and rGO–Co3O4 nanocubes are shown in Fig. 3. There is a clear distinction between the bare and graphene-supported Co3O4 nanocubes. Fig. 3(a) shows the Co3O4 nanocubes without any graphene sheets. As seen, the obtained materials had irregular shapes. It should be emphasized that the absence of graphene affected the Co3O4 nanocubes formation. The Co3O4 nanocubes incorporated graphene is shown in Fig. 3(b). It can be seen that the Co3O4 nanocubes are anchored on the transparent graphene sheet surfaces. This result clearly reveals that the graphene plays a role in the formation of Co3O4 nanocubes.
 |
| | Fig. 3 TEM images of (a) Co3O4 nanocubes and (b) rGO–Co3O4 nanocubes. | |
X-ray diffraction analysis of rGO–Co3O4 nanocubes
The crystalline natures of the prepared GO, rGO, Co3O4 nanocubes, and rGO–Co3O4 nanocubes were studied by recording the XRD patterns, and their results are shown in Fig. S1.† The GO (Fig. S1(a)†) shows a strong and sharp diffraction peak at the 2θ value of 10° due to the (001) plane.20 After the hydrothermal process for GO, an intense sharp peak disappears at the 2θ value of 10°, and two new broad peaks appear at the 2θ values of 26.8° and 42.7°, which can be attributed to the (002) and (100) planes for rGO, respectively (Fig. S1(b)†). The two observed diffraction peaks originate from the disorderedly stacked graphene sheets, which confirms the successful reduction of GO into rGO.20,21 The Co3O4 nanocubes and rGO–Co3O4 nanocubes (Fig. S1(c–d)†) show a characteristic diffraction pattern at the 2θ values around 31.2°, 36.8°, 44.7°, 55.5°, 59.2°, and 65.1°, which were readily indexed to the respective (220), (311), (400), (422), (511), and (440) planes of face centered cubic Co3O4 (JCPDS card no. 42-1467).21,22 For the rGO–Co3O4 nanocubes (Fig. S1(d)†), the diffraction peak of rGO is undistinguishable, which clearly indicates that the face-to-face stacking of the rGO sheets is absent because of the formation of Co3O4 nanocubes on both sides of the rGO sheets.22
Raman studies of rGO–Co3O4 nanocubes
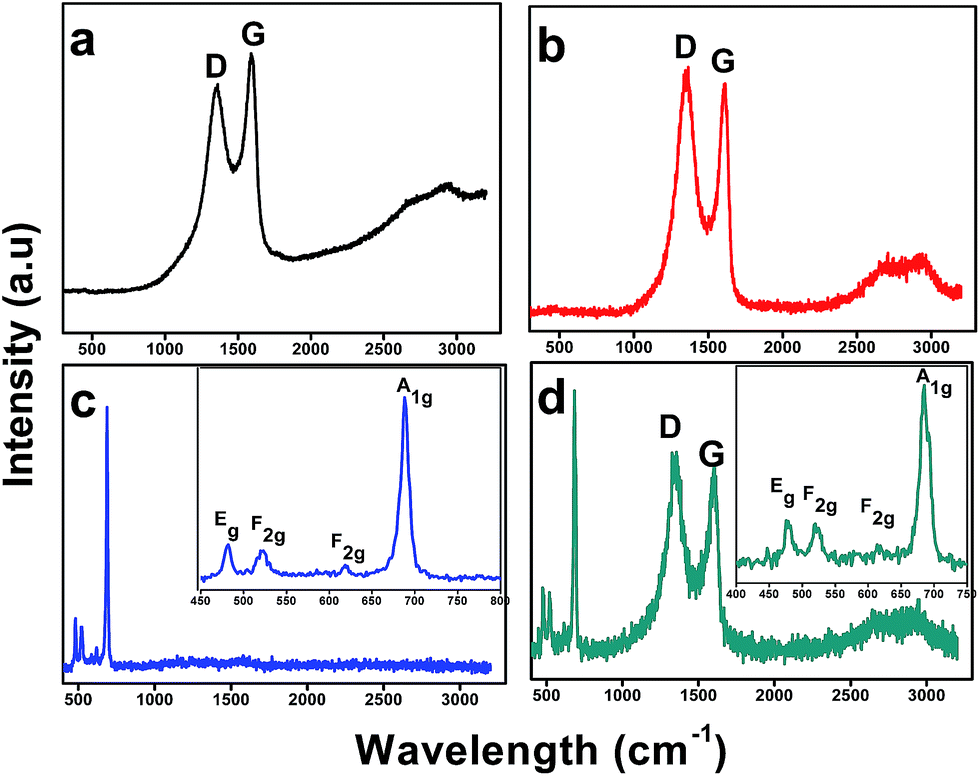
Raman analysis is more suitable tool and most commonly employed to differentiate the graphene (graphene oxide and reduced graphene oxide) from the very thin graphite sheets. It is known from the previous reports,23–26 the graphite sheets has in-phase vibration of the highly ordered graphite lattice (G band) at 1575 cm−1 and a very weak D band at 1355 cm−1 due to the disorder graphite edges. In contrast, the graphene oxide and reduced graphene oxide has well defined D and G band at 1355 and 1595 cm−1 in comparison with graphite.23–26 The Raman spectra of the GO, rGO, Co3O4 nanocubes, and rGO–Co3O4 nanocubes were recorded and are shown in Fig. 4. The Raman spectrum for GO shows D and G band peaks at 1355 and 1595 cm−1 due to the sp3 defects and in-plane vibrations of sp2 carbon atoms, respectively.27,28 A small bump in Fig. 4(a and b) was observed related to the band 2D for GO (2680 cm−1) and rGO (2694 cm−1) respectively. This shows the multilayer GO and rGO, also a shift to higher wavelengths in the 2D band of rGO was observed after reduction from GO which indicates the restacking of graphene sheets due to the removal of functional group from GO which may prevent restacking of GO sheets after it was reduced.28 It was observed that 2D band of rGO in Fig. 4(d) retain the same position as for GO showing no stacking of graphene layers. It may because of Co3O4 nanocubes behave like spacer in between the graphene sheets as confirmed by FESEM image. It was also demonstrated that D band remained unchanged, while the G band of rGO was shifted to 1610 cm−1 because of the “self-healing” characteristics of the rGO, which recovers the hexagonal network of carbon atoms with defects. In addition D/G band intensity ratio for rGO greater than that of GO suggesting decrease in sp2 domain of GO after reduction.27,29 This observation clearly indicates the successful transformation of GO to rGO (Fig. 4(a and b)). The Raman spectrum of the rGO–Co3O4 nanocubes (Fig. 4(d)) shows four peaks at approximately 482, 525, 615, and 686 cm−1, which correspond to the Eg, F2g, F2g, and A1g modes of Co3O4, along with the D and G bands for rGO.30–32
 |
| | Fig. 4 Raman spectra obtained for the (a) GO, (b) rGO, (c) Co3O4 nanocubes, and (d) rGO–Co3O4 nanocubes. | |
Electrochemical behavior of rGO–Co3O4 nanocubes modified electrode
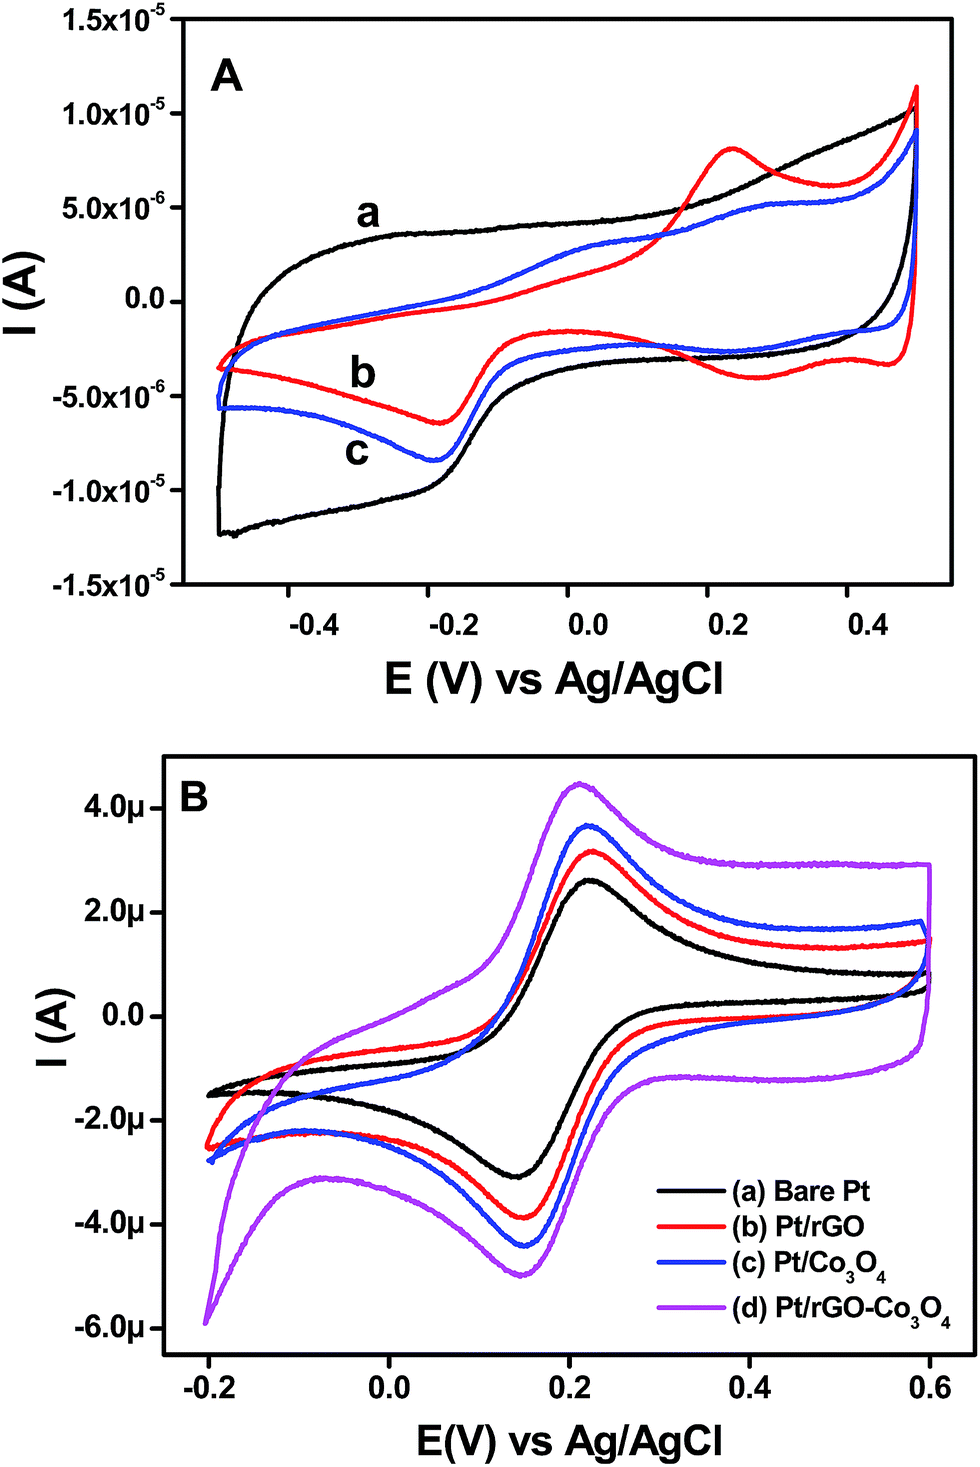
The rGO, Co3O4 nanocubes and rGO–Co3O4 nanocubes modified electrodes were electrochemically characterized by recording the cyclic voltammograms in 0.1 M KOH at a scan rate of 50 mV s−1 and their results are shown in Fig. 5(A). All the cyclic voltammograms show a clear peak at −0.2 V and a small peak at −0.1 V due to the hydrogen adsorption/desorption processes in this potential region. The anodic peaks observed for Co3O4 nanocubes and rGO–Co3O4 nanocubes modified electrodes around 50 mV were due to the adsorption of oxygen containing species such as, H2O and OH−,33,34 and another peak observed between 200–300 mV was attributed to the formation of higher valence oxides or hydroxides of cobalt in the alkaline medium.34,35 The observed cathodic peaks at 70 and 480 mV for the Co3O4 nanocubes and rGO–Co3O4 nanocubes modified electrodes are related to the regeneration of Co(II) species.35 The overall electrochemical processes36–39 during the anodic and cathodic scans are given in eqn (1) and (2) below:| | | Co3O4 + OH− + H2O ↔ 3CoOOH + e− | (1) |
| | | CoOOH + OH− ↔ CoO2 + H2O + e− | (2) |
 |
| | Fig. 5 (A) CVs obtained for the (a) rGO, (b) Co3O4 nanocubes and (c) rGO–Co3O4 nanocubes modified Pt electrodes in the presence of 0.1 M KOH at scan rate of 50 mV s−1. (B) CVs recorded at (a) bare Pt, (b) rGO, (c) Co3O4 nanocubes and (d) rGO–Co3O4 nanocubes modified electrodes for 1 × 10⁻³ M K3[Fe(CN)6] in 0.1 M KCl at a scan rate of 50 mV s−1. | |
The cyclic voltammograms for an rGO–Co3O4 nanocubes modified electrode in the presence of 1 mM K3[Fe(CN)6] in 0.1 M KCl at a scan rate of 50 mV s−1 shows a smaller peak potential separation (ΔEp) and larger peak current than those of a bare Pt electrode (Fig. 5(B)), indicating a rapid electron transfer and larger electroactive surface area for the rGO–Co3O4 nanocubes. After modification with rGO, Co3O4 nanocubes, and rGO–Co3O4 nanocubes, the ΔEp values decreased by 76, 67, and 60 mV, respectively, when compared to the bare Pt (80 mV), and the peak current increased on the order of rGO–Co3O4 nanocubes > Co3O4 nanocubes > rGO when compared to the bare Pt electrode (Fig. 5(B)). The noticeable increase in the anodic and cathodic peak current of the rGO–Co3O4 nanocubes compared to the rGO confirmed the contribution of the Co3O4 nanocubes to an increase in the electroactive surface area and the promotion of electron transfer. Notably, the rGO–Co3O4 nanocubes modified electrode showed a ΔEp value that was very similar to the ideal kinetics (59 mV) of a one-electron reversible process, suggesting the excellent conductivity and ideal reversibility of the redox reaction.
The scan rate was varied in the range of 10–500 mV s−1 for the rGO–Co3O4 nanocubes modified electrode with 1 × 10⁻³ M of K3[Fe(CN)6] in 0.1 M KCl, and the results are shown in Fig. S2(A).† It can be seen that the redox peak current for the anodic and cathodic scan increased linearly with the increasing scan rate, and no obvious shift is observed for the anodic and cathodic peak potentials. This clearly suggests that the electrochemical redox reaction that occurs for the rGO–Co3O4 nanocubes modified electrode is reversible. A plot of the anodic and cathodic peak current vs. square root of the scan rate is shown in Fig. S2(B),† which shows the linear relation for the rGO–Co3O4 nanocubes modified electrode (R2 = 0.9938 and 0.9942), indicating an adsorption controlled redox process.40
In order to investigate the electrochemical behavior of bare Pt, rGO, Co3O4 nanocubes and rGO–Co3O4 nanocubes modified electrode, electrochemical impedance spectroscopic (EIS) analyses were performed by dipping the electrodes into a solution containing 1 × 10⁻³ M K3[Fe(CN)6] in 0.1 M KCl at a scanning frequency range of 0.01–120![[thin space (1/6-em)]](https://www.rsc.org/images/entities/char_2009.gif) 000 Hz. The Nyquist plots for the bare Pt, rGO, Co3O4 nanocubes and rGO–Co3O4 nanocubes modified electrodes show a line in the low-frequency region and an arc in the high frequency region (Fig. 6(A) and S3†). The bare Pt electrode shows a large semicircle compared to the other modified electrodes, which is a result of the large charge-transfer resistance (Rct) at the electrode/electrolyte interface due to the sluggish electron transfer kinetics. It can obviously be seen that Rct decreased for the rGO, Co3O4 nanocubes and rGO–Co3O4 nanocubes modified electrodes, which can be attributed to the presence of high conductive rGO sheets and catalytically active Co3O4 nanocubes on the electrode surface. Fig. 6(B) shows the Bode-phase plots of various modified electrodes in the frequency range of 0.1–10000 Hz. A higher phase peak intensity can be seen at a frequency range of 100–1000 Hz, which is attributed to the charge-transfer resistance of the modified electrode.41,42 Interestingly, the phase peaks in the Bode plots for the rGO, Co3O4 nanocubes and rGO–Co3O4 nanocubes modified electrode are shifted to a low frequency region of 0.1–100 Hz as a result of the high electron transfer behavior of the highly conductive rGO sheets and the catalytically active Co3O4 nanocubes based modified electrodes.
000 Hz. The Nyquist plots for the bare Pt, rGO, Co3O4 nanocubes and rGO–Co3O4 nanocubes modified electrodes show a line in the low-frequency region and an arc in the high frequency region (Fig. 6(A) and S3†). The bare Pt electrode shows a large semicircle compared to the other modified electrodes, which is a result of the large charge-transfer resistance (Rct) at the electrode/electrolyte interface due to the sluggish electron transfer kinetics. It can obviously be seen that Rct decreased for the rGO, Co3O4 nanocubes and rGO–Co3O4 nanocubes modified electrodes, which can be attributed to the presence of high conductive rGO sheets and catalytically active Co3O4 nanocubes on the electrode surface. Fig. 6(B) shows the Bode-phase plots of various modified electrodes in the frequency range of 0.1–10000 Hz. A higher phase peak intensity can be seen at a frequency range of 100–1000 Hz, which is attributed to the charge-transfer resistance of the modified electrode.41,42 Interestingly, the phase peaks in the Bode plots for the rGO, Co3O4 nanocubes and rGO–Co3O4 nanocubes modified electrode are shifted to a low frequency region of 0.1–100 Hz as a result of the high electron transfer behavior of the highly conductive rGO sheets and the catalytically active Co3O4 nanocubes based modified electrodes.
 |
| | Fig. 6 (A) Nyquist plots and (B) Bode phase plots obtained for (a) bare Pt, (b) rGO, (c) Co3O4 nanocubes and (d) rGO–Co3O4 nanocubes modified Pt electrodes for 1 × 10⁻³ M K3[Fe(CN)6] in 0.1 M KCl. | |
Electrocatalytic oxidation of methanol at rGO–Co3O4 nanocubes modified electrode
The schematic representation of methanol oxidation at the Pt/rGO–Co3O4 modified electrode is shown in Fig. 7. During the electrooxidation of methanol, the anodic oxidation peak current is obtained due to the oxidation of freshly chemisorbed species coming from the adsorption of methanol and the formation of intermediate carbonaceous species in the forward scan and further it reacts with adsorbed CO on the electrode to produce CO2, H2O, electron (e−). In the reverse scan, the oxidation peak is primarily associated with removal/oxidation of carbonaceous species not completely oxidized in the forward scan, rather than caused by freshly chemisorbed species. In order to investigate the electrocatalytic activity of the prepared rGO–Co3O4 nanocubes modified Pt electrode, a cyclic voltammogram was recorded in the presence of 0.1 M CH3OH and 0.1 M KOH at a scan rate of 50 mV s−1, and its results are shown in Fig. 8(d). For comparison purposes, cyclic voltammograms were also recorded for polycrystalline Pt, rGO and Co3O4 nanocubes modified electrodes under the same conditions (Fig. 8(a–c)). Interestingly the rGO–Co3O4 nanocubes modified electrode showed a higher electrocatalytic oxidation current density during forward (358 μA cm−2) and backward (196 μA cm−2) scans compared to the other modified electrodes (polycrystalline Pt, rGO, and Co3O4 nanocubes). The peak currents observed during the forward and reverse scans were due to the methanol oxidation and removal of the residual carbonaceous species formed in the forward scan, respectively.43,44 The higher electrocatalytic activity of the rGO–Co3O4 nanocubes modified electrode was mainly due to the combination of the cubic Co3O4 structure and highly conductive reduced graphene oxide (Fig. 2 and 4) and this catalytic activity is good in agreement with the FESEM and Raman results (Fig. 2 and 4). The enhanced structural features of Co3O4 nanocubes incorporated rGO resulted in the efficient electron transport to the active sites on the catalyst than the bare Co3O4 nanocubes. Hence, the FESEM images (Fig. 2) supported the fact that the high dispersion of Co3O4 nanocubes into the rGO matrix leads to significantly enhanced the electrocatalytic performance. Xiao et al. reported that the electrocatalytic activity was significantly influenced by the graphene when it was incorporated into different Co3O4 nanostructures.18
 |
| | Fig. 7 Schematic mechanism for the electrocatalytic oxidation of methanol at Pt/rGO–Co3O4 modified electrode. | |
 |
| | Fig. 8 CVs obtained for the (a) bare Pt, (b) rGO, (c) Co3O4 nanocubes and (d) rGO–Co3O4 nanocubes modified Pt electrodes in the presence of 0.1 M CH3OH and 0.1 M KOH at a scan rate of 50 mV s−1. | |
Optimization of rGO content in rGO–Co3O4 nanocubes modified electrode for efficient methanol oxidation
Optimizing the weight percentage of the GO in the rGO–Co3O4 nanocubes is very important to attain a high electrocatalytic performance toward methanol oxidation. In this regard, the wt% of the GO content in the rGO–Co3O4 nanocubes was varied and the obtained results are shown in Fig. S4(A).† The observed results clearly suggest that the oxidation current density was increased during the forward and reverse scans with the increasing of the GO content until it reached a maximum of 2 wt% of GO in composite of rGO–Co3O4. After this, a further increase in the GO content of the rGO–Co3O4 nanocubes led to a decrease in the current density during the forward and reverse scans (Fig. S4(A)†). The observed current densities for methanol oxidation during the forward and reverse scan for rGO–Co3O4 nanocubes with different GO contents are summarized in Fig. S4(B).† The decrease in the current density with increasing GO content, which was due to the decrease in the anodic peak current that resulted from the restacking of the graphene nanosheets, substantially decreased the active catalytic sites on the electrocatalysts.45,46
Influence of scan rate and methanol concentration on electrocatalytic activity of rGO–Co3O4 nanocubes modified electrode
The effect of the scan rate on the electrocatalytic oxidation of methanol was investigated for the rGO–Co3O4 nanocubes modified electrode in the presence of 0.1 M CH3OH and 0.1 M KOH at different scan rates in the range of 10–200 mV s−1, and the results are shown in Fig. 9(A). It can be seen that the oxidation peak current density increased with increasing scan rate. The observed anodic peak current density is plotted against the scan rate for the rGO–Co3O4 nanocubes modified electrode and is shown in the inset of Fig. 9(A). An increase in the scan rate likely enhanced the electron movement. The rGO–Co3O4 nanocubes modified electrode showed a linear relationship between the anodic peak current density obtained from the forward scans and the square root of the scan rate toward methanol oxidation. This suggests that the oxidation of methanol at the rGO–Co3O4 nanocubes modified electrode is a diffusion-controlled process.
 |
| | Fig. 9 (A) CV recorded for rGO–Co3O4 nanocubes modified Pt electrode in presence of 0.1 M CH3OH and 0.1 M KOH at different scan rates in range of 10–200 mV s−1. (Inset) Plot of scan rate versus anodic peak current density obtained from the CV measurements. (B) CV recorded for rGO–Co3O4 nanocubes modified electrode at scan rate 50 mV s−1 in presence of 0.1 M KOH and various concentrations of CH3OH. (Inset) Plot of methanol concentration versus anodic peak current density for rGO–Co3O4 nanocubes modified Pt electrode. | |
The methanol concentration is a crucial factor in the practical application of direct methanol fuel cells. The influence of the methanol concentration was studied by varying the methanol content in an rGO–Co3O4 nanocubes modified electrode at a scan rate of 50 mV s−1 in the presence of 0.1 M KOH and the results are shown in Fig. 9(B). It can be observed that the anodic peak current density increases and the anodic peak potential have a slightly positive shift with an increase in the methanol concentration. The positive shift in the anodic peak potential with increasing methanol concentration is due to the saturation of active sites at the surface of the rGO–Co3O4 nanocubes modified electrode.
Reversibility and stability of the rGO–Co3O4 nanocubes modified electrode towards methanol oxidation
The reliability of the Pt electrode modified with the rGO–Co3O4 nanocubes towards the electrocatalytic oxidation of methanol was investigated by repeating the CV measurements continually up to 100 cycles. Fig. 10(A) shows the CV curves for the proposed Pt/rGO–Co3O4 modified electrode in 0.1 M KOH and 0.1 M CH3OH. It can be clearly seen that the CV curves are stable and the current density at −150 mV (vs. Ag/AgCl) shows 108% retention (increased from 350 to 380 μA cm−2) after 100 cycles. Thus, the proposed Pt/rGO–Co3O4 modified electrode shows good sensitivity and better stability towards the electrocatalytic oxidation of methanol.
 |
| | Fig. 10 (A) Cyclic voltammograms obtained for the rGO–Co3O4 nanocubes modified Pt electrode in the presence of 0.1 M CH3OH and 0.1 M KOH at a scan rate of 50 mV s−1 with 1 to 100 cycles. (B) Chronoamperometric curve obtained for the Pt/rGO–Co3O4 modified electrode in the presence of 1 μM CH3OH and 0.1 M KOH at a scan rate of 50 mV s−1 at a fixed potential of −150 mV vs. Ag/AgCl. | |
The electrocatalytic stability of the Pt/rGO–Co3O4 modified electrode was studied using chronoamperometry. Fig. 10(B) showed the chronoamperometric curve of 1 mM CH3OH in 0.1 KOH for the Pt/rGO–Co3O4 modified electrode at an applied potential of −150 mV and the electrode shows the rapid decrease in the potentiostatic current at the initial stage during the oxidation of methanol due to the formation of intermediate species, such as COads and CHOadsetc.47,48 Then, the current was gradually decayed and achieved the pseudo-steady state. Similar observation also reported to illustrate the stability of the modified electrode for the electrocatalytic oxidation of methanol with the Pt/graphene,48 Pt/Vulcan,48 Pt/C–MoC–Gl.49
Conclusions
Co3O4 nanocubes incorporating reduced graphene oxide were successfully synthesized using a simple hydrothermal method. The as-prepared rGO–Co3O4 nanocubes combined the unique properties of graphene with the effects of Co3O4 nanocubes and showed a superior electrocatalytic activity and high poisoning tolerance for methanol electro-oxidation compared with bare Pt, rGO and Co3O4 nanocube modified electrodes. In particular, the best electrocatalytic activity for the rGO–Co3O4 nanocube modified electrode in an alkaline environment could be achieved with an optimized GO content of 2 wt%, and it showed an anodic peak current density of 362 μA cm−2 during the forward scan. Further, the modified electrode showed good reversibility with the retention of 108% and stability towards methanol oxidation. Considering the low-cost, facile, and controllable method for the preparation of rGO–Co3O4 nanocubes and the improved electrocatalytic activity toward methanol oxidation, this direct strategy can applied to the development of metal oxide–graphene composites as new electrode materials for high performance direct methanol fuel cells.
Acknowledgements
This work was financially supported by a University of Malaya Research Grant UMRG Programme (RP007C-13AFR) Science Fund from the Ministry of Science, Technology and Innovation (06-01-04-SF1513); and a High Impact Research Grant from the Ministry of Higher Education of Malaysia (UM.C/625/1/HIR/MOHE/SC/21).
References
- N. Armaroli and V. Balzani, Angew. Chem., Int. Ed., 2007, 46, 52 CrossRef CAS PubMed.
- I. Dincer, Renewable Sustainable Energy Rev., 2000, 4, 157 CrossRef.
- H.-J. Choia, S.-M. Junga, J.-M. Seoa, D. W. Chang, L. Daic and J.-B. Baeka, Nano Energy, 2012, 1, 534 CrossRef PubMed.
- X. Li and A. Faghri, J. Power Sources, 2013, 226, 223 CrossRef CAS PubMed.
- W. Zheng, A. Suominen and A. Tuominen, Energy Procedia, 2012, 28, 78 CrossRef CAS PubMed.
- X. Zhao, M. Yin, L. Ma, L. Liang, C. Liu, J. Liao, T. Luc and W. Xing, Energy Environ. Sci., 2011, 4, 2736 CAS.
- V. Chabot, D. Higgins, A. Yu, X. Xiao, Z. Chena and J. Zhang, Energy Environ. Sci., 2014, 7, 1564 CAS.
- H. Huang and X. Wang, J. Mater. Chem. A, 2014, 2, 6266 CAS.
- X. Zhou, J. Qiao, L. Yang and J. Zhang, Adv. Energy Mater., 2014, 4, 1301523 Search PubMed.
- S. H. Hur and J. N. Park, Asia-Pac. J. Chem. Eng., 2013, 8, 218 CrossRef CAS.
- N. Mahmood, C. Zhang, H. Yin and Y. Hou, J. Mater. Chem. A, 2014, 2, 15 CAS.
- A. Li, J. Liu and S. Feng, Sci. Adv. Mater., 2014, 6, 209 CrossRef CAS PubMed.
- S. Guo and S. Dong, Chem. Soc. Rev., 2011, 40, 2644 RSC.
- C. Zhu and S. Dong, Nanoscale, 2013, 5, 10765 RSC.
- M. Liu, R. Zhang and W. Chen, Chem. Rev., 2014, 114, 5117 CrossRef CAS PubMed.
- F. Jiao and H. Frei, Energy Environ. Sci., 2010, 3, 1018 CAS.
- Z.-S. Wua, G. Zhoua, L.-C. Yina, W. Rena, F. Lia and H.-M. Chenga, Nano Energy, 2012, 1, 107 CrossRef PubMed.
- J. Xiao, Q. Kuang, S. Yang, F. Xiao, S. Wang and L. Guo, Sci. Rep., 2013, 3, 2300 Search PubMed.
- H. N. Ming, H. N. Lim, C. H. Chia, M. A. Yarmo and M. R. Muhamad, Int. J. Nanomed., 2011, 6, 3443 Search PubMed.
- G. Wang, J. Yang, J. Park, X. Gou, B. Wang, H. Liu and J. Yao, J. Phys. Chem. C, 2008, 112, 8192 CAS.
- Z.-S. Wu, W. Ren, L. Wen, L. Gao, J. Zhao, Z. Chen, G. Zhou, F. Li and H.-M. Cheng, ACS Nano, 2010, 4, 3187 CrossRef CAS PubMed.
- Z. Songa, Y. Zhangc, W. Liu, S. Zhang, G. Liuc, H. Chena and J. Qiu, Electrochim. Acta, 2013, 112, 120 CrossRef PubMed.
- A. C. Ferrari, Solid State Commun., 2007, 143, 47–57 CrossRef CAS PubMed.
- N. K. Konstantin, O. Bulent, C. S. Hannes, K. P. Robert, A. A. Ilhan and C. Roberto, Nano Lett., 2008, 8, 36–41 CrossRef PubMed.
- J. K. Hyo, S.-M. Lee, Y.-S. Oh, Y.-H. Yang, Y. S. Lim, D. H. Yoon, C. Lee, J.-Y. Kim and R. S. Ruoff, Sci. Rep., 2014, 4, 5176 Search PubMed.
- R. Tuinstra and J. L. Koenig, J. Chem. Phys., 1970, 53, 1126–1130 CrossRef PubMed.
- S. Stankovich, D. A. Dikin, R. D. Piner, K. A. Kohlhaas, A. Kleinhammes, Y. Jia, Y. Wu, S. T. Nguyen and R. S. Ruoff, Carbon, 2007, 45, 1558 CrossRef CAS PubMed.
- S. Thakur and N. Karak, Carbon, 2012, 50, 5331 CrossRef CAS PubMed.
- Q. Zheng, B. Zhang, X. Lin, X. Shen, N. Yousefi, Z.-D. Huang, Z. Li and J.-K. Kim, J. Mater. Chem., 2012, 22, 25072 RSC.
- H. Kim, D.-H. Seo, S.-W. Kim, J. Kim and K. Kang, Carbon, 2011, 49, 326 CrossRef CAS PubMed.
- J. Jiang and L. Li, Mater. Lett., 2007, 61, 4894 CrossRef CAS PubMed.
- H.-C. Liu and S.-K. Yen, J. Power Sources, 2007, 166, 478–484 CrossRef CAS PubMed.
- S. Bruckenstein and M. Shay, J. Electroanal. Chem., 1985, 188, 131–136 CrossRef CAS.
- M. Jafarian, M. G. Mahjani, H. Heli, F. Gobal, H. Khajehsharifi and M. H. Hamedi, Electrochim. Acta, 2003, 48, 3423 CrossRef CAS.
- I. G. Casella, J. Electroanal. Chem., 2002, 520, 119 CrossRef CAS.
- S. Park and S. Kim, Electrochim. Acta, 2013, 89, 516 CrossRef CAS PubMed.
- X. Wang, S. Liu, H. Wang, F. Tu, D. Fang and Y. Li, J. Solid State Electrochem., 2012, 16, 3593 CrossRef CAS PubMed.
- F. Svegl, B. Orel, M. Hutchins and K. Kalcher, J. Electrochem. Soc., 1996, 143, 1532 CrossRef CAS PubMed.
- C. Lin, J. A. Ritter and B. N. Popov, J. Electrochem. Soc., 1998, 145, 4097 CrossRef CAS PubMed.
- Z. Zhuang, J. Li, R. Xu and D. Xiao, Int. J. Electrochem. Sci., 2011, 6, 2149 CAS.
- H. Choi, C. Nahm, J. Kim, J. Moon, S. Nam, D.-R. Jung and B. Park, Curr. Appl. Phys., 2012, 12, 737 CrossRef PubMed.
- M. Gao, C. K. N. Peh, W. L. Ong and G. W. Ho, RSC Adv., 2013, 3, 13169 RSC.
- S. Sharma, A. Ganguly, P. Papakonstantinou, X. Miao, M. Li, J. L. Hutchison, M. Delichatsios and S. Ukleja, J. Phys. Chem. C, 2010, 114, 19459 CAS.
- S. Xiao, F. Xiao, Y. Hu, S. Yuan, S. Wang, L. Qian and Y. Liu, Sci. Rep., 2014, 4, 4370 Search PubMed.
- Y. Jiang, Y. Lu, F. Li, T. Wu, L. Niu and W. Chen, Electrochem. Commun., 2012, 19, 21 CrossRef CAS PubMed.
- A. Sudarvizhi, Z. A. Siddiqha and K. Pandian, J. Chem. Appl. Biochem., 2014, 1, 101 Search PubMed.
- A. Kabbabi, R. Faure, R. Durand, B. Beden, F. Hahn, J.-M. Leger and C. Lamy, J. Electroanal. Chem., 1998, 444, 41 CrossRef CAS.
- Y. Li, L. Tang and J. Li, Electrochem. Commun., 2009, 11, 846 CrossRef CAS PubMed.
- Z. Yan, G. He, P.-K. Shen, Z. Luo, J. Xie and M. Chen, J. Mater. Chem. A, 2014, 2, 4014 CAS.
Footnote |
| † Electronic supplementary information (ESI) available: XRD analysis, electrochemical properties and electrocatalytic methanol oxidation. See DOI: 10.1039/c4ra08952a |
|
| This journal is © The Royal Society of Chemistry 2014 |
Click here to see how this site uses Cookies. View our privacy policy here. 
 Open Access Article
 This Open Access Article is licensed under a